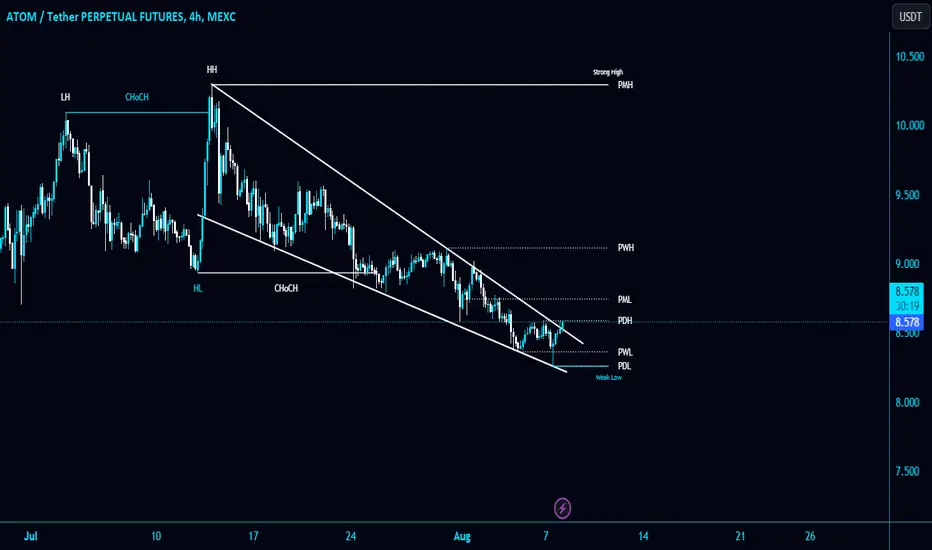
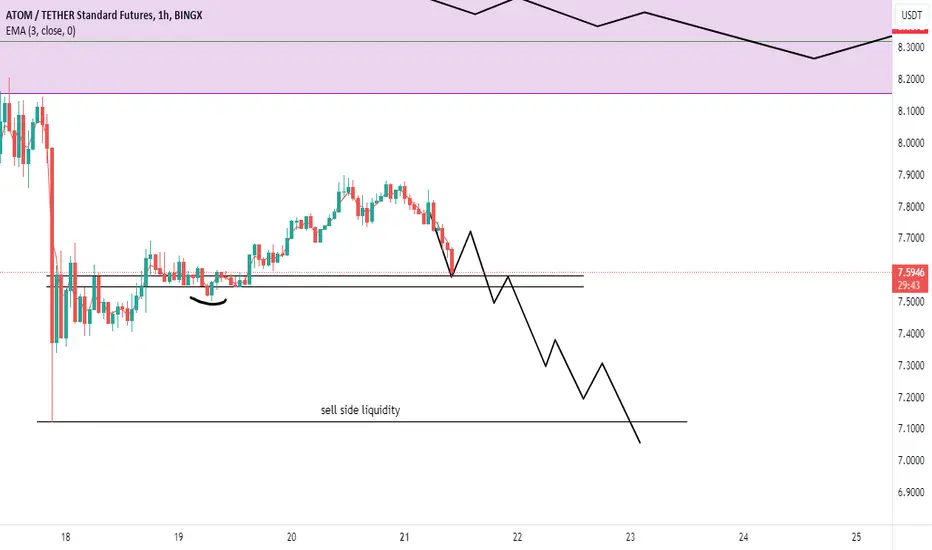
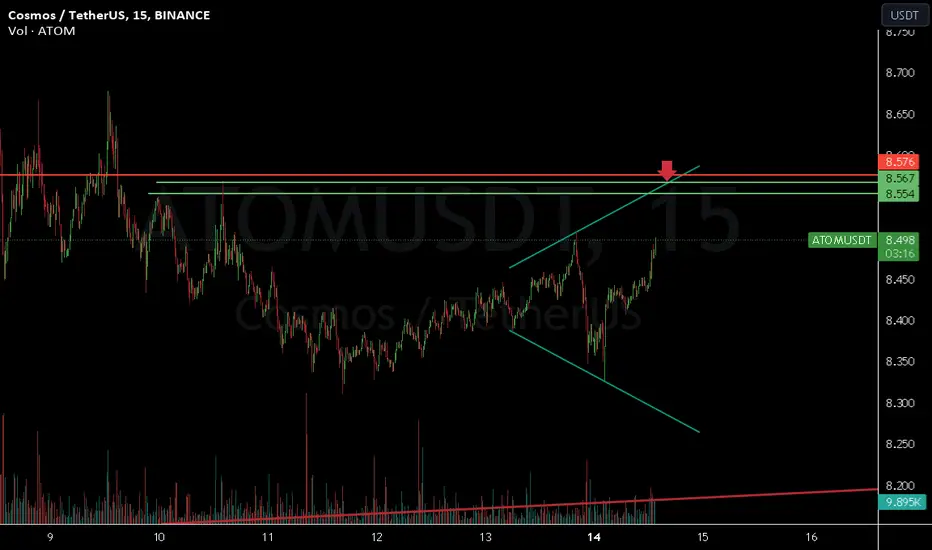
ATOMUSDT wnats a new Bearish impulse?Inside a Descending Channel: The current market situation involves ATOMUSDT being confined within a descending channel pattern. This pattern comprises two parallel trendlines: one functioning as resistance and the other as support. It suggests a potential continuation of the ongoing downtrend.
Potential Liquidity Grab at $9 Resistance: The analysis suggests the possibility of the price attracting new liquidity around the $9 area. This level was previously a support but has now transformed into resistance, as is often observed in technical analysis.
Plancton's Rules Application: Following the principles of Plancton's Rules and in alignment with the analysis, there's contemplation of a new short position. A short position entails selling the asset with the expectation of a price decrease.
–––––
Follow the Shrimp 🦐
Keep in mind.
🟣 Purple structure -> Monthly structure.
🔴 Red structure -> Weekly structure.
🔵 Blue structure -> Daily structure.
🟡 Yellow structure -> 4h structure.
⚫️ Black structure -> <= 1h structure.
Follow the Shrimp 🦐
ATOMUSDT trade ideas
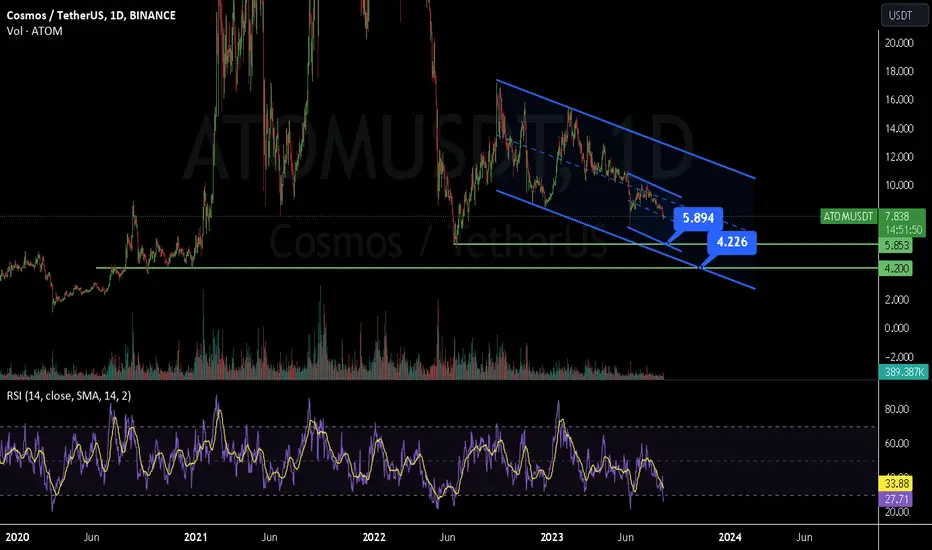
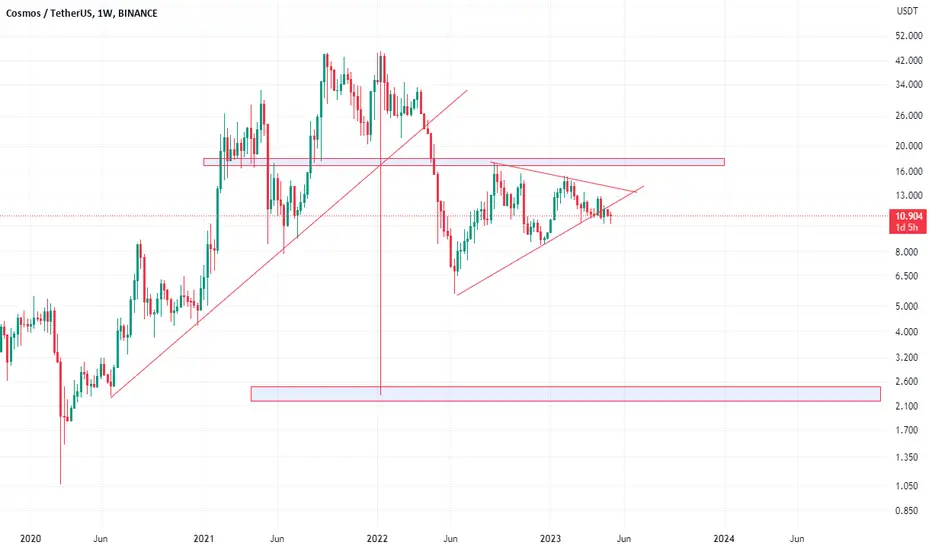
ATOM possible breakdown**Weekly Perspective:**
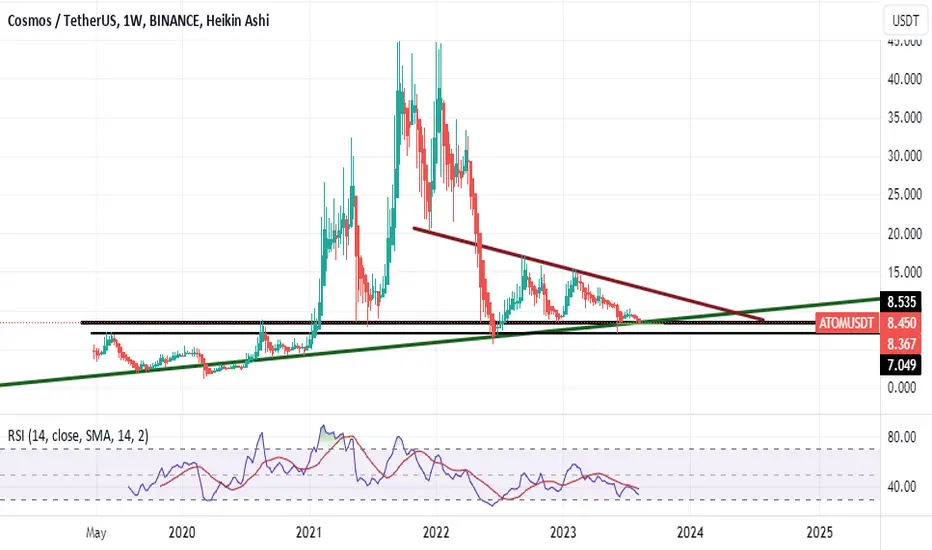
In the weekly time frame, ATOM is trading within a downward parallel channel. The upper line of the channel represents a strong resistance, while the lower line serves as a robust support line. Atom is forming a Lower High and Lower Low structural pattern, indicative of a bearish trend. One notable observation this week is the breach of one of ATOM's strongest support lines. A trendline drawn between the COVID-19 lows and the lows of June 2022 used to provide substantial support for ATOM. Even during the BTC drop from $30,000 to $25,000, this trendline offered support and boosted ATOM's price. However, this trendline was broken during the previous week's downturn, and ATOM is now trading below it, suggesting a potential further decline in the coming days. ATOM's ability to maintain the trendline support will determine its performance; otherwise, a significant price correction seems likely. The weekly RSI is at 33, indicating the possibility of further oversold conditions. Additionally, a bearish MACD crossover has been present since the third week of April.
In the weekly timeframe, there is also a double top pattern in ATOM, and the neckline of this pattern has been breached. The double top pattern itself is bearish, and it could contribute to future price declines for the coin.
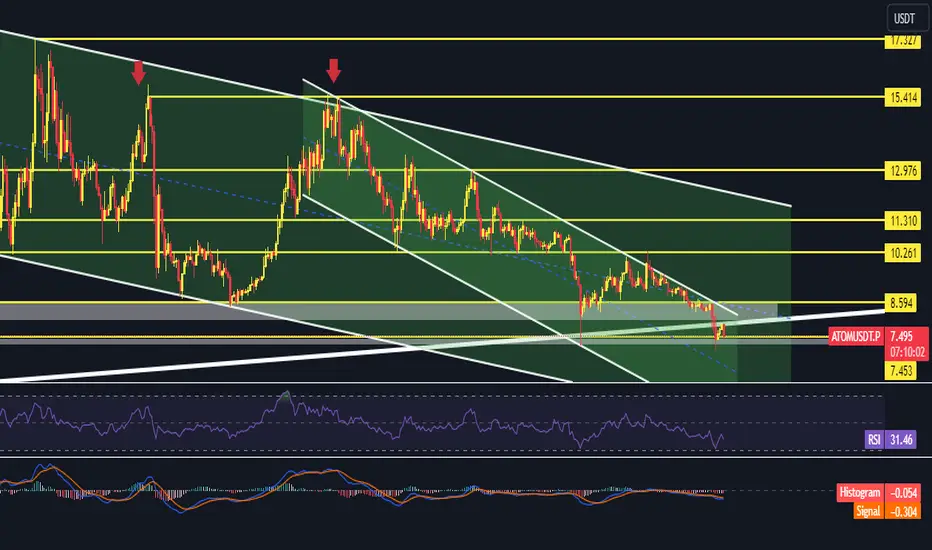
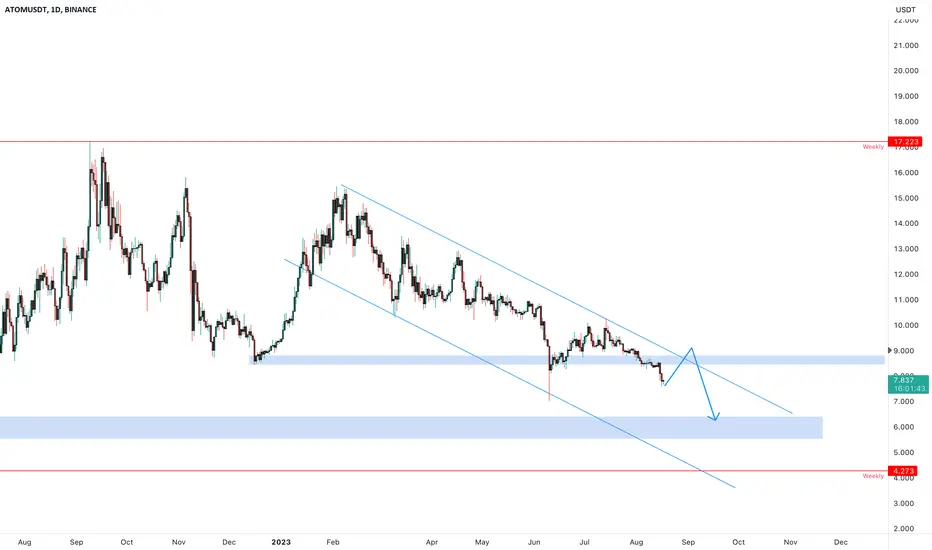
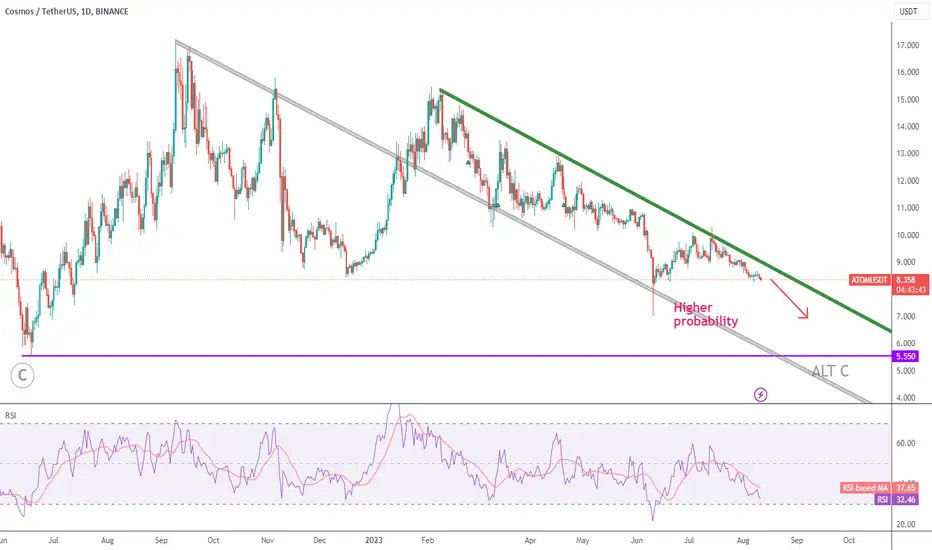
Looking at the daily timeframe, another downward parallel channel is evident in ATOM's price movement. The upper channel boundary has led to price decreases four times, while the lower boundary has caused two price increases. Even within this channel, ATOM is adhering to the Lower High and Lower Low pattern, underscoring the continued effects of this pattern on the falling price. On the daily chart, the RSI stands at 31, and the MACD is in negative territory.
ATOM's last stronghold lies within the horizontal support range of $7.13 to $7.5. A breach below $7 would trigger a sell-off, potentially causing the coin's price to drop further. Beyond this level, the next substantial support for ATOM is projected around $5.6 to $5.9. Therefore, falling below $7 could lead to a price range of $5.6 to $5.9 for ATOM.
Market sentiment is set to play a pivotal role in ATOM's survival and its ability to maintain crucial support levels. Unfortunately, sentiments for the upcoming week do not appear favorable. BTC continues to decline, with expectations of touching $25,000 to $25,200 to establish a solid support within this range. Furthermore, if sell-offs are observed in the S&P 500 and NASDAQ, it could translate to a downward trend in the crypto market as well.
Click on the link to understand market sentiments: cryptonewsbytes.com
Are you prepared for this update of AVAX: cryptonewsbytes.com
What can you expect for Litecoin, explained: cryptonewsbytes.com
NASDAQ and BTC, what will happen next: cryptonewsbytes.com
Atom Price decline According to my analysis atom is prone to go lower after a brief correction to take out the lower range liquidity
This could lead t seeing lower prices for atom
ATOM Possible Daily Movement 😎♻️😎♻️😎Hi dear traders
According to the previous analysis, we reached the desired goals.
Now considering the drawn channel, we consider the current bullish trend only as a pullback to the midline of the channel and expect the price to go down to the indicated OB area.
Let's see what happens
This is not financial advice ( DYOR )
ATOM is About to Start an Explosive Uptrend | ATOM/USDT Analysis💎ATOM/USDT is painting an optimistic landscape in the 1D Timeframe. A standout observation is its strategic positioning within a pivotal demand zone.
💎 There's a distinct OB and market imbalance around the $11 price point. Given the current dynamics, there's a strong inclination that ATOM might re-engage with this level soon.
💎 In the recent past, we've witnessed a transformation where demand has transitioned into supply, with ATOM carving out Equal Lows.
💎 While the overarching sentiment and indicators lean towards a positive trajectory for ATOM, the broader market's volatility remains a wildcard. It's essential to factor in this unpredictability as it could sway the outcome.
💎 Stay vigilant, and always look for real-time market shifts. The world of crypto is ever-evolving, and staying informed is the key to navigating it successfully.

ATOM/USDTHi,nice price action on Atom.....we are still seating on our hands to hunt it .....
my zone is clear as crystal on chart.....
guys please comment and boost my posts...
Good luck
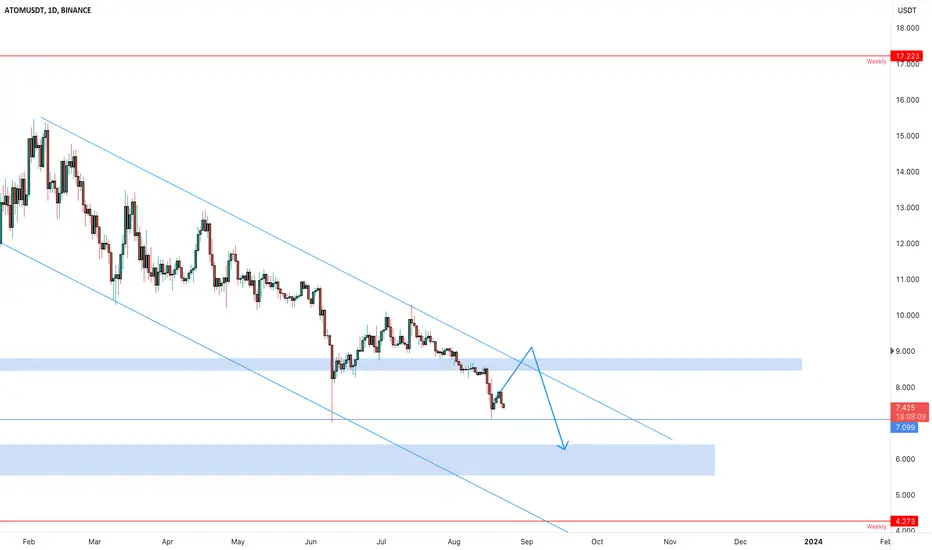
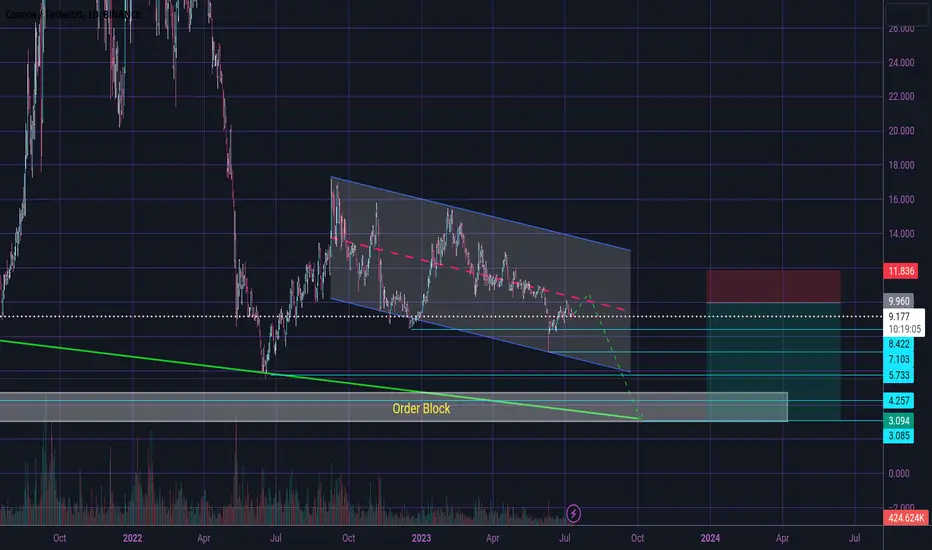
ATOUSDT wants 6$?Descending Channel Formation: The current market situation involves ATOMUSDT forming a descending channel pattern on the daily timeframe. A descending channel consists of two parallel trendlines, one functioning as resistance and the other as support. This pattern suggests a potential continuation of the ongoing downtrend.
Key Level Loss: The analysis indicates that the price of ATOMUSDT has moved below a significant level around the $9 area. These levels are noteworthy due to their historical influence on price movements.
Retest and Potential Resistance at $9: There exists the possibility of a retest of the $9 area, which was previously breached. In technical analysis, former support levels can assume the role of new resistance levels after they are crossed.
Retest of Old $6 Area: The analysis also suggests the potential for a revisit to the previous $6 area. This scenario could entail a further downward movement in the price.
Plancton's Rules Application: Following Plancton's Rules and aligned with the analysis, a consideration of a new short position is in place. A short position entails selling the asset with the expectation of a decline in its value.
–––––
Follow the Shrimp 🦐
Keep in mind.
🟣 Purple structure -> Monthly structure.
🔴 Red structure -> Weekly structure.
🔵 Blue structure -> Daily structure.
🟡 Yellow structure -> 4h structure.
⚫️ Black structure -> <= 1h structure.
Follow the Shrimp 🦐
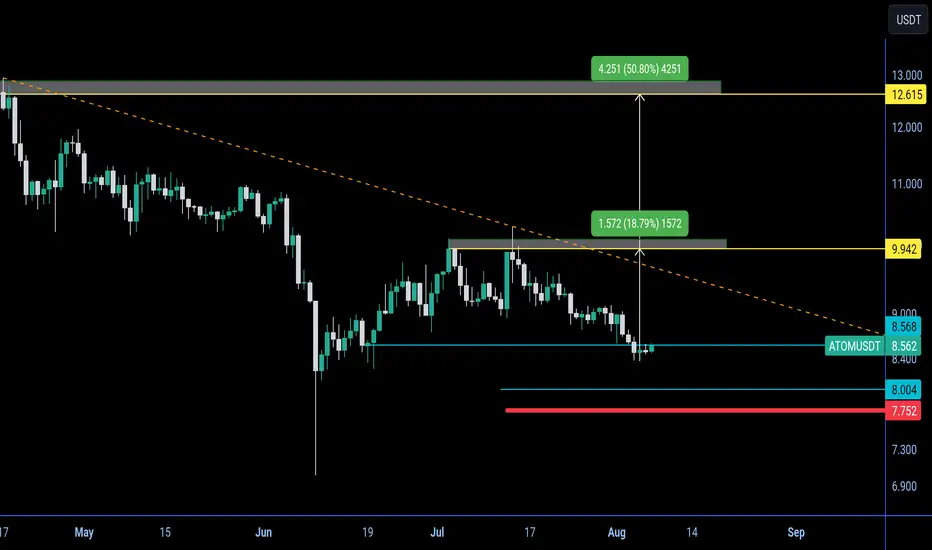
ATOM ready to pump 50% above 🆓🚦📌 #dyor
Position size :: 1%
Leverage :: cross 🤞 2-5x
NASDAQ:ATOM -USDT 📌
#futuretrade :: BUY-LONG ↗️
#BUY :: $8.06 - $8.56
🎯
:: $9.9
:: $12.6
Stop 🛑 lose #SL :: $7.56
📌 always move stop lose #sl when target get reached 📌
#risk :: medium #scalping
Strong rejection at high liquid 💰 area ready to fly 🕊️💸
ATOM Looks Bullish!!Long Entry Trigger
Cosmos Has found support above a pivot low and has also swept those lows.
Buying pressure seems to have come in and it's now consolidating above support.
The most probable outcome is that the price moves a little higher from here.
--------------------------------------------------------------------------------------------------
Every day the charts provide new information. You have to adjust or get REKT.
Love it or hate it, hit that thumbs up and share your thoughts below!
Don't trade with what you're not willing to lose. Calculate Your Risk/Reward!
This is not financial advice. This is for educational purposes only.
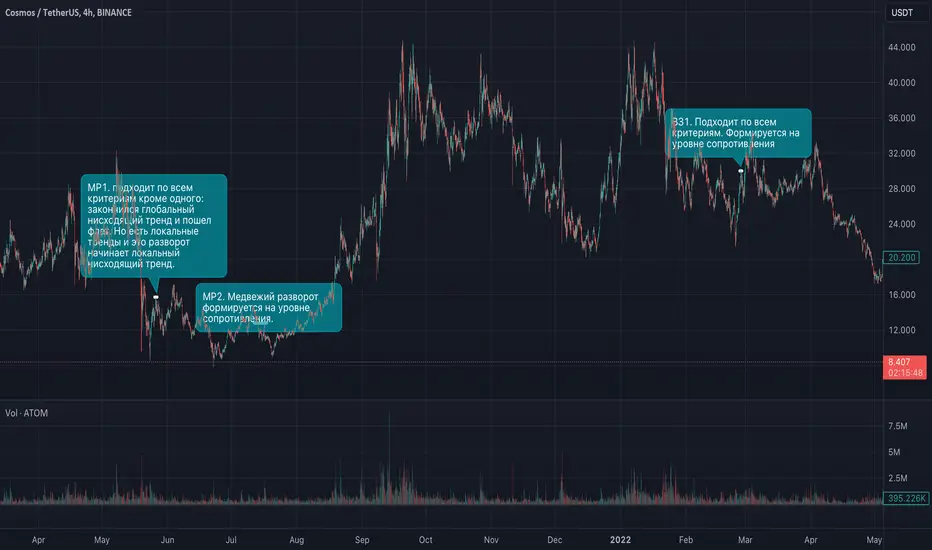
Homework_manvelov_rev_patterns_2Homework_manvelov_rev_patterns_2
This is addition to homework n2 where some additional missing patterns are added
Addition N2
ATOM/USDTHi , look at this awesome retrace from my level ...... enjoy my scalp signal share them with your friends to take this beauty profits off the table ......
now if you entered in this position with 5---or 10 leverage you can close that i specified for you the support by line .......
comment below and boost my posts please ......
Good luck ......
ATOM/USDT looking bullish? 👀 🚀Cosmos Today AnalysisParadisers, turn your attention to Atom! It's poised for a bullish ascent, currently residing in a demand zone and having recently addressed the OB level👀
💎 A notable shift from demand to supply has been observed, propelling the price on a downward trajectory, leaving behind a clear imbalance and a bearish OB. Given the liquidity, it's anticipated that the price will revisit this level soon.
💎 Additionally, Atom is on the brink of crossing over the EMA 55. Should it sustain its momentum above this EMA, we could witness a substantial bullish surge.
💎 In the dynamic world of crypto, staying informed and adaptable is key. Stay tuned for more updates and enjoy your trading journey

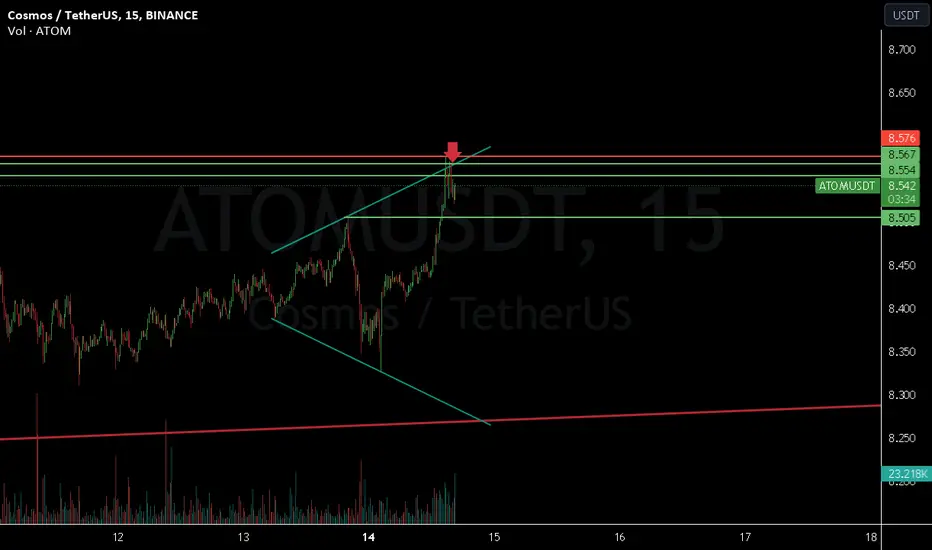
ATOM/USDTIN SCALP TIME ;
you can enter your tiny short around 8.55.....that is scalp fast entery fast exit...
Good luck
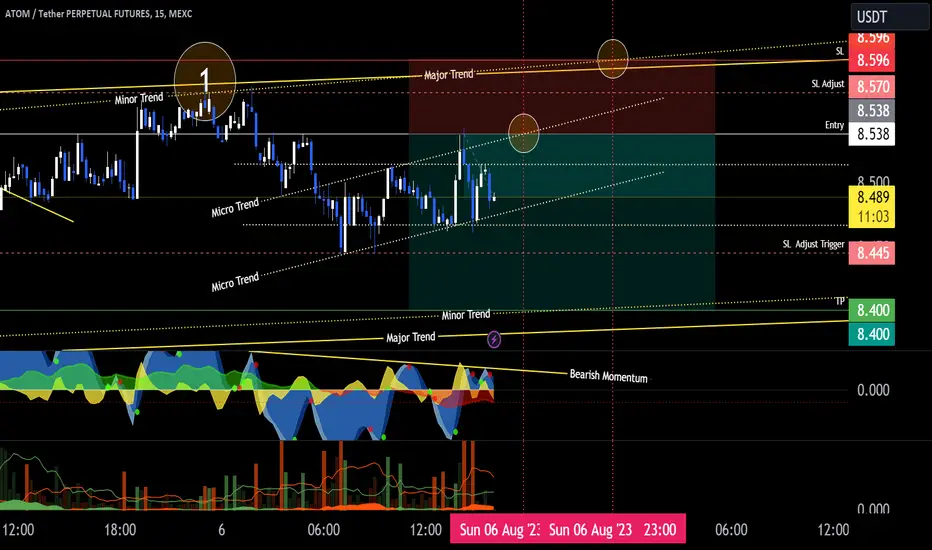
ATOMUSDT Trend Reversal ? At this point the whole picture is not clear and it all depends to the king then we can decide on the alt market .
But as far as the H1 chart on Crocobot says it's the perfect time to hump on a long trade . Trade WL ratio is too good to be true but hey sometimes we are at the right place in the write time ha ?
ATOMUSDTThe price can grow from the specified range. Do not enter without the trigger
It is only a prediction and possibility and should not be based on anyone's decision...
ATOM is at the MAJOR SUPPORTATOM is at the monthly support rn. We can see strong bounce in middle term.
ATOM - Only pointing down
The analysis is pretty straightforward:
- Gray trendline was broken, but there was no follow-through and it is currently support.
- Green trendline holding price to the downside
- No RSI divergence
Therefore, the higher probability points to another lower low, targeting $7.
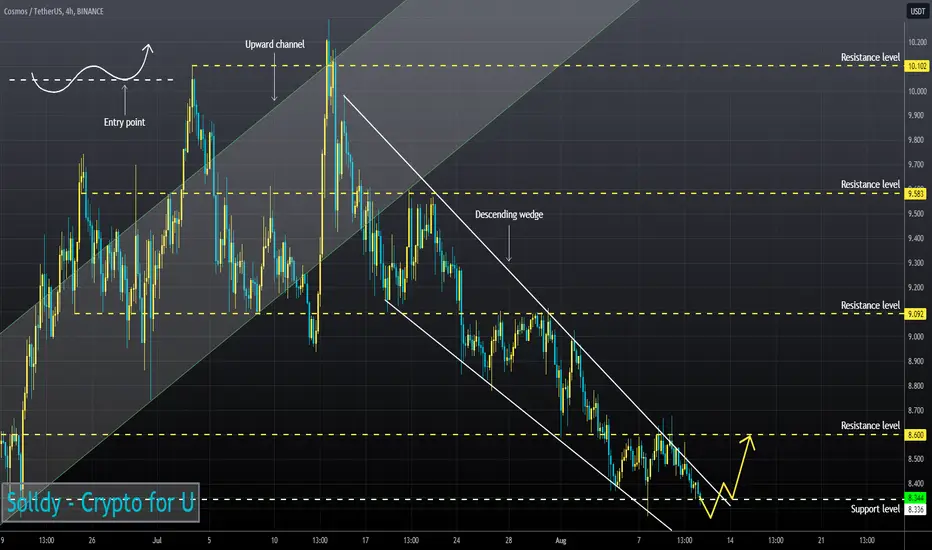
ATOMUSD ❕ descending wedgeTD Sequential formed a reversal signal up (4H TF)
Price and RSI chart formed a convergence (30m TF)
I believe the asset will rebound if it holds the current support.
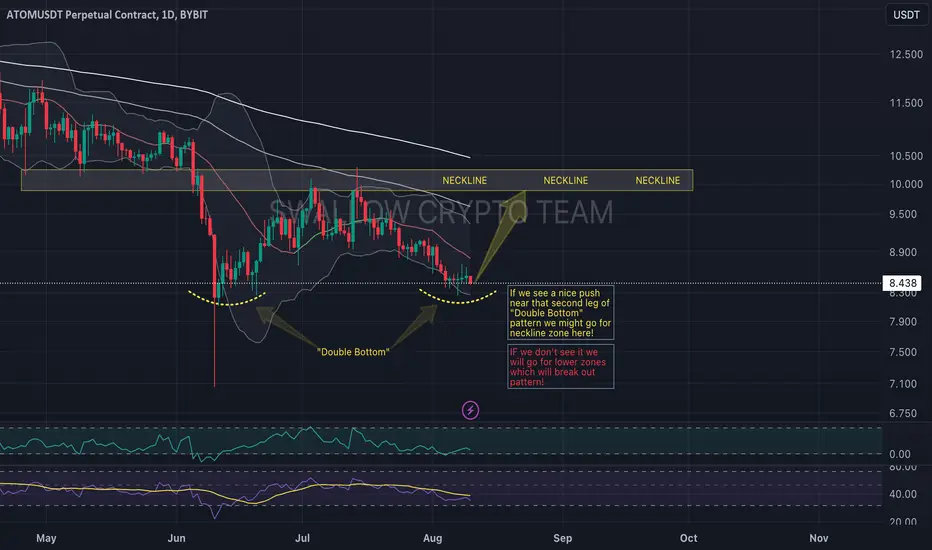
ATOM/USDT nice potential for bullish movement! Hey traders 👋
ATOM coin is next on our watchlist. Well we won't keep it long here as everything is displayed on the chart!
Good chance for a "double bottom" pattern to form here - but we need a bullish momentum near second leg in order for this pattern to work! Waiting....
If you like ideas provided by our team you can show us your support by liking and commenting.
Yours Sincerely,
Swallow Team
Disclamer:
We are not financial advisors. The content that we share on this website are for educational purposes and are our own personal opinions.
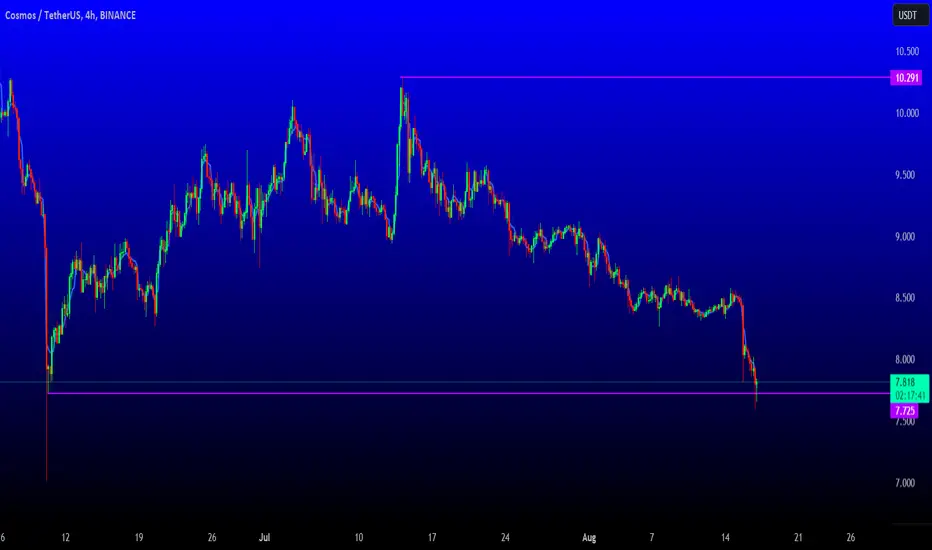
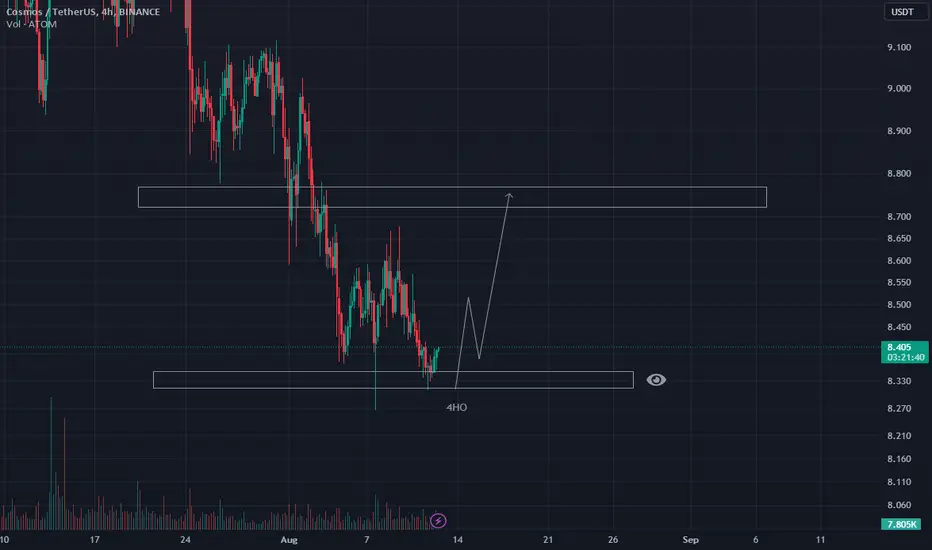
#ATOM/USDT breaking the Falling Wedge Pattern in 4-Hour TF!Wait for PDH $8.6 BO to open a Long. The support level is PWL $8.360.