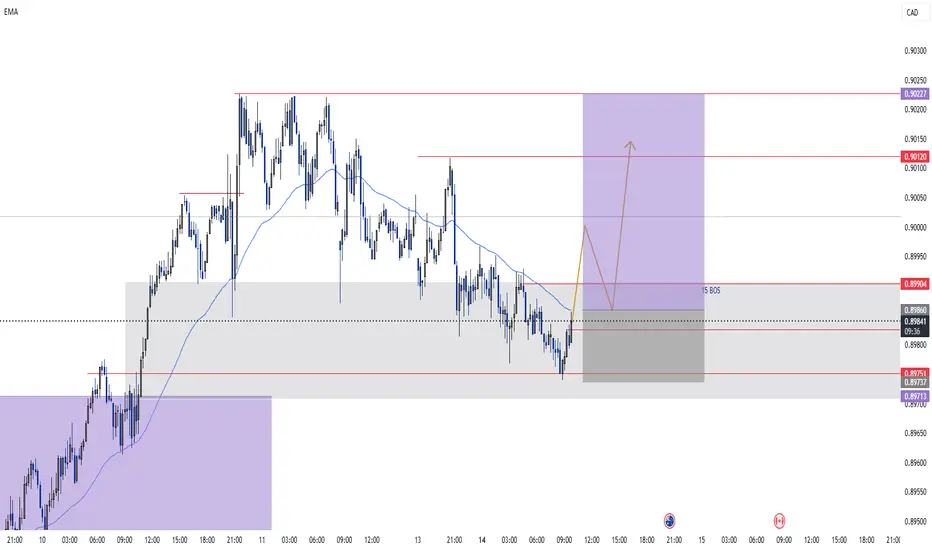
AUDCAD I Daily CLS I Model 2 I HTF DOL TargetYo Market Warriors ⚔️
Fresh Crypto Analysis— if you’ve been riding with me, you already know:
🎯My system is 100% mechanical. No emotions. No trend lines. No subjective guessing. Working all timeframes. Just precision, structure, and sniper entries.
🧠 What’s CLS?
It’s the real smart money. The invisible hand behind $7T/day — banks, algos, central players.
📍Model 1:
HTF bias based on the daily and weekly candles closes,
Wait for CLS candle to be created and manipulated. Switch to correct LTF and spot CIOD. Enter and target 50% of the CLS candle.
For high probability include Dealing Ranges, Weekly Profiles and CLS Timing.
Analysis done on the Tradenation Charts
Disclosure: I am part of Trade Nation's Influencer program and receive a monthly fee for using their TradingView charts in my analysis.
Trading is like a sport. If you consistently practice you can learn it.
“Adapt what is useful. Reject whats useless and add whats is specifically yours.”
David Perk aka Dave FX Hunter
💬 Comment any Coin I ll give you my quick view
AUDCAD trade ideas

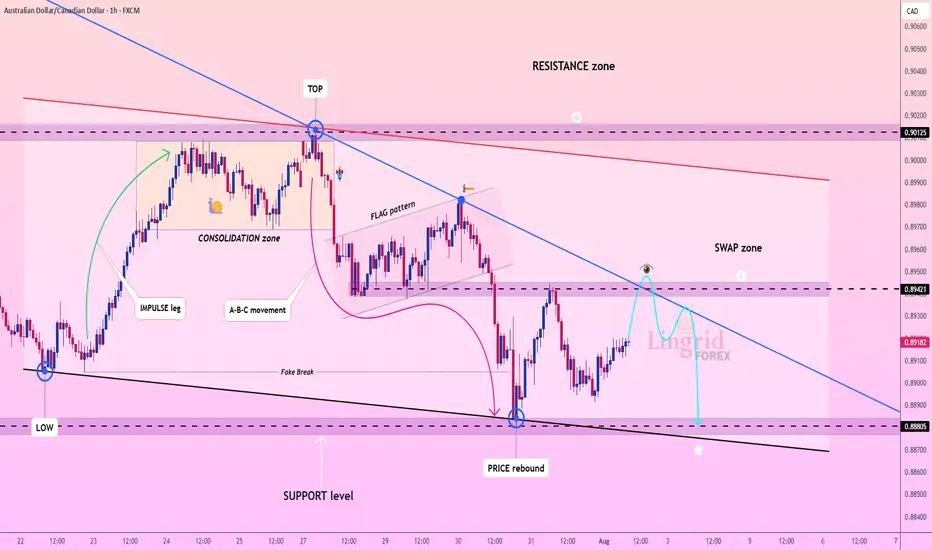
Lingrid | AUDCAD Swap Zone. Potential Selling OpportunityThe price perfectly fulfilled my last idea . FX:AUDCAD is rebounding from a strong support area after a fake break below 0.88805 and is now moving toward the descending trendline. The price is expected to test the swap zone near 0.89421, where prior support may flip to resistance. This setup favors a SELL scenario from the lower high structure within the flag and downtrend. A rejection from the trendline could resume the bearish continuation back toward support.
📌 Key Levels
Sell zone: 0.89421 – 0.89500
Buy zone: 0.88805 – 0.88600
Target: 0.88805
Invalidation: Break and close above 0.89550
💡 Risks
Bullish breakout through the descending trendline
Sharp reversal from macroeconomic news
Short-term consolidation above 0.89100 weakening momentum
If this idea resonates with you or you have your own opinion, traders, hit the comments. I’m excited to read your thoughts!
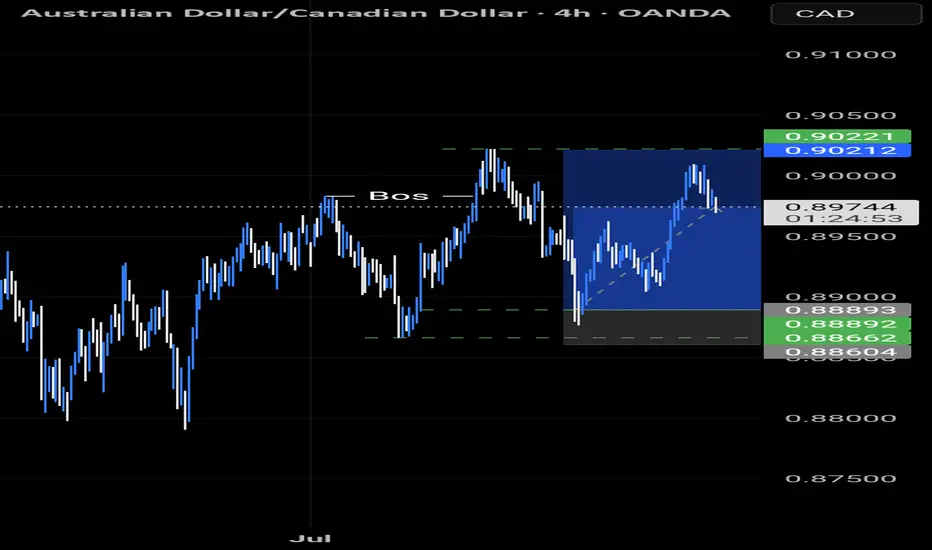
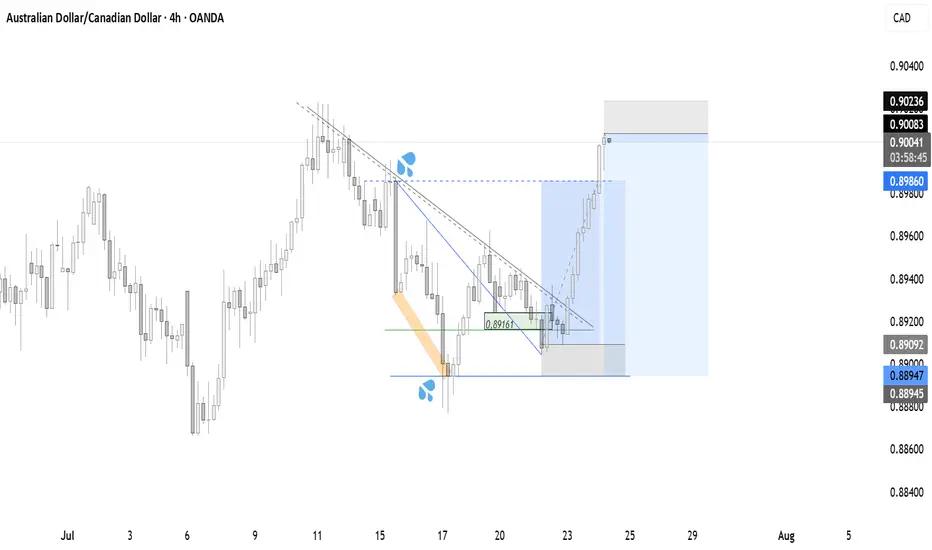
AUDCAD4HR:
The price broke down from a double parallel channel, forming a lower low, which confirms a bearish bias. It then pulled back to retest the broken channel and resistance, where a long-wick candle rejection occurred.
This rejection also aligned with multiple previous Points of Control (POC), adding confluence.
Afterward, a shift from bullish to bearish was confirmed on the 15-minute timeframe.
A clean 1:2 risk-reward trade setup followed.
AUDCAD TRADE IDEA AUDCAD has given us a pullback to our Fibonacci level and has flown to the moon...
Let's see if the market does it's thing and gets to our desired target
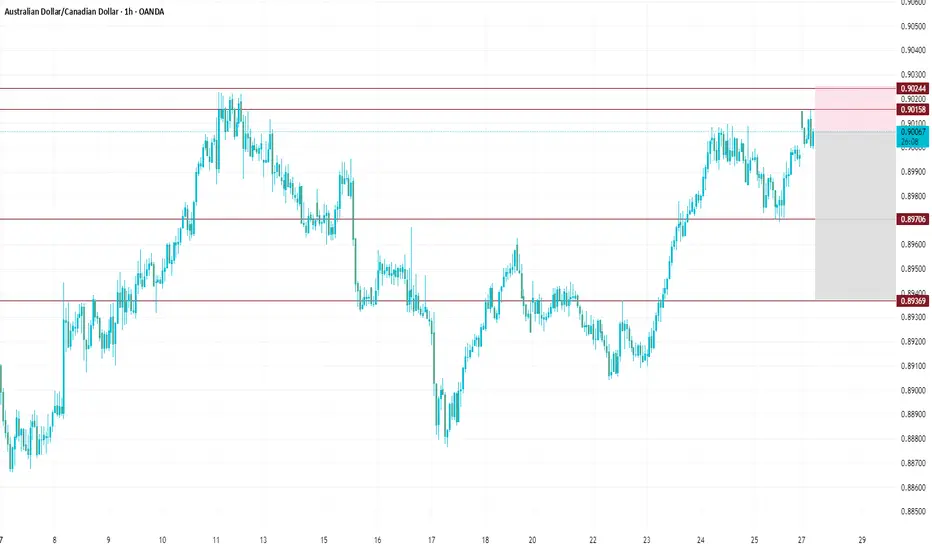
audcadAUD/CAD Trade Signal – Strategic Short Opportunity Identified
A compelling short-selling opportunity has materialized on the AUD/CAD currency pair, presenting traders with a potential low-risk, high-reward setup. The pair is currently trading near a key resistance level, showing signs of bearish exhaustion and potential reversal. Market participants are encouraged to consider initiating a short position around the entry price of 0.89929, where the pair appears overextended and vulnerable to downside pressure.
Trade Execution Parameters:
Entry Point: 0.89929 – This level is aligned with short-term resistance and represents a favorable risk-to-reward entry for sellers.
Take-Profit Objectives:
🎯 Target 1: 0.89888 – Initial support level, ideal for partial profit-taking.
🎯 Target 2: 0.89880 – Deeper retracement, suggesting increased bearish momentum.
🎯 Target 3: 0.89875 – Final target, near the lower boundary of current intraday range.
Stop Loss: 0.89980 – Placed slightly above the resistance area to contain losses in case of an unexpected breakout to the upside.
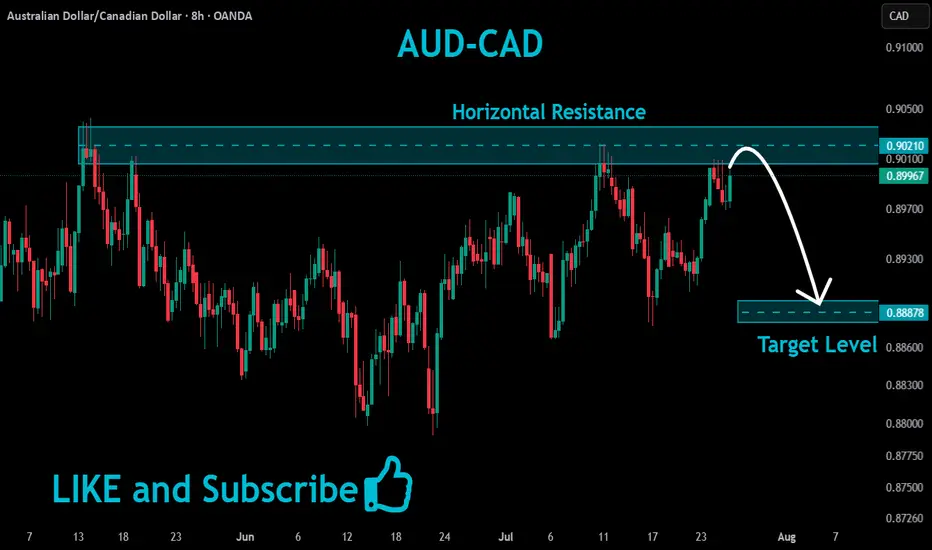
AUDCAD Resistance Ahead!
HI,Traders !
#AUDCAD is trading in an
Uptrend but the pair is locally
Overbought so after the pair
Hits the horizontal resistance
Level of 0.90210 we will be
Expecting a local bearish
Move down !
Comment and subscribe to help us grow !
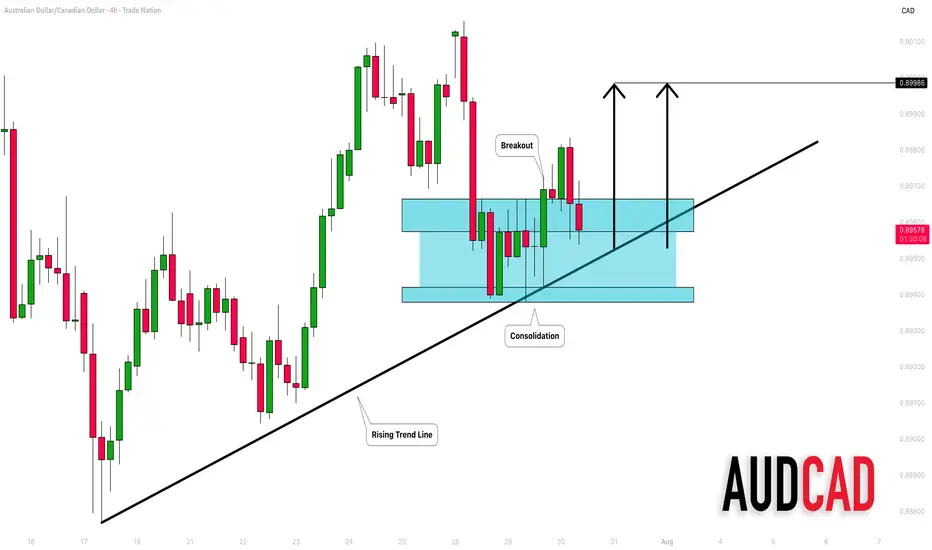
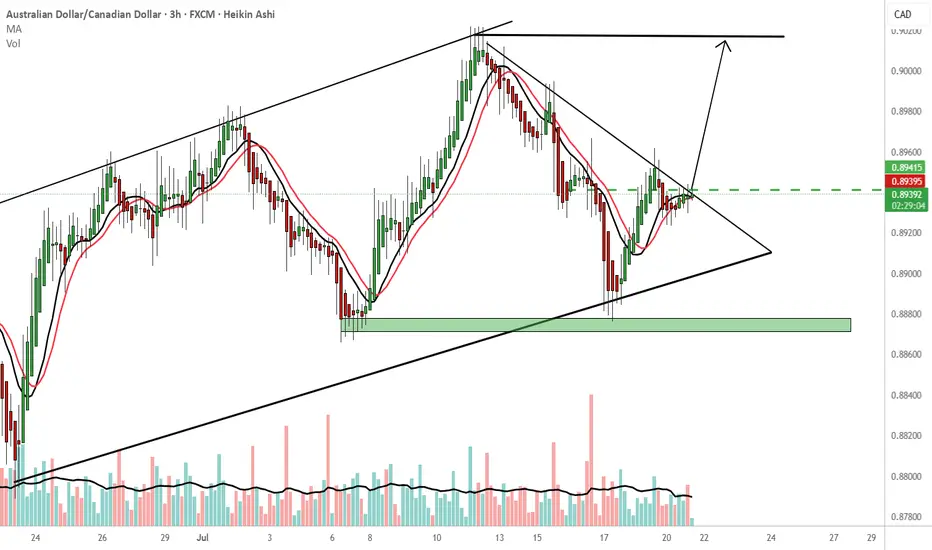
AUDCAD: Bullish Move From Trend Line 🇦🇺🇨🇦
AUDCAD may bounce from a solid rising trend line on a 4H.
The price started to consolidate on that after its test.
A breakout of a minor horizontal resistance is a strong bullish confirmation.
Goal - 0.8999
❤️Please, support my work with like, thank you!❤️
I am part of Trade Nation's Influencer program and receive a monthly fee for using their TradingView charts in my analysis.
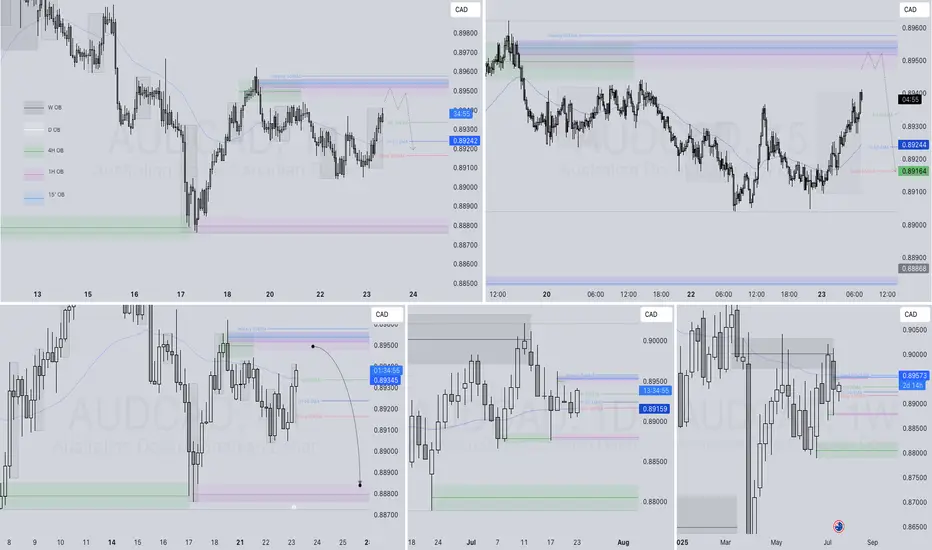
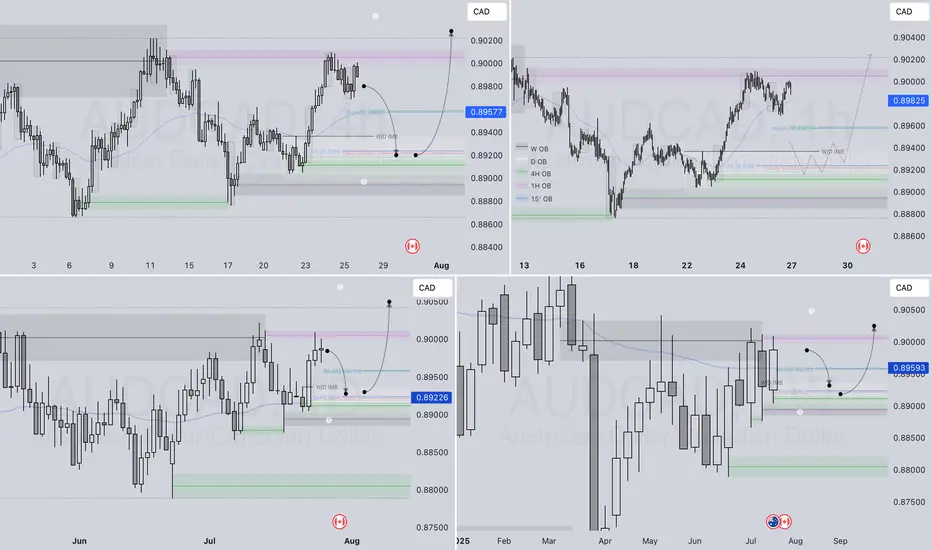
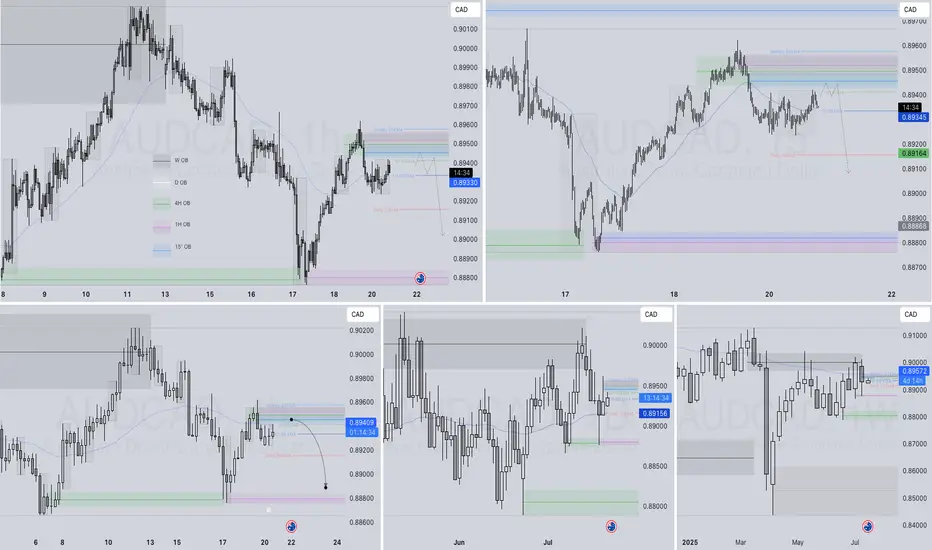
AUDCAD – WEEKLY FORECAST Q3 | W31 | Y25📊 AUDCAD – WEEKLY FORECAST
Q3 | W30 | Y25
Weekly Forecast 🔍📅
Here’s a short diagnosis of the current chart setup 🧠📈
Higher time frame order blocks have been identified — these are our patient points of interest 🎯🧭.
It’s crucial to wait for a confirmed break of structure 🧱✅ before forming a directional bias.
This keeps us disciplined and aligned with what price action is truly telling us.
📈 Risk Management Protocols
🔑 Core principles:
Max 1% risk per trade
Only execute at pre-identified levels
Use alerts, not emotion
Stick to your RR plan — minimum 1:2
🧠 You’re not paid for how many trades you take, you’re paid for how well you manage risk.
🧠 Weekly FRGNT Insight
"Trade what the market gives, not what your ego wants."
Stay mechanical. Stay focused. Let the probabilities work.
FX:AUDCAD
AUDCAD SHORT Market structure bearish on HTFs 3
Entry at both Daily and Weekly AOi
Weekly Rejection at AOi
Previous Weekly Structure Point
Daily Rejection at AOi
Previous Structure point Daily
Around Psych Level 0.90000
H4 EMA retest
H4 Candlestick rejection
Rejection from Previous structure
Levels 4.51
Entry 120%
REMEMBER : Trading is a Game Of Probability
: Manage Your Risk
: Be Patient
: Every Moment Is Unique
: Rinse, Wash, Repeat!
: Christ is King.
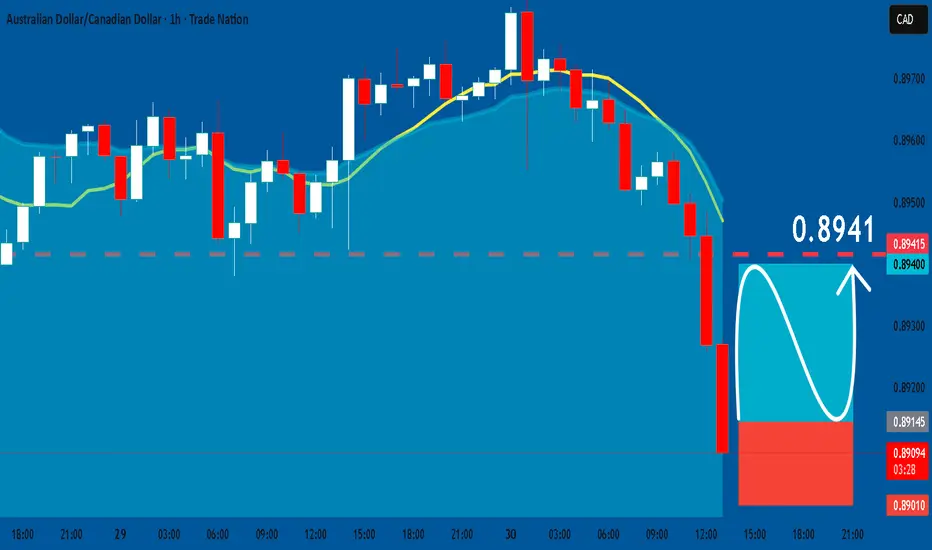
AUDCAD: Long Trade Explained
AUDCAD
- Classic bullish formation
- Our team expects pullback
SUGGESTED TRADE:
Swing Trade
Long AUDCAD
Entry - 0.8914
Sl - 0.8901
Tp - 0.8941
Our Risk - 1%
Start protection of your profits from lower levels
Disclosure: I am part of Trade Nation's Influencer program and receive a monthly fee for using their TradingView charts in my analysis.
❤️ Please, support our work with like & comment! ❤️
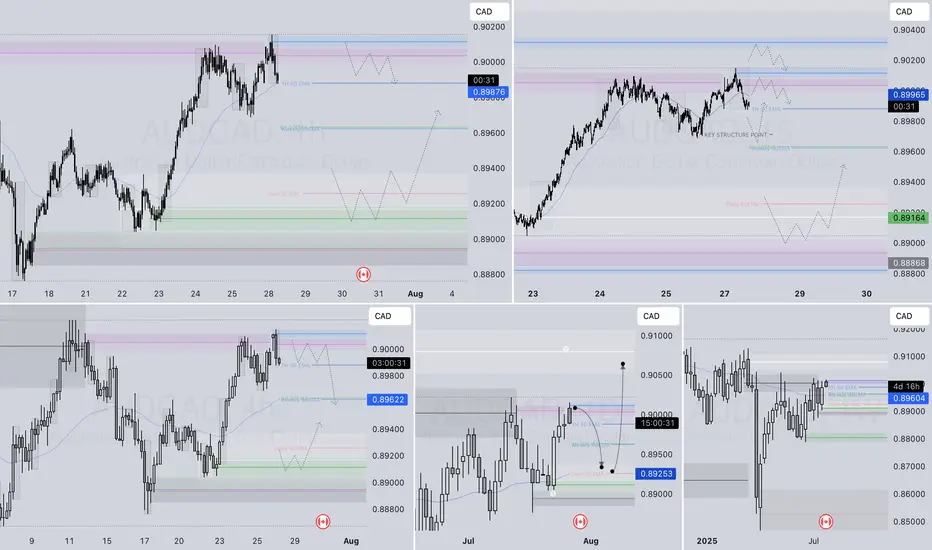
AUDCAD – DAILY FORECAST Q3 | W31 | D30 | Y25
📊 AUDCAD – DAILY FORECAST
Q3 | W31 | D30 | Y25
Daily Forecast 🔍📅
Here’s a short diagnosis of the current chart setup 🧠📈
Higher time frame order blocks have been identified — these are our patient points of interest 🎯🧭.
It’s crucial to wait for a confirmed break of structure 🧱✅ before forming a directional bias.
This keeps us disciplined and aligned with what price action is truly telling us.
📈 Risk Management Protocols
🔑 Core principles:
Max 1% risk per trade
Only execute at pre-identified levels
Use alerts, not emotion
Stick to your RR plan — minimum 1:2
🧠 You’re not paid for how many trades you take, you’re paid for how well you manage risk.
🧠 Weekly FRGNT Insight
"Trade what the market gives, not what your ego wants."
Stay mechanical. Stay focused. Let the probabilities work.
FX:AUDCAD

AUDCAD; Heikin Ashi Trade IdeaIn this video, I’ll be sharing my analysis of AUDCAD, using FXAN's proprietary algo indicators with my unique Heikin Ashi strategy. I’ll walk you through the reasoning behind my trade setup and highlight key areas where I’m anticipating potential opportunities.
I’m always happy to receive any feedback.
Like, share and comment! ❤️
Thank you for watching my videos! 🙏

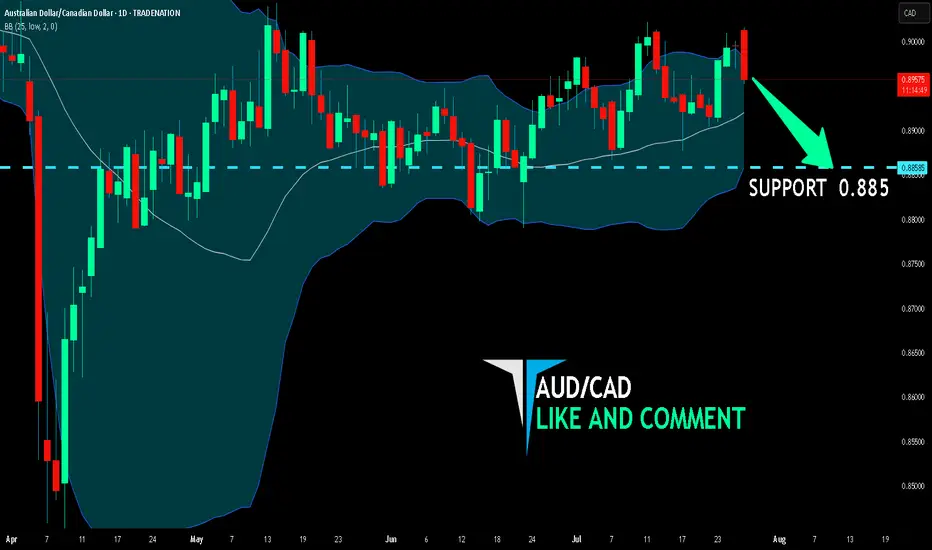
AUD/CAD SELLERS WILL DOMINATE THE MARKET|SHORT
Hello, Friends!
We are now examining the AUD/CAD pair and we can see that the pair is going up locally while also being in a uptrend on the 1W TF. But there is also a powerful signal from the BB upper band being nearby, indicating that the pair is overbought so we can go short from the resistance line above and a target at 0.885 level.
Disclosure: I am part of Trade Nation's Influencer program and receive a monthly fee for using their TradingView charts in my analysis.
✅LIKE AND COMMENT MY IDEAS✅
AUDCAD – DAILY FORECAST Q3 | W31 | D28 | Y25📊 AUDCAD – DAILY FORECAST
Q3 | W31 | D28 | Y25
Daily Forecast 🔍📅
Here’s a short diagnosis of the current chart setup 🧠📈
Higher time frame order blocks have been identified — these are our patient points of interest 🎯🧭.
It’s crucial to wait for a confirmed break of structure 🧱✅ before forming a directional bias.
This keeps us disciplined and aligned with what price action is truly telling us.
📈 Risk Management Protocols
🔑 Core principles:
Max 1% risk per trade
Only execute at pre-identified levels
Use alerts, not emotion
Stick to your RR plan — minimum 1:2
🧠 You’re not paid for how many trades you take, you’re paid for how well you manage risk.
🧠 Weekly FRGNT Insight
"Trade what the market gives, not what your ego wants."
Stay mechanical. Stay focused. Let the probabilities work.
FX:AUDCAD
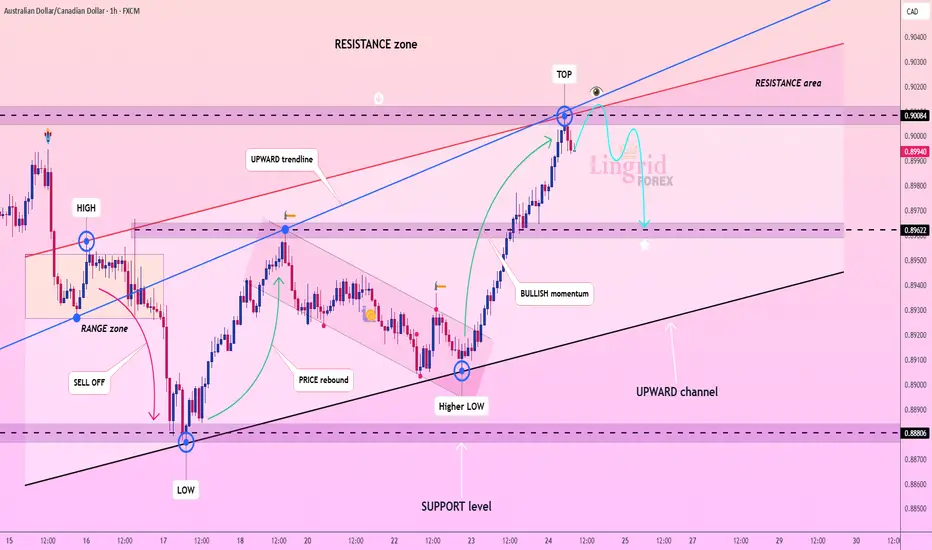
Lingrid | AUDCAD Short Following Resistance Fake Breakout The price perfectly fulfilled my last idea . FX:AUDCAD is rejecting from the top of the resistance zone after a strong bullish impulse and has started forming a rounded top pattern. Price remains inside an upward channel but is showing signs of exhaustion with the blue arrow projecting a pullback. As long as the price stays below 0.9008, we expect a descent toward the 0.8962 region. Momentum is cooling, and a bearish correction is likely before any bullish attempt resumes.
📉 Key Levels
Sell trigger: Break below 0.8990
Sell zone: 0.8995 – 0.9012
Target: 0.8962
Invalidation: Break and close above 0.9025
💡 Risks
Strong bullish momentum may resume if support holds
Failure to break 0.8990 could trap early sellers
Macro data from AUD/CAD region may disrupt the structure
If this idea resonates with you or you have your own opinion, traders, hit the comments. I’m excited to read your thoughts!
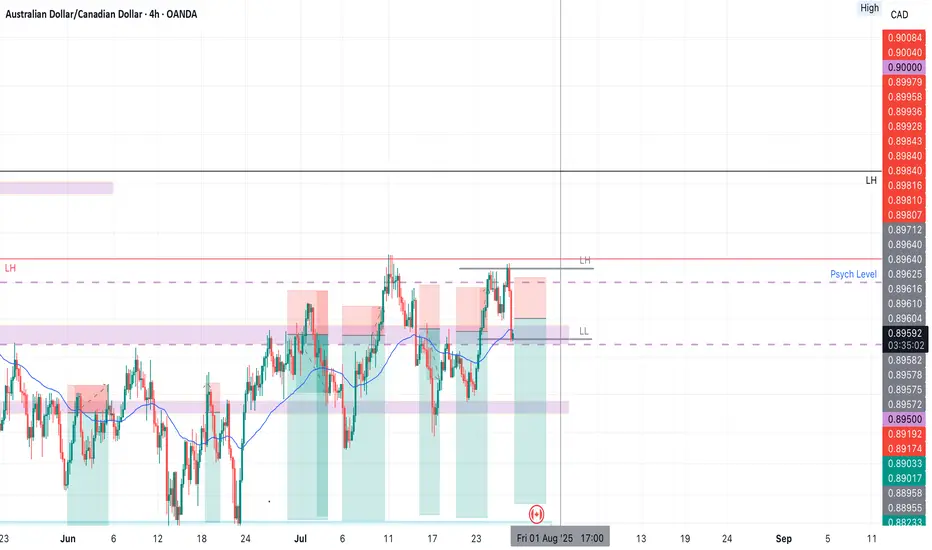
AUDCAD SHORTMarket structure bearish on HTFs DW
Entry at both Weekly and Daily AOi
Weekly Rejection at AOi
Weekly Previous Structure Point
Weekly Rejection at AOi
Daily Rejection at AOi
Daily Previous Structure Point
Around Psychological Level 0.89500
H4 EMA retest
H4 Candlestick rejection
Levels 4.17
Entry 100%
REMEMBER : Trading is a Game Of Probability
: Manage Your Risk
: Be Patient
: Every Moment Is Unique
: Rinse, Wash, Repeat!
: Christ is King.

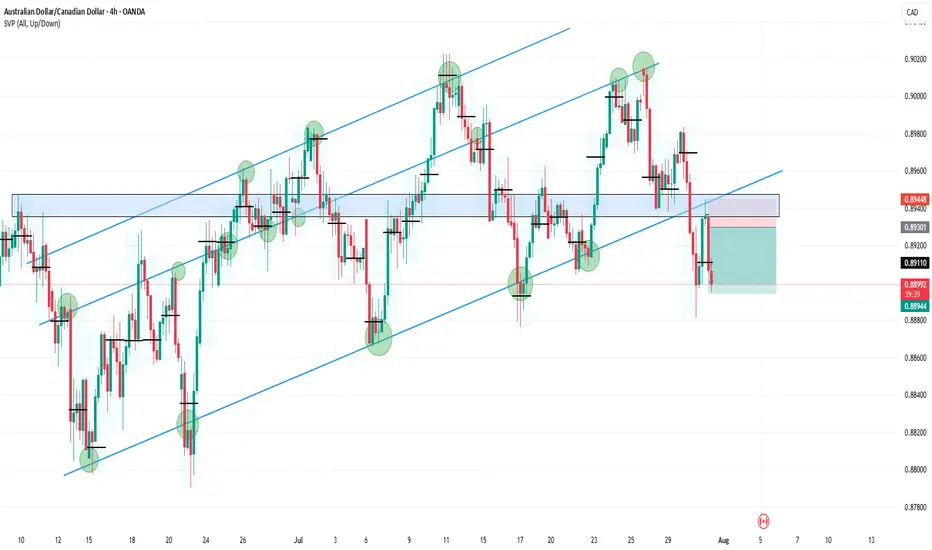
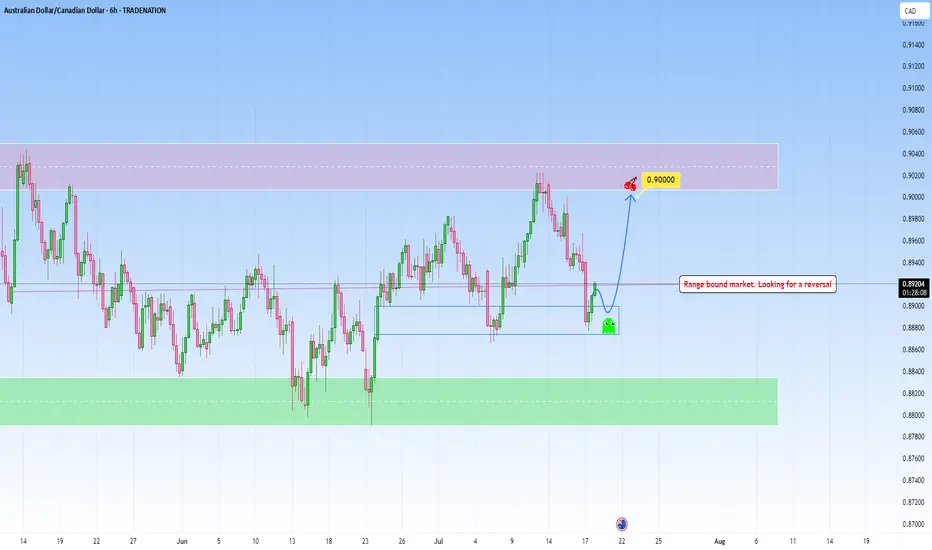
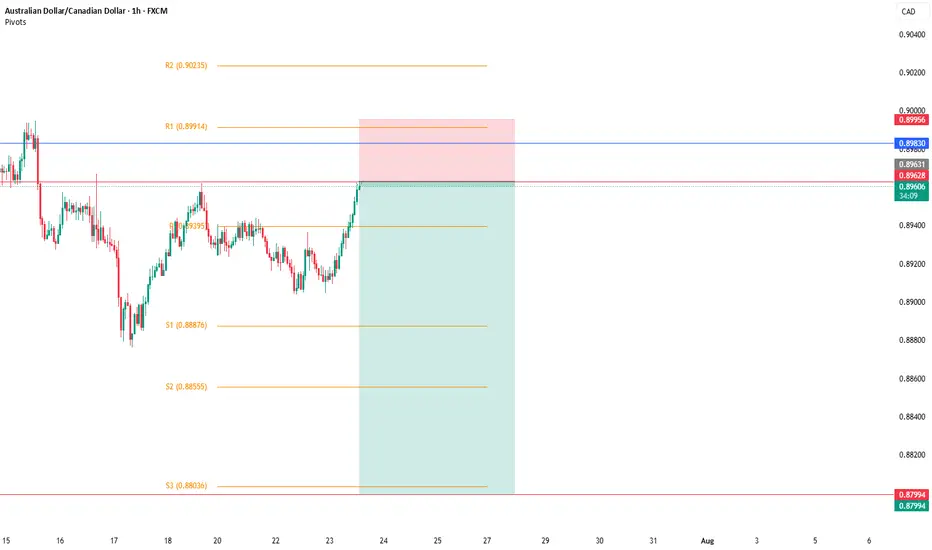
AUDCAD: Respecting Structure, Repeating OpportunityWhat we’re looking at here is a beautifully balanced range market, the kind I love trading, because it speaks so clearly when you take a moment to listen. Price is respecting both sides of this range clearly. The lows are being protected and respected multiple times before.
We’ve already tapped into that lower bound, and the reaction has been good, together with liquidity collecting. And when price finds its feet in these kinds of zones, I immediately think of what the range is offering, right now, with risk clearly defined and reward just sitting at the other edge, waiting.
If price gives us one more small retest, I’m watching for confirmation: not just in candlestick structure, but also in volume behavior. I have my eyes set straight on that upper resistance zone near 0.90000.
And from there unless there’s a news catalyst or volume breakout, that’s where the move likely might exhaust… and that’s where I’m out, before the reversal can bite.
If the structure shifts, I’ll shift too. But until then, this is a perfect range.
Just sharing my thoughts for the charts, this isn’t financial advice. Always confirm your setups and manage your risk properly.
Disclosure: I am part of Trade Nation's Influencer program and receive a monthly fee for using their TradingView charts in my analysis.
AUDCAD BULLS Looking for buys, consider the following confirmation.
-Inverse Head and Shoulder formation, you can consider buys above the green broken line, you could wait for a retest @ 0.89420 before liftoff.
-Consider 0.90200 as the first TP
-TP 2: 0.91200
Sell AUDCADWe can expect an immediate reversal from AUDCAD. After reaching the target, price has climbed a bit higher to complete the structure. Price will reverse from here.
AUDCAD Wk Top Down Bullish Price Action Analysis 1.The weekly price is reaching a premium zone, suggesting a potential reversal or reaction area.
2. Daily BOS + Tap into Daily imbalance FVG.
3. HR is still in a bullish sentiment
4. Waiting for 15 minutes for displacement or BOS
5. Tap into 15 minutes of FVG.
5: Pending price action...
AUDCAD Q3 | D21 | W30 | Y25 📊AUDCAD Q3 | D21 | W30 | Y25
Daily Forecast 🔍📅
Here’s a short diagnosis of the current chart setup 🧠📈
Higher time frame order blocks have been identified — these are our patient points of interest 🎯🧭.
It’s crucial to wait for a confirmed break of structure 🧱✅ before forming a directional bias.
This keeps us disciplined and aligned with what price action is truly telling us.
📈 Risk Management Protocols
🔑 Core principles:
Max 1% risk per trade
Only execute at pre-identified levels
Use alerts, not emotion
Stick to your RR plan — minimum 1:2
🧠 You’re not paid for how many trades you take, you’re paid for how well you manage risk.
🧠 Weekly FRGNT Insight
"Trade what the market gives, not what your ego wants."
Stay mechanical. Stay focused. Let the probabilities work.
FRGNT 📊
AUDCAD Q3 | D23 | W30 | Y25📊AUDCAD Q3 | D23 | W30 | Y25
Daily Forecast🔍📅
Here’s a short diagnosis of the current chart setup 🧠📈
Higher time frame order blocks have been identified — these are our patient points of interest 🎯🧭.
It’s crucial to wait for a confirmed break of structure 🧱✅ before forming a directional bias.
This keeps us disciplined and aligned with what price action is truly telling us.
📈 Risk Management Protocols
🔑 Core principles:
Max 1% risk per trade
Only execute at pre-identified levels
Use alerts, not emotion
Stick to your RR plan — minimum 1:2
🧠 You’re not paid for how many trades you take, you’re paid for how well you manage risk.
🧠 Weekly FRGNT Insight
"Trade what the market gives, not what your ego wants."
Stay mechanical. Stay focused. Let the probabilities work.
FRGNT