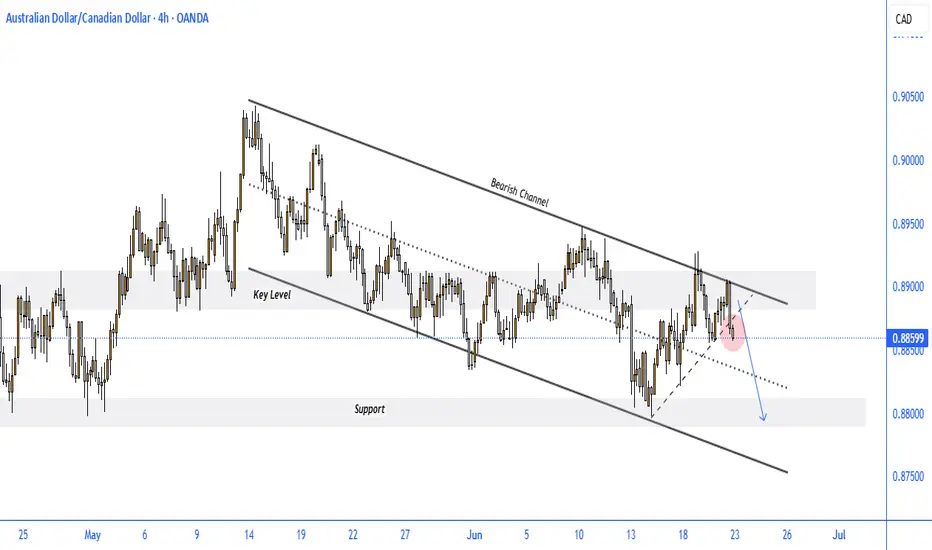
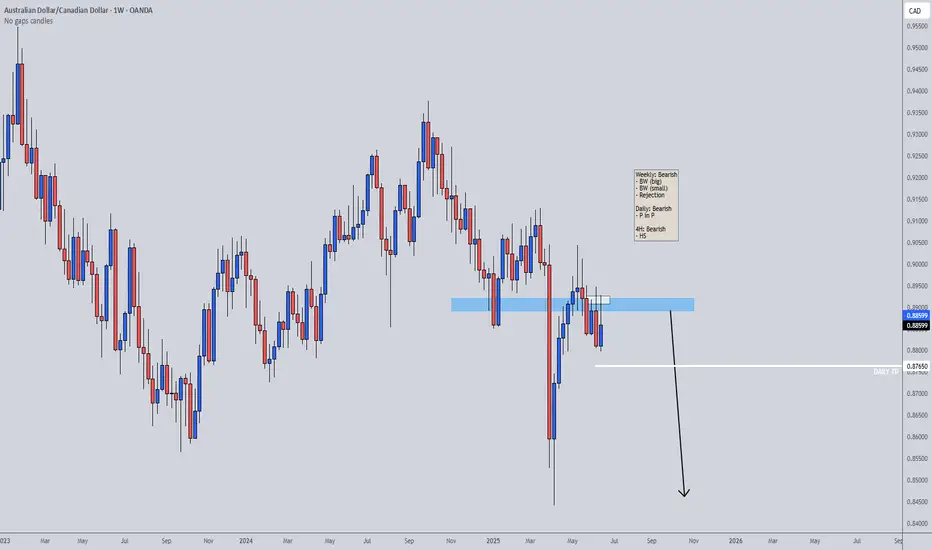
AUDCAD BEARISH SETUPThe 4-hour chart for AUD/CAD shows a well-respected bearish descending channel, where price action remains capped below a strong dynamic resistance. Price recently rejected a key resistance zone near 0.8900, signaling a potential continuation to the downside.
Key Observations:
Bearish Channel Intact: Price continues to respect the upper and lower bounds of the descending channel.
Key Resistance Rejection: The pair tested the 0.8900 resistance area and faced immediate rejection (highlighted in red), forming a lower high.
Break of Trendline: A rising trendline from the recent low has been broken, reinforcing bearish pressure.
Support Zone in Sight: If bearish momentum continues, the next major support lies around 0.8780 – 0.8800, offering a possible target area.
Short-term Setup: Minor upward retracement may retest the broken trendline, but unless 0.8900 is breached, the bias remains strongly bearish.
Conclusion:
AUD/CAD remains under bearish control within the descending channel. The recent rejection from the upper boundary and break of the rising trendline suggest a high-probability move toward the 0.8800 support zone. Traders should look for confirmation of lower highs or bearish engulfing patterns to position short.
AUDCAD trade ideas
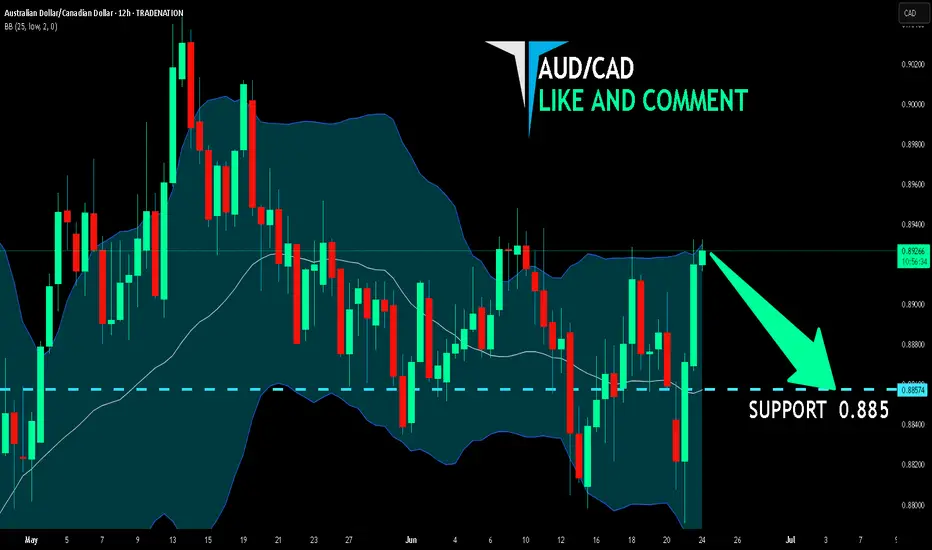
AUDCAD Will Move Lower! Short!
Please, check our technical outlook for AUDCAD.
Time Frame: 9h
Current Trend: Bearish
Sentiment: Overbought (based on 7-period RSI)
Forecast: Bearish
The price is testing a key resistance 0.885.
Taking into consideration the current market trend & overbought RSI, chances will be high to see a bearish movement to the downside at least to 0.879 level.
P.S
The term oversold refers to a condition where an asset has traded lower in price and has the potential for a price bounce.
Overbought refers to market scenarios where the instrument is traded considerably higher than its fair value. Overvaluation is caused by market sentiments when there is positive news.
Disclosure: I am part of Trade Nation's Influencer program and receive a monthly fee for using their TradingView charts in my analysis.
Like and subscribe and comment my ideas if you enjoy them!

AUD/CAD BEST PLACE TO SELL FROM|SHORT
Hello, Friends!
We are now examining the AUD/CAD pair and we can see that the pair is going up locally while also being in a uptrend on the 1W TF. But there is also a powerful signal from the BB upper band being nearby, indicating that the pair is overbought so we can go short from the resistance line above and a target at 0.885 level.
Disclosure: I am part of Trade Nation's Influencer program and receive a monthly fee for using their TradingView charts in my analysis.
✅LIKE AND COMMENT MY IDEAS✅
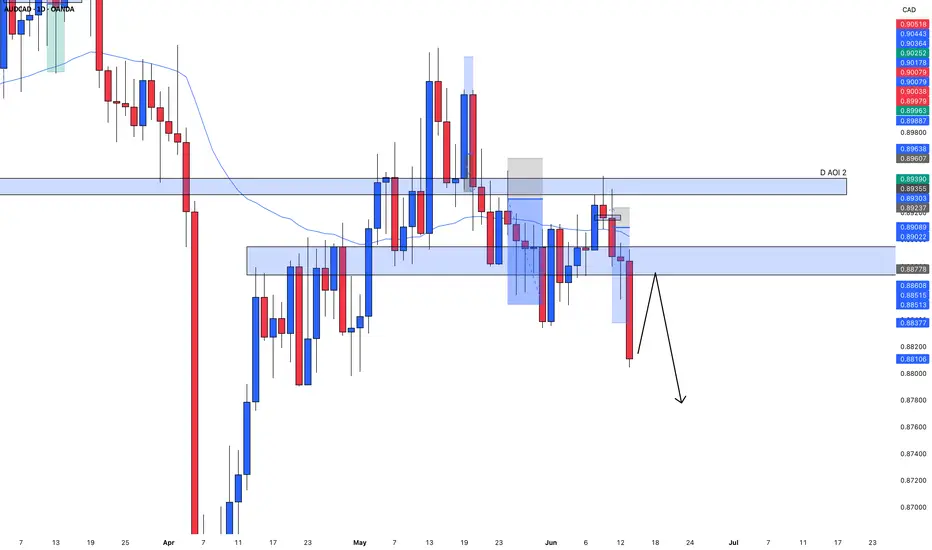
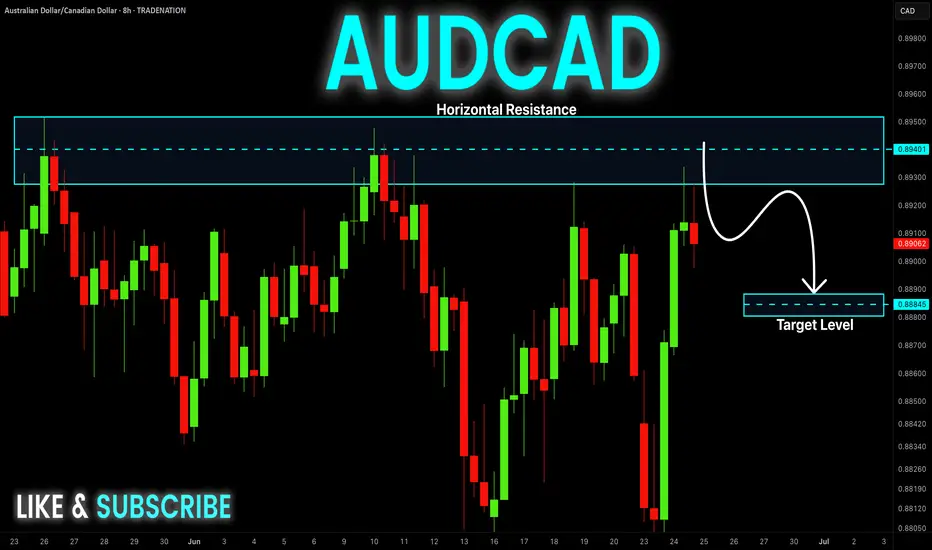
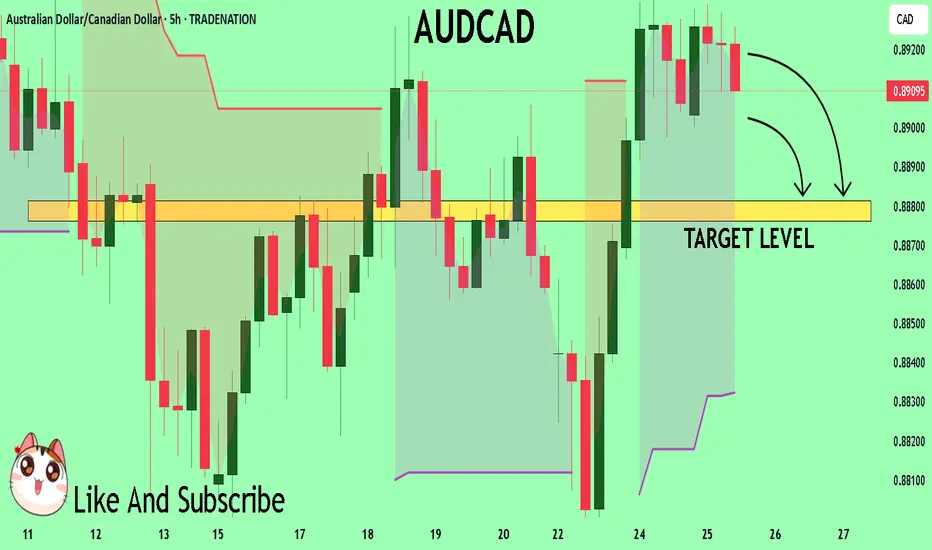
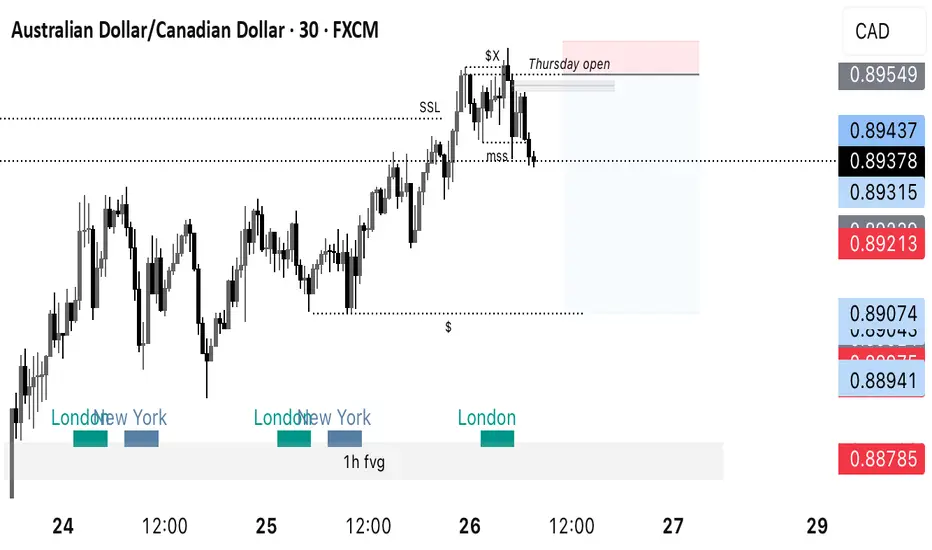
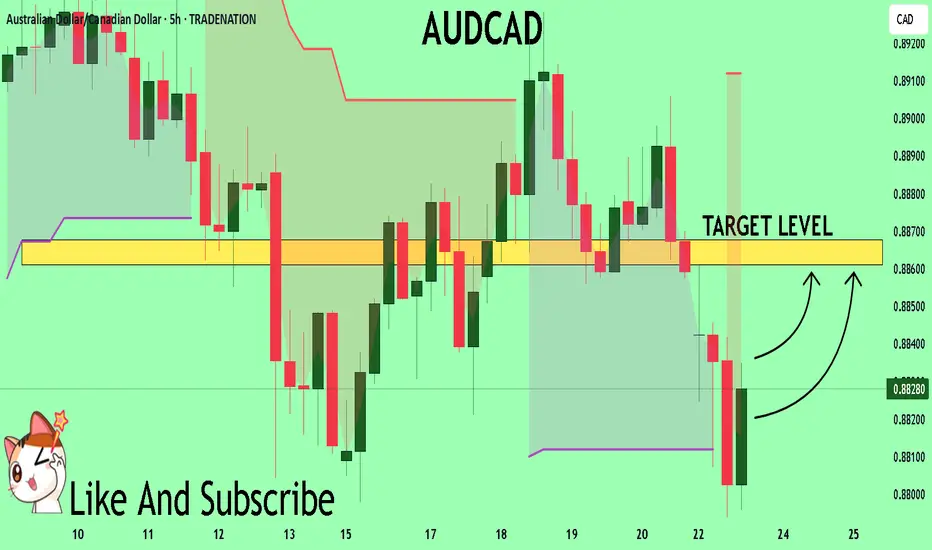
AUDCAD Slips Overnight, Aussie Jobs Fall Short of ExpectationsAUDCAD Slips Overnight, Aussie Jobs Fall Short of Expectations
AUDCAD encountered firm resistance near the 0.8930 zone, triggering a sharp overnight drop of nearly 50 pips. This move followed softer-than-expected Australian employment data for May, where total jobs unexpectedly declined by 2,500—well below the forecast of a 22,500 increase. Despite the miss, the unemployment rate held steady at 4.1%, unchanged for over a year.
Following this initial drop, the pair may enter a short consolidation phase before resuming its bearish trajectory, as technical patterns suggest continued downside pressure.
🎯 Key downside targets: 0.8845, 0.8825, and 0.8805
You may find more details in the chart!
Thank you and Good Luck!
❤️PS: Please support with a like or comment if you find this analysis useful for your trading day❤️
Disclosure: I am part of Trade Nation's Influencer program and receive a monthly fee for using their TradingView charts in my analysis.

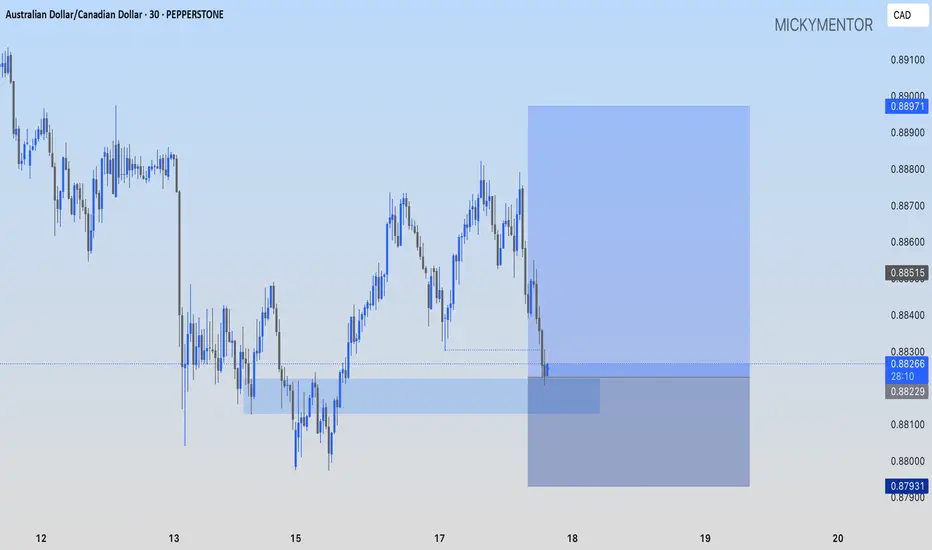
AUDCAD: A LONG TRADE OPPORTUNITY PEPPERSTONE:AUDCAD I'll be looking for buys from the 0.88486 price level.

AUDCAD: A GOOD BUY OPPORTUNITY PEPPERSTONE:AUDCAD I'm going long at current market price, targeting 0.88971
AUD-CAD Will Go Down! Sell!
Hello,Traders!
AUD-CAD made a retest
Of the wide horizontal
Resistance around 0.8934
And we are already seeing a
Local bearish reaction so
We will be expecting a
Further bearish move down
Sell!
Comment and subscribe to help us grow!
Check out other forecasts below too!
Disclosure: I am part of Trade Nation's Influencer program and receive a monthly fee for using their TradingView charts in my analysis.
Bullish momentum to extend?AUD/CAD has bounced off the support level which is a pullback support and could potentially rise from this level to our take profit.
Entry: 0.89033
Why we like it:
There is a pullback support level.
Stop loss: 0.8858
Why we like it:
There is a pullback support level.
Take profit: 0.9009
Why we like it:
There is a pullback resistance that is slightly below the 161.8% Fibonacci extension.
Enjoying your TradingView experience? Review us!
Please be advised that the information presented on TradingView is provided to Vantage (‘Vantage Global Limited’, ‘we’) by a third-party provider (‘Everest Fortune Group’). Please be reminded that you are solely responsible for the trading decisions on your account. There is a very high degree of risk involved in trading. Any information and/or content is intended entirely for research, educational and informational purposes only and does not constitute investment or consultation advice or investment strategy. The information is not tailored to the investment needs of any specific person and therefore does not involve a consideration of any of the investment objectives, financial situation or needs of any viewer that may receive it. Kindly also note that past performance is not a reliable indicator of future results. Actual results may differ materially from those anticipated in forward-looking or past performance statements. We assume no liability as to the accuracy or completeness of any of the information and/or content provided herein and the Company cannot be held responsible for any omission, mistake nor for any loss or damage including without limitation to any loss of profit which may arise from reliance on any information supplied by Everest Fortune Group.
AUDCAD | Comp. Trade 2AUDCAD has been in bullish trend but after hitting its top it has printed bearish divergence on RSI.Considering its past behaviour and divergence there are quite strong indications that it is going to start a bearish trend.Hence it may prove a good set-up to trade.
AUDCAD Massive Short! SELL!
My dear friends,
AUDCAD looks like it will make a good move, and here are the details:
The market is trading on 0.8911 pivot level.
Bias - Bearish
Technical Indicators: Supper Trend generates a clear short signal while Pivot Point HL is currently determining the overall Bearish trend of the market.
Goal - 0.8881
About Used Indicators:
Pivot points are a great way to identify areas of support and resistance, but they work best when combined with other kinds of technical analysis
Disclosure: I am part of Trade Nation's Influencer program and receive a monthly fee for using their TradingView charts in my analysis.
———————————
WISH YOU ALL LUCK
AUDCAD SHORT FORECAST Q2 W25 D20 Y25AUDCAD SHORT FORECAST Q2 W25 D20 Y25
Professional Risk Managers👋
Welcome back to another FRGNT chart update📈
Diving into some Forex setups using predominantly higher time frame order blocks alongside intraday confirmation breaks of structure.
💡Here are some trade confluences📝
✅Weekly 50 EMA
✅Weekly order block rejection
✅Daily order block rejection
✅15’ order block identification
🔑 Remember, to participate in trading comes always with a degree of risk, therefore as professional risk managers it remains vital that we stick to our risk management plan as well as our trading strategies.
📈The rest, we leave to the balance of probabilities.
💡Fail to plan. Plan to fail.
🏆It has always been that simple.
❤️Good luck with your trading journey, I shall see you at the very top.
🎯Trade consistent, FRGNT X
Sell ideaPrice took out external range liquidity. Then the New York opening price then takes out buyside liquidity and gave a market structure shift to the down side. Intended selling from the midnight opening price and take profit is at the internal range liquidity
AUDCAD Sell- Go for sell then manage your trade
- potentially go lower
- Refine entry with smaller SL for better RR, if your strategy allow
A Message To Traders:
I’ll be sharing high-quality trade setups for a period time. No bullshit, no fluff, no complicated nonsense — just real, actionable forecast the algorithm is executing. If you’re struggling with trading and desperate for better results, follow my posts closely.
Check out my previously posted setups and forecasts — you’ll be amazed by the high accuracy of the results.
"I Found the Code. I Trust the Algo. Believe Me, That’s It."
AUDCAD The Target Is UP! BUY!
My dear subscribers,
AUDCAD looks like it will make a good move, and here are the details:
The market is trading on 0.8830 pivot level.
Bias - Bullish
Technical Indicators: Both Super Trend & Pivot HL indicate a highly probable Bullish continuation.
Target - 0.8861
About Used Indicators:
The average true range (ATR) plays an important role in 'Supertrend' as the indicator uses ATR to calculate its value. The ATR indicator signals the degree of price volatility.
Disclosure: I am part of Trade Nation's Influencer program and receive a monthly fee for using their TradingView charts in my analysis.
———————————
WISH YOU ALL LUCK
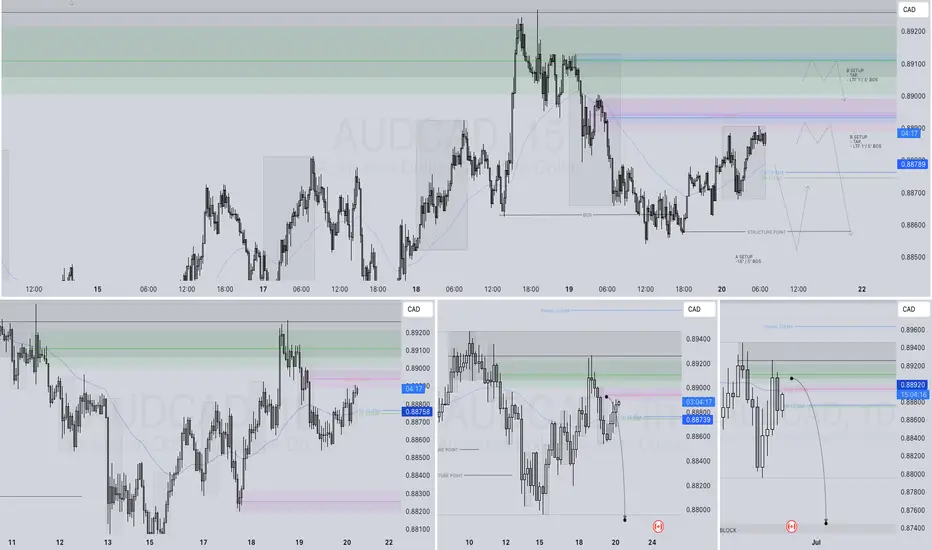
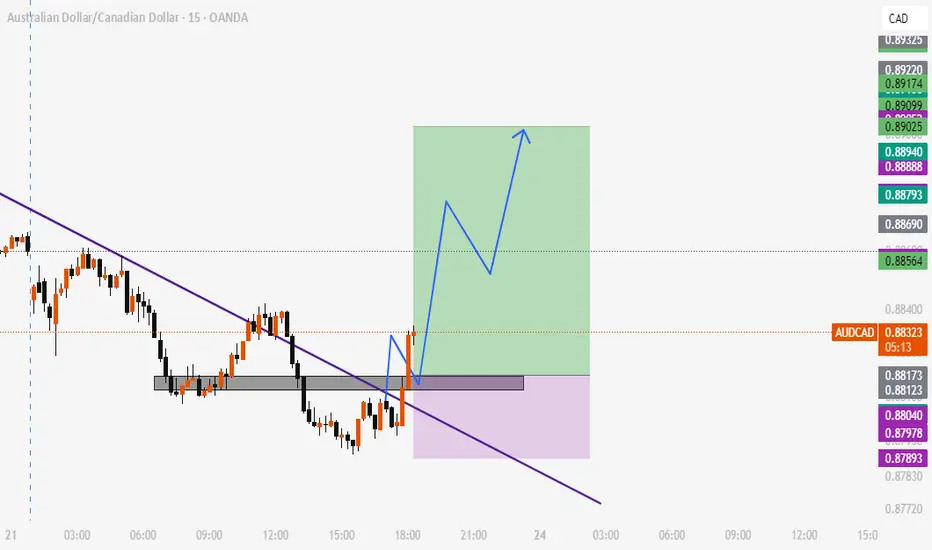
AudCad Trade IdeaAudCad is clearly ranging between 2 solid levels of support and resistance. We had clean bearish structures leading back into support where higher time frames then gave a bullish flip. I personally entered longs after the retest for a 1:3rr with targets just at the next level. We'll see how the set up plays out. All higher time frames are currently bullish as well.

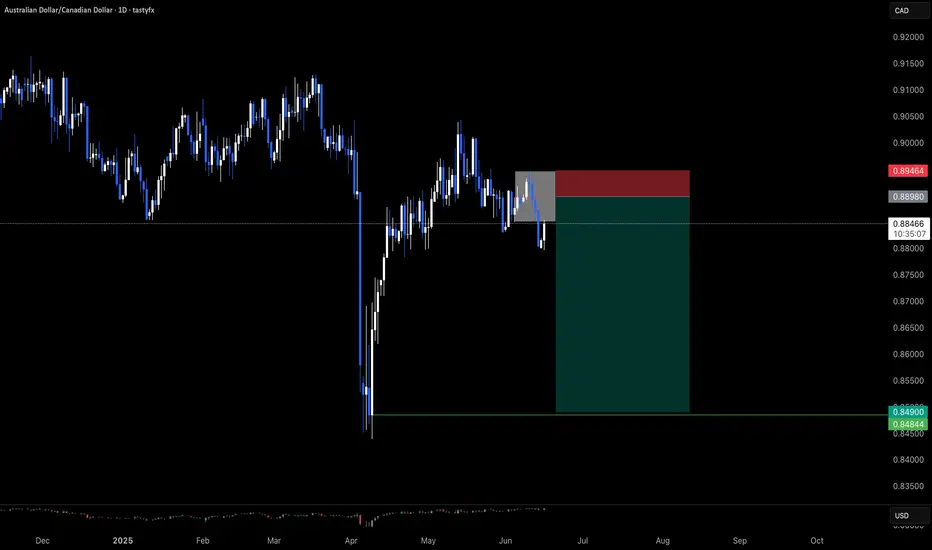
AUDCAD - OUTLOOKMy current view on AUDCAD. expecting CAD continue to strengthen in the coming weeks, and in-turn, expecting weak AUD in AUDCAD.
"May fortune attend thee, and thy trade prosper." .......L2Earned
AUDCAD SHORTThe sell is coming once the mkt reach the resistance consolidation band aera, and at that aera there is also monthly S/R/PP AERA THERE!!! And the BOLLINGER BAND will act as a "DYNAMIC RESISTANCE AERA TOO", so watch out for a "Price Action and Bearish Candlestick Revers Pattern" on the 1h/4h TF to go short/sell
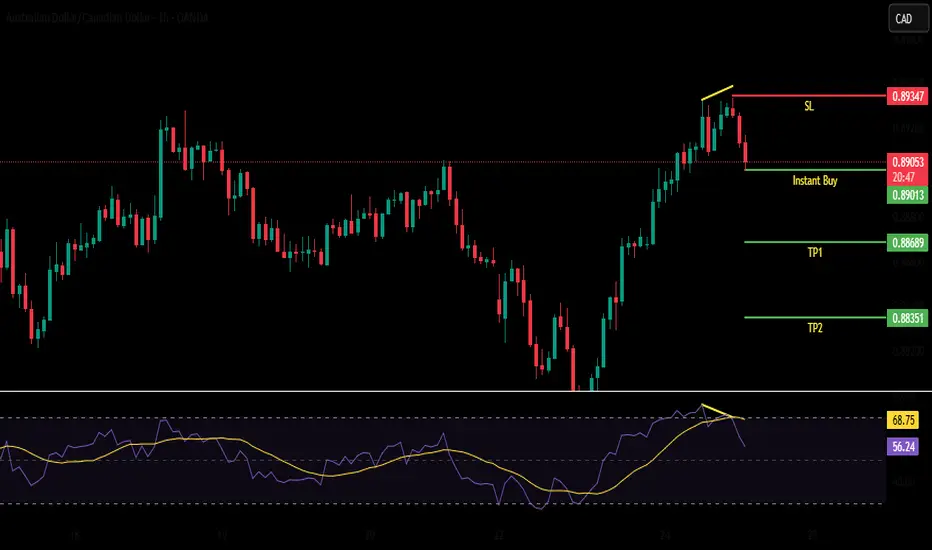
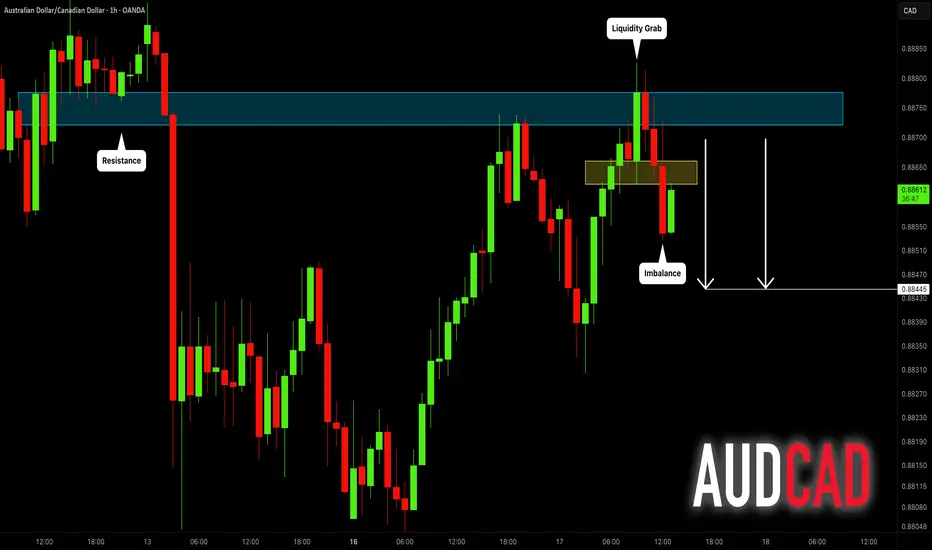
AUDCAD: Pullback From Resistance Confirmed 🇦🇺🇨🇦
AUDCAD is going to retrace from a key intraday horizontal resistance.
A local bearish CHoCH and an imbalance on an hourly time frame
provide a strong bearish confirmation.
Goal - 0.88445
❤️Please, support my work with like, thank you!❤️
I am part of Trade Nation's Influencer program and receive a monthly fee for using their TradingView charts in my analysis.
AUDCAD: The Real Move Happens After the TrapNot every trade needs to be flashy.
This one was clean. Simple. Intentional.
And it came after most traders got taken out.
What I Saw :
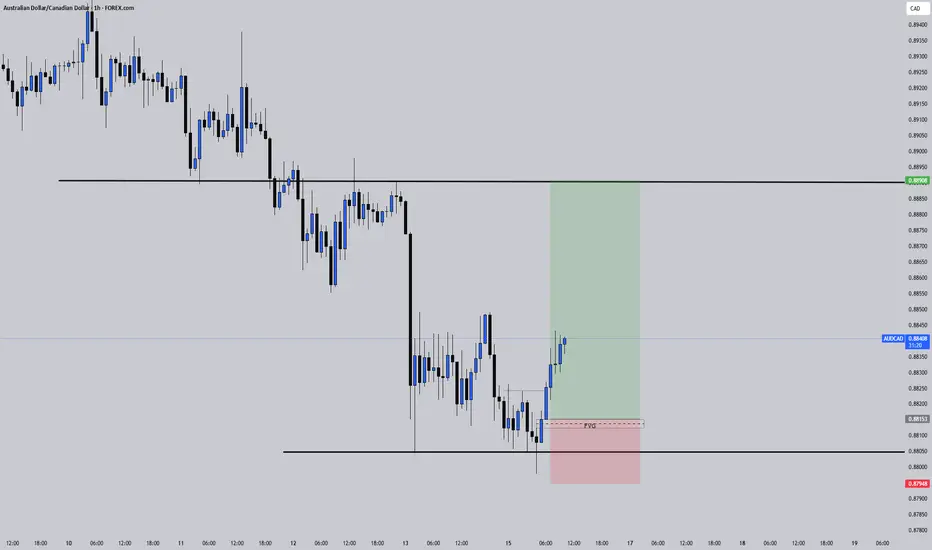
Price swept PDL: textbook sell-side liquidity.
But instead of jumping in too early, I waited.
Why?
Because I’ve learned something:
👉 The first reaction is often just noise.
👉 The second one, the one that fills into structure. That’s where clarity lives.
My Entry Logic:
After the sweep, price broke minor structure. That was my Change of Character. I will just have to wait for price to pull into the FVG below 50% fibs retracement. Stop below the low. Target at the PDH.
Nothing fancy. Just discipline .
Psychology Check:
I’ve taken this setup before and watched it run without me. Why? Because I used to hesitate. I wanted more confirmation… or feared being wrong.
But here’s the truth:
Your edge is only real if you’re willing to take the shot when it appears .
This wasn’t a guess.
It was system + structure + emotional control.
AUDCAD SELL SETUP IDEAI will be looking at shorting AUDCAD @0.89800000 area which is at the premium zone and also align with the trend. My stop loss will be @ the red horizontal line above and my take profit will be 3RR respectively. Apply proper risk management.
AUDCAD trade ideea.The trend is bearish same as GBPCHF, head and shoulders panttern, now I am waiting for a retest of the neckline for me to enter the trade.