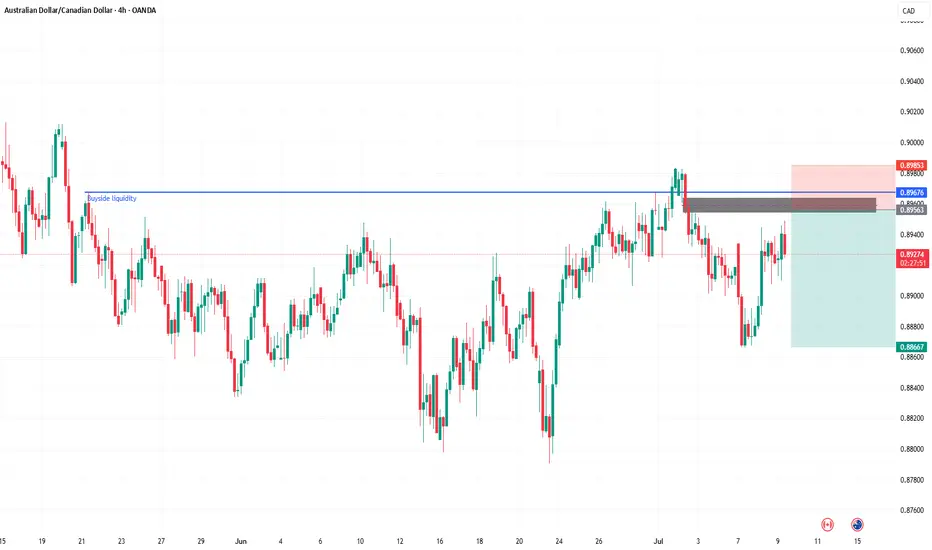
AUDCAD – Bearish Rejection at Key Resistance ZoneAUDCAD is showing signs of weakness near the 0.8980 supply zone after an extended rally. The pair is now reacting to a historically respected resistance area, with bearish momentum building as exhaustion sets in.
🔍 Technical Outlook:
✅ Price rejected at multi-touch resistance around 0.8980
📐 Clean bearish structure forming after wedge-like exhaustion
📉 Expecting a move down toward:
TP1: 0.89365 – recent minor structure
TP2: 0.89080 – key demand zone from early July
TP3: 0.88654 – full measured target from range
📛 Invalidation above: 0.8985
🌍 Fundamental Breakdown:
🇦🇺 Australia:
📉 Softening inflation and retail sales
🏦 RBA cautious with limited appetite for further hikes
🇨🇳 Weak Chinese demand adds pressure on AUD
🇨🇦 Canada:
💪 Supported by rising oil prices and solid employment data
🏦 BoC remains vigilant on inflation, though on hold
🛢️ Strong WTI prices continue to support CAD
⚠️ Risks to the Bearish View:
⚡ Unexpectedly strong China data could boost AUD
📉 Sudden drop in oil prices would hurt CAD
🗣️ Surprise hawkish shift from RBA
🔗 Correlation & Flow:
AUDCAD is a lagging asset, heavily influenced by WTI crude (boosting CAD) and China-linked risk flows (affecting AUD).
Keep an eye on AUDUSD and USDCAD for early signals.
📆 Upcoming Key Events:
🇦🇺 RBA Minutes, Jobs Data, Wages Index
🇨🇦 BoC Business Outlook, CPI Print
🛢️ US Oil Inventories (affects CAD)
🧭 Summary:
🔻 Bias: Bearish
📊 Drivers: Oil strength, RBA caution, CAD resilience
⚠️ Risk: China rebound or oil correction
🕵️ Watch: Canadian CPI + Australian jobs data
📉 Likely to Follow: Oil and AUDUSD/USDCAD macro trends
AUDCAD trade ideas
07.07.25 Morning ForecastPairs on Watch -
FX:AUDCAD
FX:USDJPY
FX:EURUSD
A short overview of the instruments I am looking at for today, multi-timeframe analysis down to what I will be looking at for an entry. Enjoy!

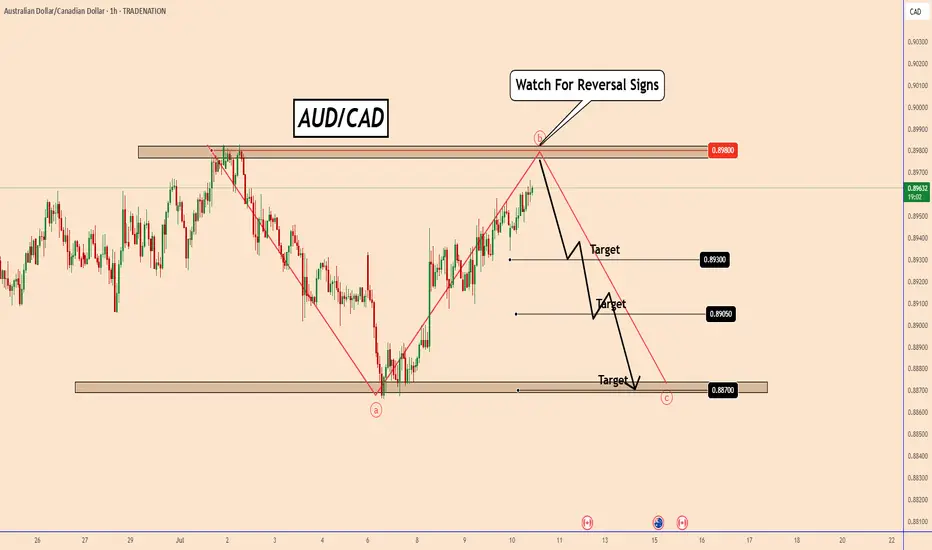
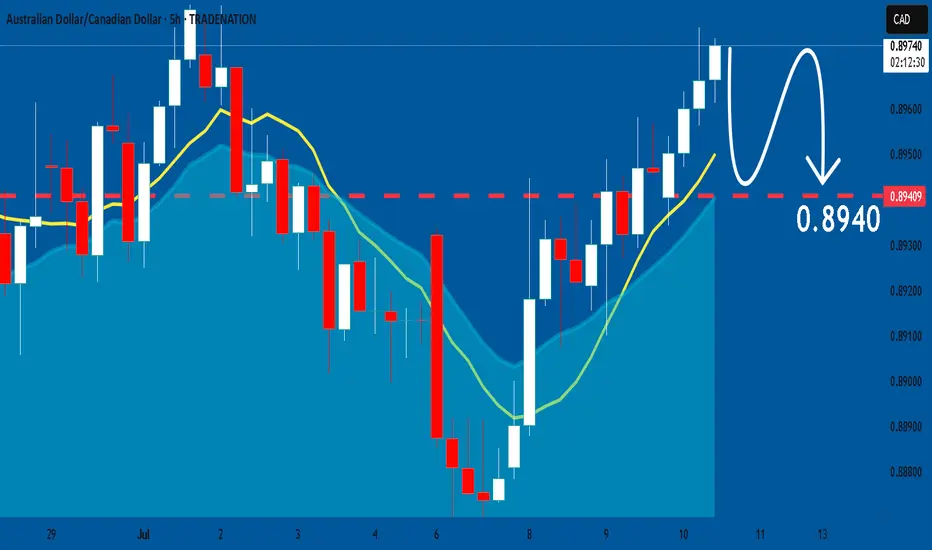
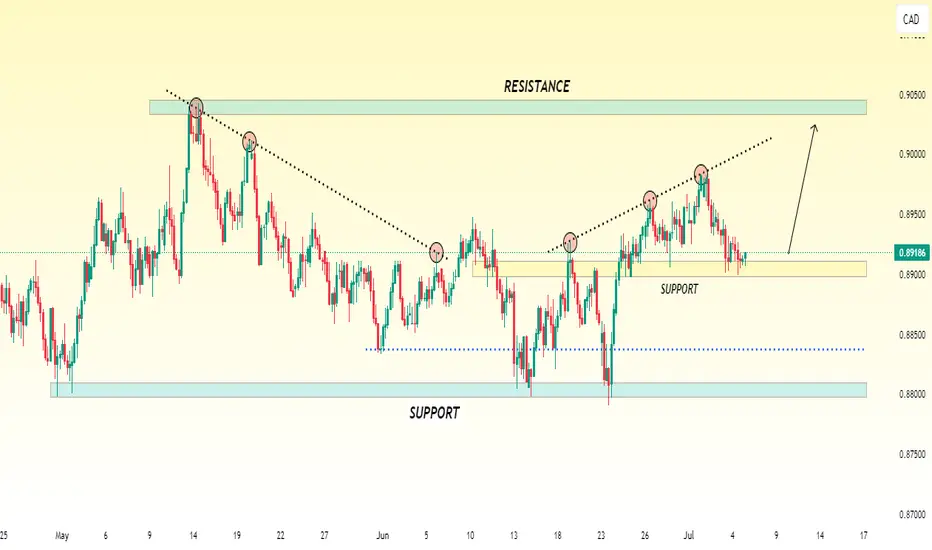
AUDCAD Eyes Key Resistance: Will It Break or Bounce?AUDCAD Eyes Key Resistance: Will It Break or Bounce?
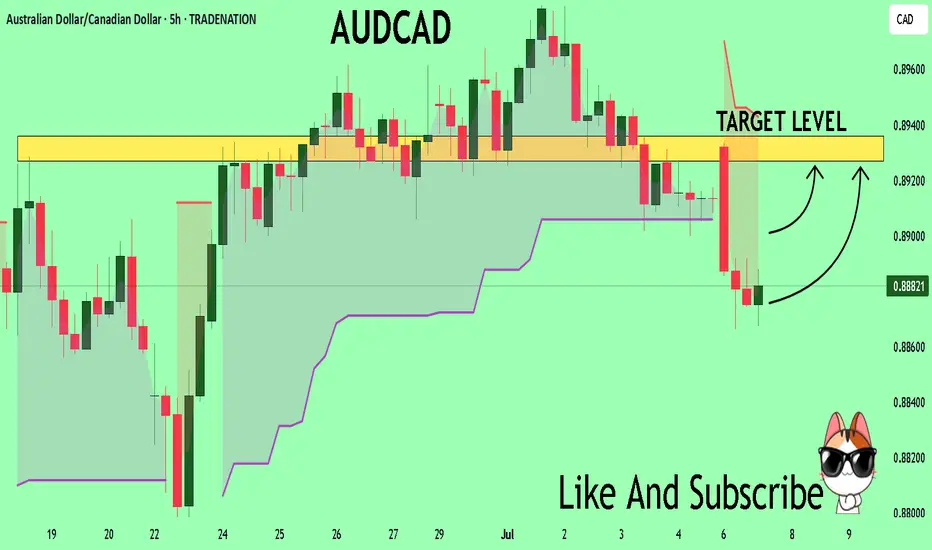
AUDCAD is approaching a significant resistance zone near 0.8980—the same level that capped price action in early July.
While the pair is showing signs of hesitation with small candles, this indecision may be tied to broader market uncertainty, including renewed concerns over Trump-era tariffs.
If we monitor for potential reversal signals around this level, it could present a solid trading opportunity.
🎯 My targets: 0.8930; 0.8905 ; 0.8870
You may find more details in the chart!
Thank you and Good Luck!
PS: Please support with a like or comment if you find this analysis useful for your trading day
Disclosure: I am part of Trade Nation's Influencer program and receive a monthly fee for using their TradingView charts in my analysis.
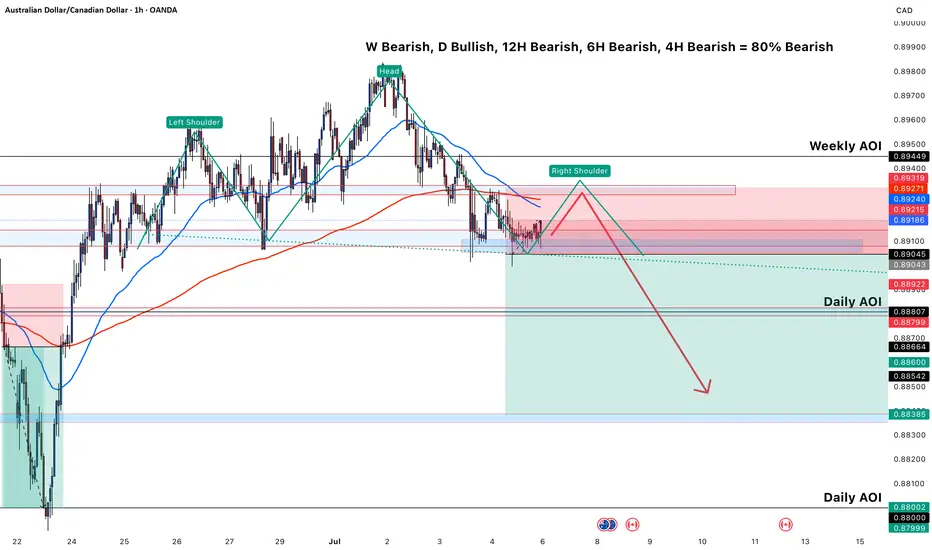
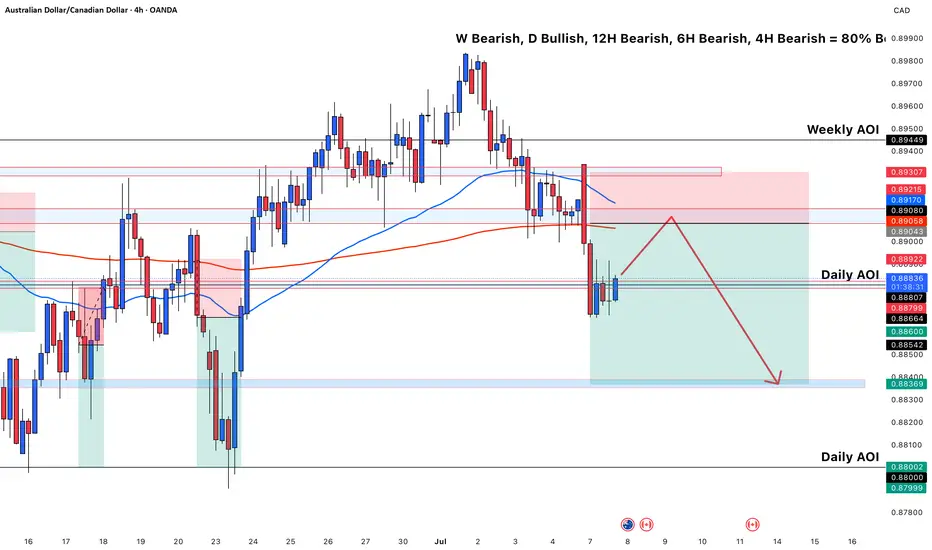
AUD/CAD chart shows a **clear bearish bias**This AUD/CAD chart shows a **clear bearish bias** supported by multiple timeframes and a head and shoulders pattern forming, which justifies a potential **sell setup**. Here's a breakdown of the reasoning:
---
### 🧠 **Multi-Timeframe Analysis Bias**
* **Weekly: Bearish**
* **Daily: Bullish**
* **12H, 6H, 4H: Bearish**
* ✅ Overall: **80% Bearish Bias**
This gives confidence that **lower timeframes** are aligning to favor a **short trade**.
---
### 🧱 **Technical Structure – Head & Shoulders**
* **Left Shoulder**, **Head**, and **Right Shoulder** are identified.
* The **Right Shoulder is projected to complete** near the **Weekly Area of Interest (AOI)**.
* This structure is a **classic bearish reversal pattern**, suggesting a potential breakdown after the right shoulder forms.
---
### 📍 **Key Zones**
* **Weekly AOI (0.89271–0.89449)**: Strong supply zone; potential area for **price rejection**.
* **Daily AOI (0.88002–0.88709)**: Key downside target, aligning with prior demand zones.
---
### 🧰 **Indicators and Confluences**
* **Price is below the 50 EMA and testing the 200 EMA**, indicating weakening bullish momentum.
* Bearish price action is forming near resistance.
* Entry is planned after the right shoulder forms, respecting structure.
---
### 🧨 **Sell Trade Idea Summary**
* **Sell after the right shoulder completes around 0.892–0.894**
* **Target**: Daily AOI (especially near 0.8800–0.8838)
* **Stop Loss**: Above the head (likely above 0.8950)
* **Risk/Reward**: Appears favorable (>2:1 based on projection)
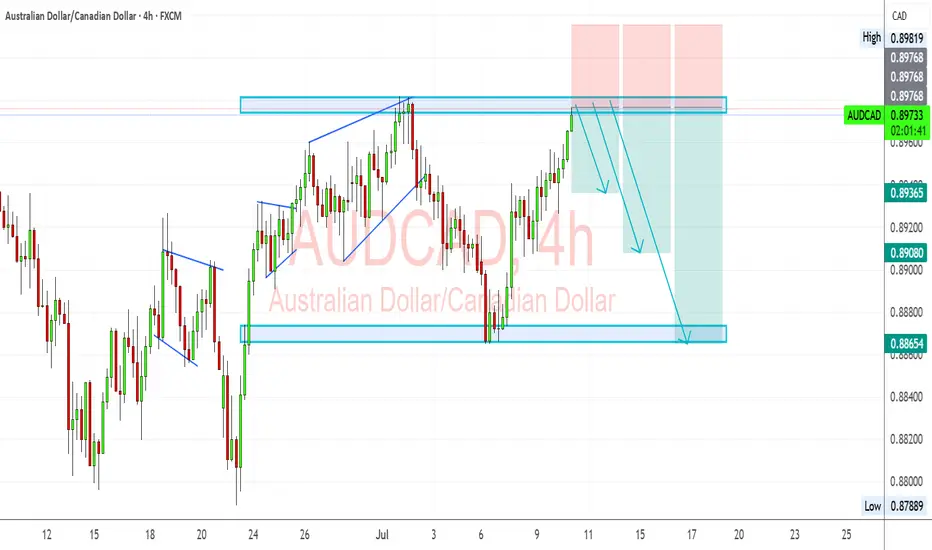
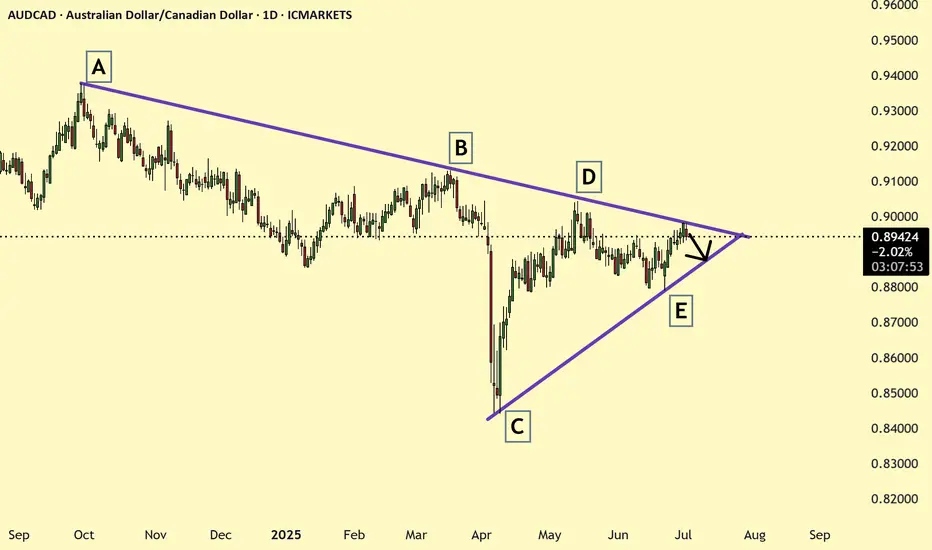
AUDCAD (Daily Timeframe) shows a symmetrical triangleAUDCAD has reached the resistance line of symmetrical upper trend line and price got rejected from here and may likely to go the support trend line. 4 hr chart makes it more clear.
AUDCAD Trading Opportunity! BUY!
My dear subscribers,
AUDCAD looks like it will make a good move, and here are the details:
The market is trading on 0.8881 pivot level.
Bias - Bullish
Technical Indicators: Both Super Trend & Pivot HL indicate a highly probable Bullish continuation.
Target - 0.8927
About Used Indicators:
The average true range (ATR) plays an important role in 'Supertrend' as the indicator uses ATR to calculate its value. The ATR indicator signals the degree of price volatility.
Disclosure: I am part of Trade Nation's Influencer program and receive a monthly fee for using their TradingView charts in my analysis.
———————————
WISH YOU ALL LUCK
AUDCAD SHORT Potential retest of the same level as last week;
Entry at both Daily and Weekly AOi
Weekly Rejection At AOi
Previous Weekly Structure Point
Weekly EMA retest
Daily Rejection at AOi
Previous Structure point Daily
Around Psychological Level 0.89500
H4 Candlestick rejection
Levels 4.17
Entry 95%
REMEMBER : Trading is a Game Of Probability
: Manage Your Risk
: Be Patient
: Every Moment Is Unique
: Rinse, Wash, Repeat!
: Christ is King.
BUY AUDCAD now for a four hour time frame bullish trend continuBUY AUDCAD now for a four hour time frame bullish trend continuation ...............
STOP LOSS: 0.8907
This buy trade setup is based on hidden bullish divergence trend continuation trading pattern ...
Always remember, the trend is your friend, so whenever you can get a signal that the trend will continue, then good for you to be part of it
TAKE PROFIT : take profit will be when the trend comes to an end, feel from to send me a direct DM if you have any question about take profit or anything...
Remember to risk only what you are comfortable with... trading with the trend, patient and good risk management is the key to success here
audcad Short
We have a break of structure. we waiting for a fair value gap on lower time frame in order to sell to those zone. lets wait and see how it goes
AUDCAD: Weak Market & Bearish Continuation
The recent price action on the AUDCAD pair was keeping me on the fence, however, my bias is slowly but surely changing into the bearish one and I think we will see the price go down.
Disclosure: I am part of Trade Nation's Influencer program and receive a monthly fee for using their TradingView charts in my analysis.
❤️ Please, support our work with like & comment! ❤️
Bullish ICT Entry 15 minute Entry:
1. Sell - side liquidity swept.
2. BOS up onM15 confirm shift.
3. Entry from bullish OB or FVG after pullback.
4. SL below liquidity sweep.
5. TP internal high/TP2 premium zone.
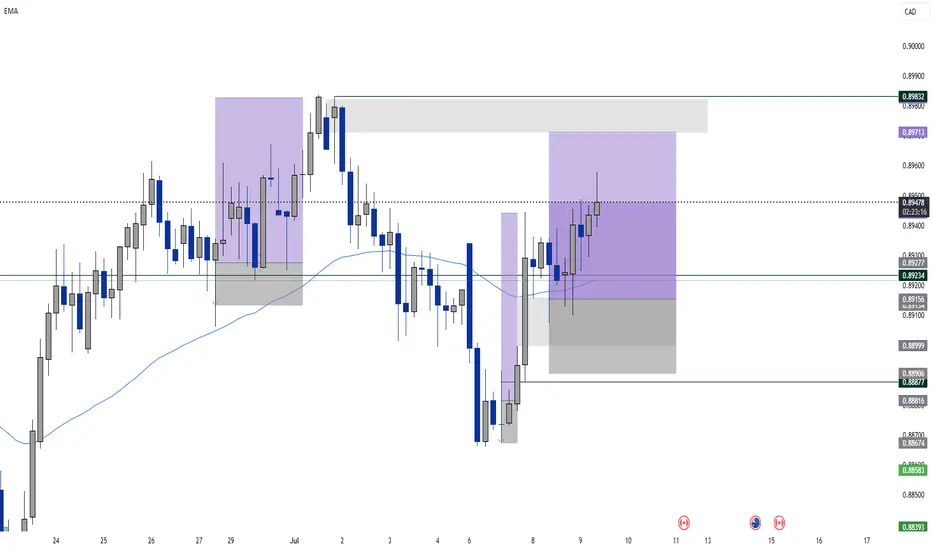
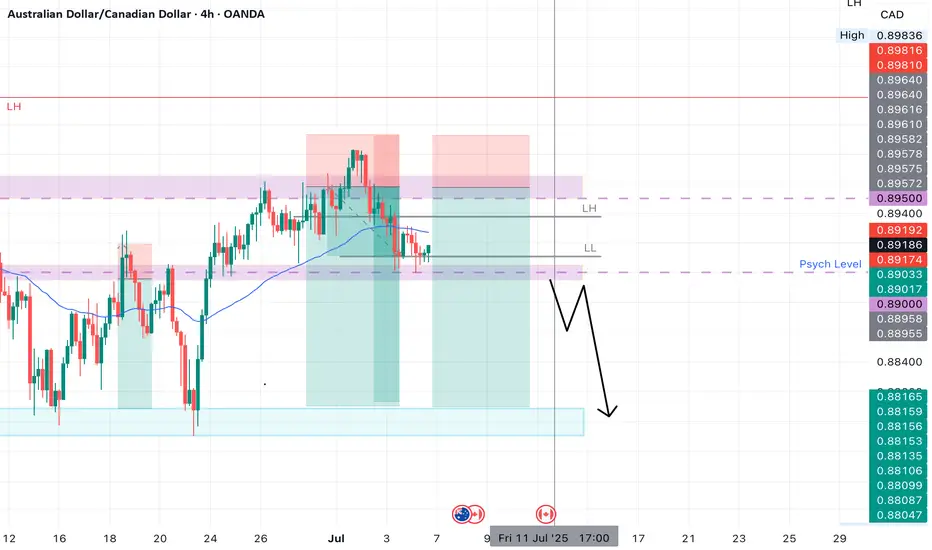
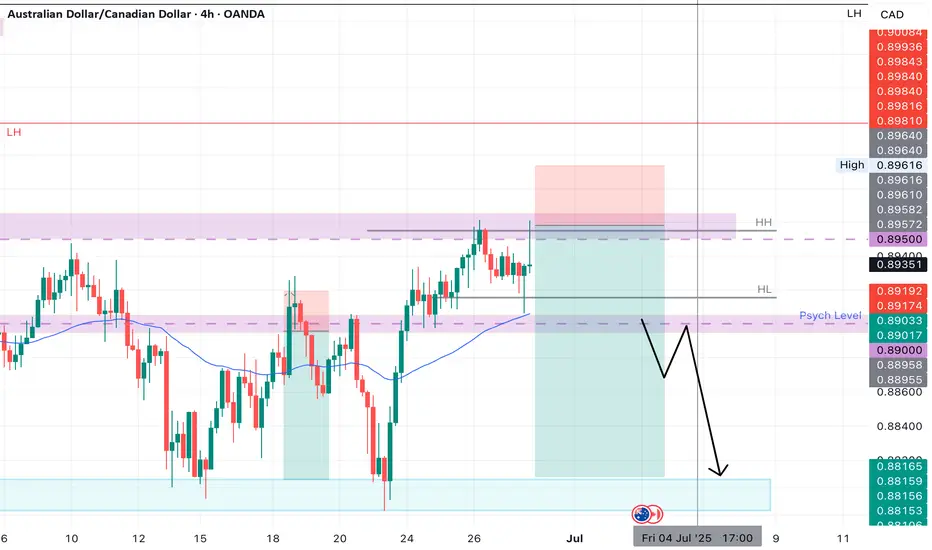
short setup on AUD/CAD🧠 Market Sentiment by Timeframe
Weekly (W): Bearish
Daily (D): Bullish
12H, 6H, 4H: Bearish
Bias: Short-term continuation to the downside after retest of supply/imbalance.
🔍 Technical Breakdown
🔴 1. Structure & Momentum
Price broke down from previous 4H support (~0.88900–0.89000) creating a lower low.
A bearish BOS confirms momentum shift.
Price is now consolidating below the 200 EMA and 50 EMA → indicating bearish pressure.
🟥 2. Weekly AOI / Supply Zone
Red box above (0.89058–0.89307) marks Weekly AOI (Supply).
It represents a strong resistance area where price previously sold off.
Expected lower high (LH) to form at the retest of this supply.
🟦 3. Trade Plan
Entry Zone: Anticipated pullback into 0.88922–0.89058 (Daily AOI + 200 EMA resistance).
Stop Loss: Above the Weekly AOI at ~0.89307.
Take Profit (TP): Toward the Daily AOI around 0.88000–0.87999, a previous demand zone.
RR: Over 2:1 potential, depending on exact entry.
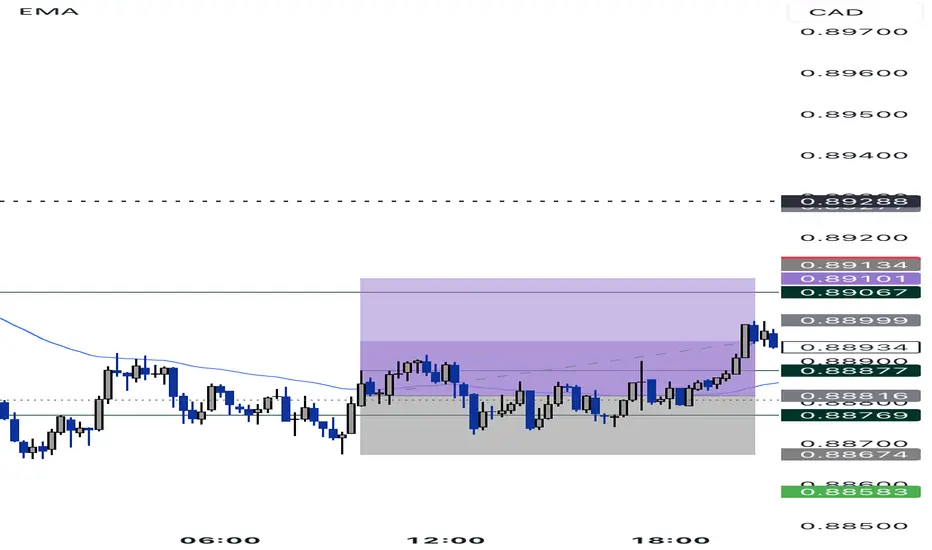
🔵 4. EMA Dynamics
Price currently sits below both the 50 EMA (blue) and 200 EMA (red), confirming bearish alignment.
EMAs act as dynamic resistance zones, giving confluence to the short.
📉 Bearish Confluences
Bearish market structure on 4H, 6H, 12H.
EMA crossover and rejection.
Weekly AOI = major supply.
Daily AOI just rejected.
Anticipated lower high to form before continuation.
✅ Summary of Setup
Type: Counter-trend against Daily bullish bias, with HTF bearish confirmation.
Setup: Pullback → rejection → short continuation.
Target: Clean sweep of liquidity near 0.8800 Daily AOI.
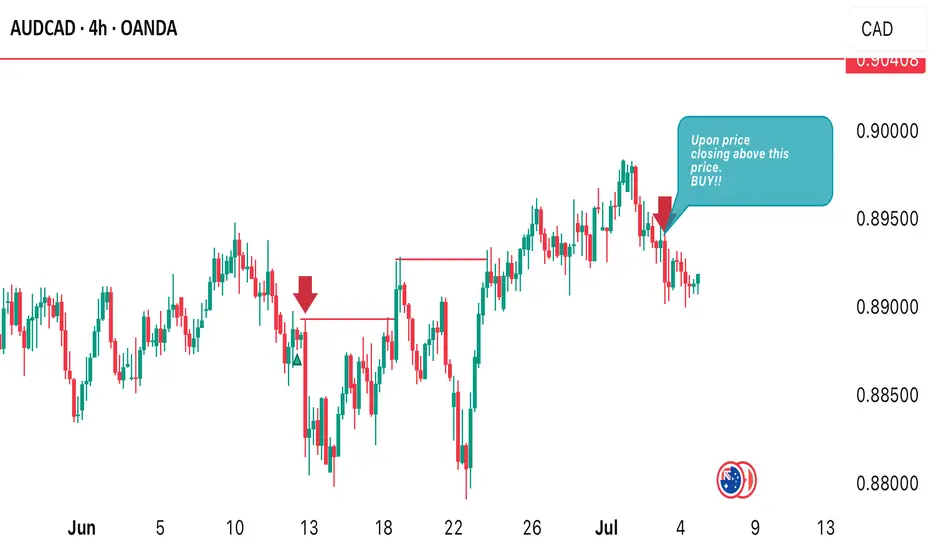
AUDCAD INTRADAY TIMEFRAME IS QUITE BULLISHPrice has completely shifted from intraday bearish to bullish. I anticipate more. Bullish price action to develop in later days of coming week. I am positioning myself for a buy opportunity. Once I see price close above 0.89413 I’m going long!
AUDCAD SHORT Market structure bearish on HTFs DW
Entry at both Daily and Weekly AOi
Weekly Rejection At AOi
Previous Weekly Structure Point
Weekly EMA retest
Daily Rejection at AOi
Previous Structure point Daily
Around Psychological Level 0.89500
H4 Candlestick rejection Y
Levels 4,17
Entry 95%
REMEMBER : Trading is a Game Of Probability
: Manage Your Risk
: Be Patient
: Every Moment Is Unique
: Rinse, Wash, Repeat!
: Christ is King.
AUDCAD 15min ICT 1:2 bullish trade 1. Daily
• Sell-side liquidity swept below previous low.
• Price bounced from a bullish order block.
• Bias: Bullish, targeting draw on liquidity above.
2. 4H
• Bullish FVG respected.
• Break of structure (BOS) to upside.
• Retracement into OB + FVG → continuation expected.
3. 1H
• Strong displacement candle.
• Price returned to 1H FVG + OB.
• MSS confirms shift in bullish momentum.
15M
• Liquidity sweep + market structure shift.
• Entry on return to OB or FVG.
• Target: Equal highs / 4HR.
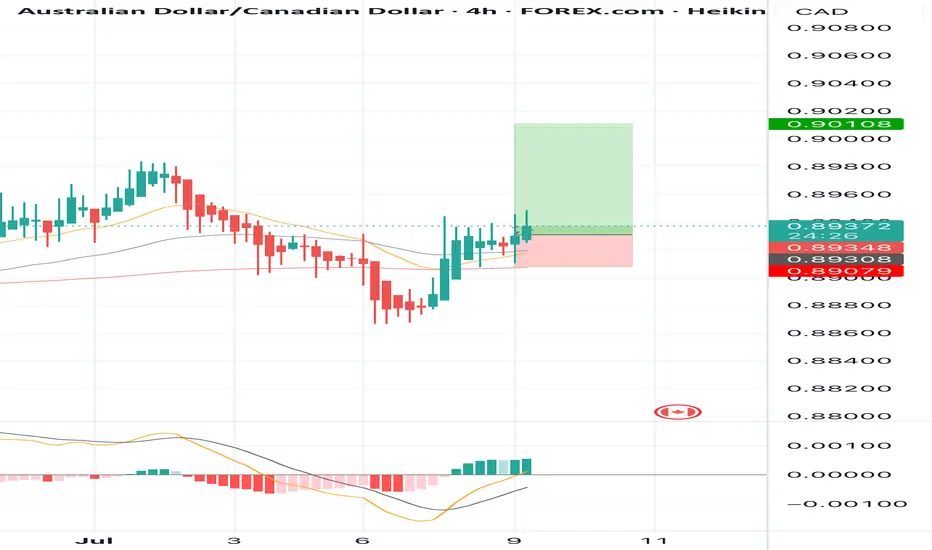
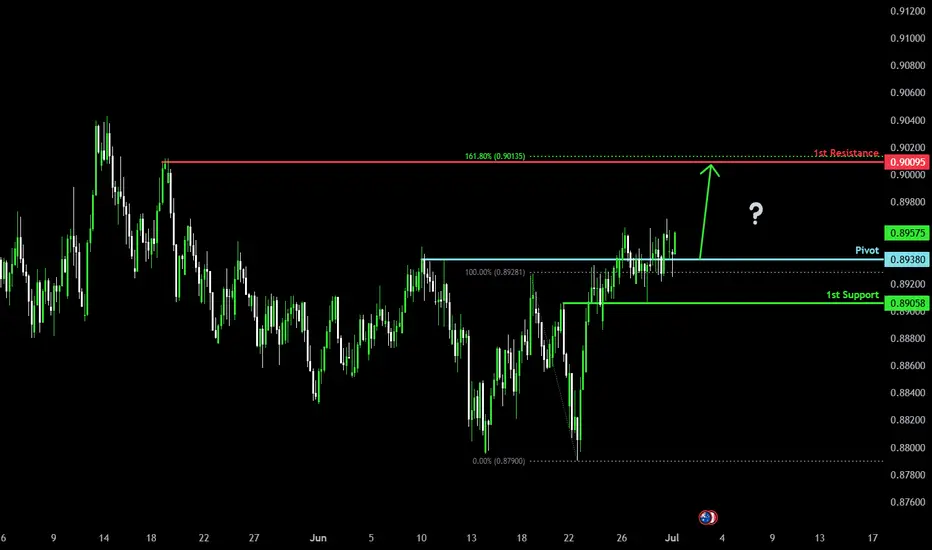
Bullish momentum to extend?AUD/CAD has bounced off the pivot and could potentially rise to the 1st resistance which lines up with the 161.8% Fibonacci extension.
Pivot: 0.8938
1st Support: 0.8905
1st Resistance: 0.9009
Risk Warning:
Trading Forex and CFDs carries a high level of risk to your capital and you should only trade with money you can afford to lose. Trading Forex and CFDs may not be suitable for all investors, so please ensure that you fully understand the risks involved and seek independent advice if necessary.
Disclaimer:
The above opinions given constitute general market commentary, and do not constitute the opinion or advice of IC Markets or any form of personal or investment advice.
Any opinions, news, research, analyses, prices, other information, or links to third-party sites contained on this website are provided on an "as-is" basis, are intended only to be informative, is not an advice nor a recommendation, nor research, or a record of our trading prices, or an offer of, or solicitation for a transaction in any financial instrument and thus should not be treated as such. The information provided does not involve any specific investment objectives, financial situation and needs of any specific person who may receive it. Please be aware, that past performance is not a reliable indicator of future performance and/or results. Past Performance or Forward-looking scenarios based upon the reasonable beliefs of the third-party provider are not a guarantee of future performance. Actual results may differ materially from those anticipated in forward-looking or past performance statements. IC Markets makes no representation or warranty and assumes no liability as to the accuracy or completeness of the information provided, nor any loss arising from any investment based on a recommendation, forecast or any information supplied by any third-party.
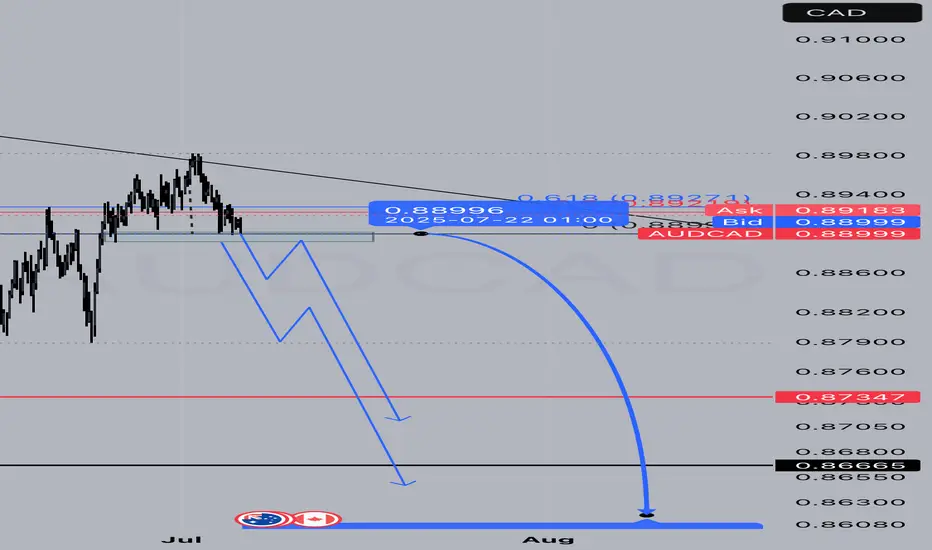
AUDCAD SELL projection AUDCAD Closer Look, We need to witness Some sell Pressure on AUDCAD from a Daily/4H timeframe look.
We have a support level at 0.88997 tested severally in recent times.
By Next week the 0.88997 Support will be broken to the downside. which will open AUDCAD to further Sell down to 0.87347 - 0.86665 Support Levels
AUDCAD Holding at Support – Possible Move UpAUDCAD seems to be sitting on a strong support level. From this point, I think the price could start moving up. If buyers come in, we might see the market go higher in the next few days.
AUDCAD TECHNICAL ANALYSIS TODAY! - H1 timeframe.Price recovered back to a pullback resistance of out of 0.89311 from the intraday timeframe, we are looking forward to buying AUDCAD as market trend remains bullish from the higher time frame. A buy opportunity is envisaged.

AUDCAD SHORT DAILY FORECAST Q3 D10 W28 Y25AUDCAD SHORT DAILY FORECAST Q3 D10 W28 Y25
Professional Risk Managers👋
Welcome back to another FRGNT chart update📈
Diving into some Forex setups using predominantly higher time frame order blocks alongside confirmation breaks of structure.
Let’s see what price action is telling us today! 👀
💡Here are some trade confluences📝
✅Daily Order block identified
✅4H Order Block identified
✅1H Order Block identified
🔑 Remember, to participate in trading comes always with a degree of risk, therefore as professional risk managers it remains vital that we stick to our risk management plan as well as our trading strategies.
📈The rest, we leave to the balance of probabilities.
💡Fail to plan. Plan to fail.
🏆It has always been that simple.
❤️Good luck with your trading journey, I shall see you at the very top.
🎯Trade consistent, FRGNT X

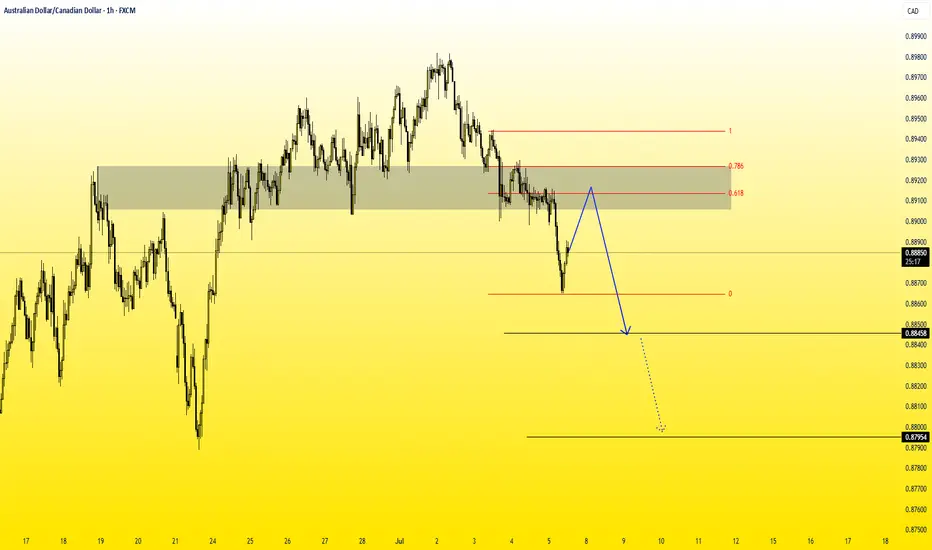
AUDCAD – Bearish Setup Following Retracement to Key ResistanceWelcome to Velatrix Capital.
Below is a live market opportunity identified by our internal trading desk.
This is not financial advice. It’s a data-backed, logic-driven trading edge. Use it with discipline — or don’t use it at all.
🧠 Technical Outlook
AUDCAD is currently showing bullish momentum on the lower timeframes, approaching a key resistance zone between 0.89057 – 0.89272.
Our trading desk expects price to reach this supply zone and then present a short-selling opportunity with favorable risk/reward potential.
We advise waiting patiently for the price to enter this key range before initiating any short trades.
Trade Parameters:
• Timeframe: 1H
• Direction: Sell
• Entry Zone: 0.89272 – 0.89057
• Stop Loss (SL): 0.89386
• Take Profit 1 (TP1): 0.88458
• Take Profit 2 (TP2): 0.87954
• Risk/Reward (R/R): 1:2 / 1:4.80
Note: Setup is invalidated if price breaks and closes above 0.89386.
🔔 Follow Us
This is just the surface.
For more setups, clean breakdowns, and performance-driven content:
📌 Follow, engage, and stay sharp. Our edge is real — and it’s public.
We don’t chase hype. We build edge.
I'm selling AUDCAD.🧨 AUD looks strong — but I'm selling AUDCAD.
China’s bounce and risk-on vibes gave AUD a lift, but it’s shaky under the hood.
🇨🇦 CAD’s weak, sure — but it’s already priced in, and oil could surprise.
I’m short AUDCAD — fading the hype before the cracks show.
📉 Price is high, conviction is higher.
Would you take this trade?

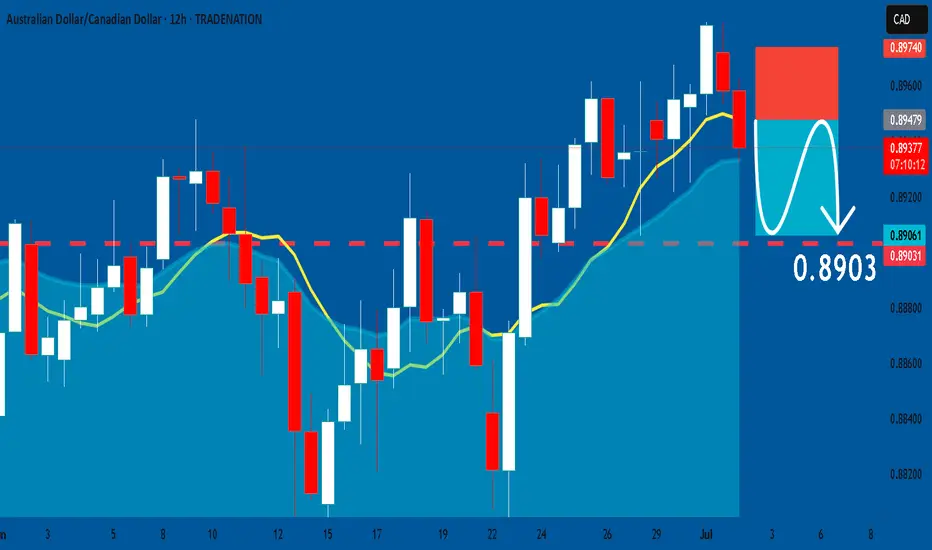
AUDCAD: Bearish Continuation & Short Trade
AUDCAD
- Classic bearish formation
- Our team expects pullback
SUGGESTED TRADE:
Swing Trade
Short AUDCAD
Entry - 0.8947
Sl - 0.8974
Tp - 0.8903
Our Risk - 1%
Start protection of your profits from lower levels
Disclosure: I am part of Trade Nation's Influencer program and receive a monthly fee for using their TradingView charts in my analysis.
❤️ Please, support our work with like & comment! ❤️