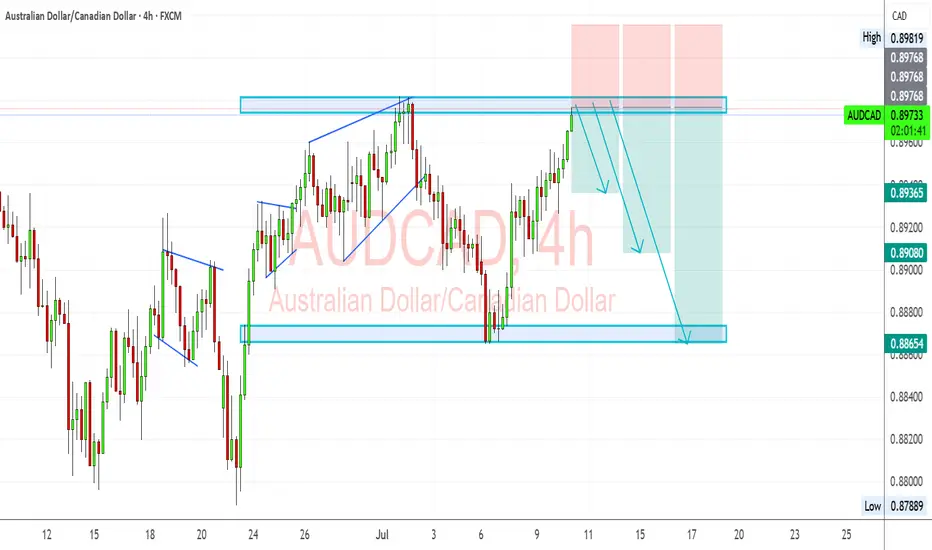
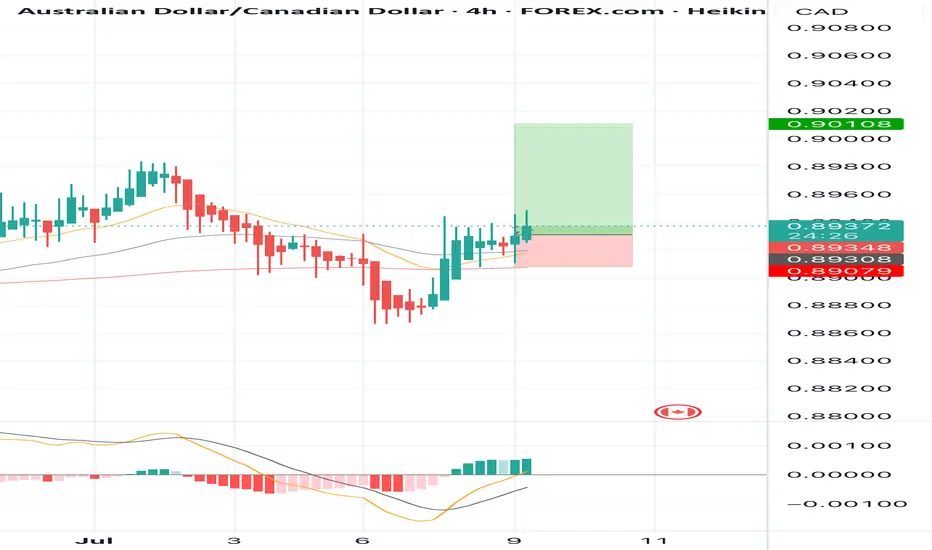
AUDCAD – Bearish Rejection at Key Resistance ZoneAUDCAD is showing signs of weakness near the 0.8980 supply zone after an extended rally. The pair is now reacting to a historically respected resistance area, with bearish momentum building as exhaustion sets in.
🔍 Technical Outlook:
✅ Price rejected at multi-touch resistance around 0.8980
📐 Clean bearish structure forming after wedge-like exhaustion
📉 Expecting a move down toward:
TP1: 0.89365 – recent minor structure
TP2: 0.89080 – key demand zone from early July
TP3: 0.88654 – full measured target from range
📛 Invalidation above: 0.8985
🌍 Fundamental Breakdown:
🇦🇺 Australia:
📉 Softening inflation and retail sales
🏦 RBA cautious with limited appetite for further hikes
🇨🇳 Weak Chinese demand adds pressure on AUD
🇨🇦 Canada:
💪 Supported by rising oil prices and solid employment data
🏦 BoC remains vigilant on inflation, though on hold
🛢️ Strong WTI prices continue to support CAD
⚠️ Risks to the Bearish View:
⚡ Unexpectedly strong China data could boost AUD
📉 Sudden drop in oil prices would hurt CAD
🗣️ Surprise hawkish shift from RBA
🔗 Correlation & Flow:
AUDCAD is a lagging asset, heavily influenced by WTI crude (boosting CAD) and China-linked risk flows (affecting AUD).
Keep an eye on AUDUSD and USDCAD for early signals.
📆 Upcoming Key Events:
🇦🇺 RBA Minutes, Jobs Data, Wages Index
🇨🇦 BoC Business Outlook, CPI Print
🛢️ US Oil Inventories (affects CAD)
🧭 Summary:
🔻 Bias: Bearish
📊 Drivers: Oil strength, RBA caution, CAD resilience
⚠️ Risk: China rebound or oil correction
🕵️ Watch: Canadian CPI + Australian jobs data
📉 Likely to Follow: Oil and AUDUSD/USDCAD macro trends
AUDCAD trade ideas
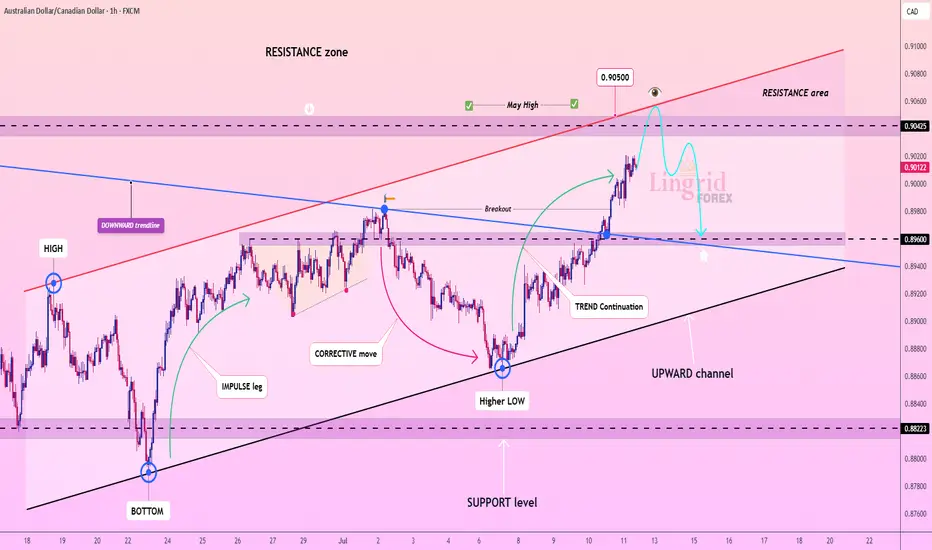
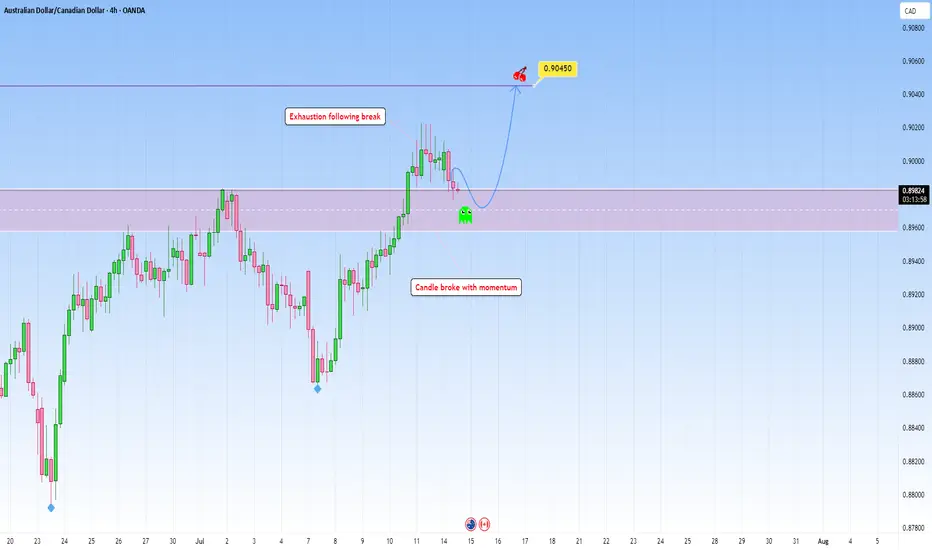
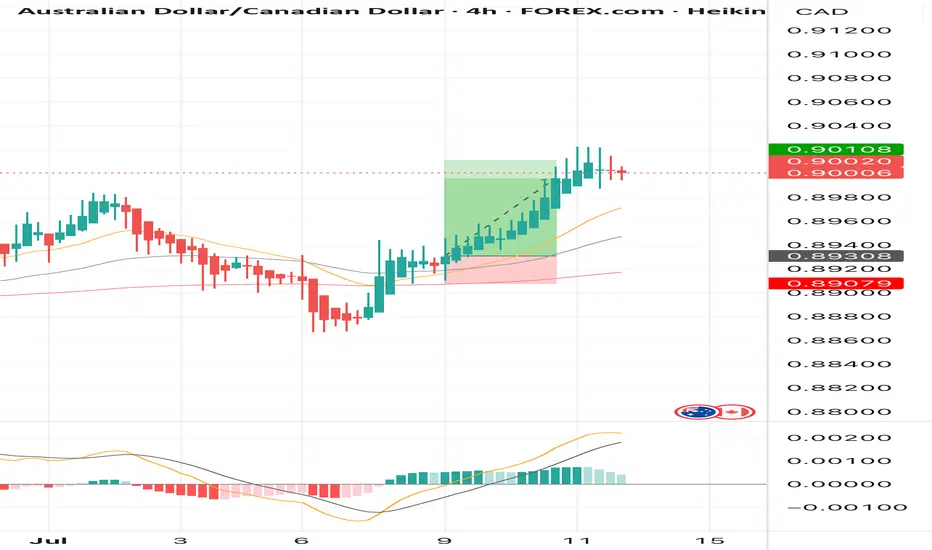
Lingrid | AUDCAD Shoring Opportunity at Monthly HighThe price perfectly fulfilled my last idea . FX:AUDCAD surged through the previous resistance and is now testing the 0.9045–0.9050 zone, where both a horizontal supply and red descending trendline converge. This area is a critical junction, and current price action shows early hesitation with a potential rounding top formation. A deeper pullback is possible if buyers fail to break above this resistance convincingly, with downside targets near prior breakout levels. The broader uptrend remains intact, but short-term correction risks are rising from this confluence zone.
📉 Key Levels
Sell trigger: confirmed rejection below 0.9050 with bearish engulfing or wick exhaustion
Sell zone: 0.9025–0.9050 (key resistance + trendline)
Target: 0.8960 initially, with deeper extension to 0.8822
Invalidation: clean hourly close above 0.9060 signals continuation of uptrend
💡 Risks
Minor support near 0.9000 could stall decline
Stronger-than-expected AUD data could lift price through resistance
False breakout wicks above 0.9050 might trap early sellers
If this idea resonates with you or you have your own opinion, traders, hit the comments. I’m excited to read your thoughts!
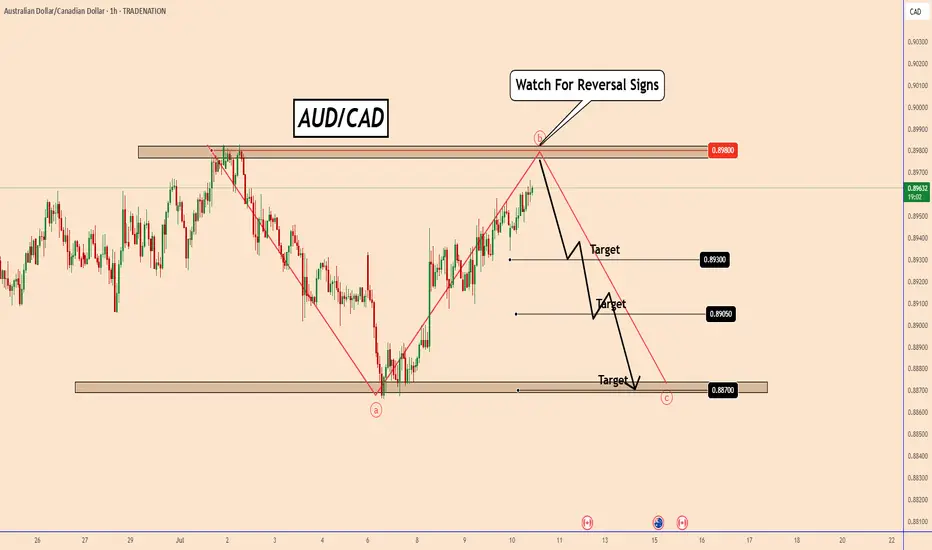
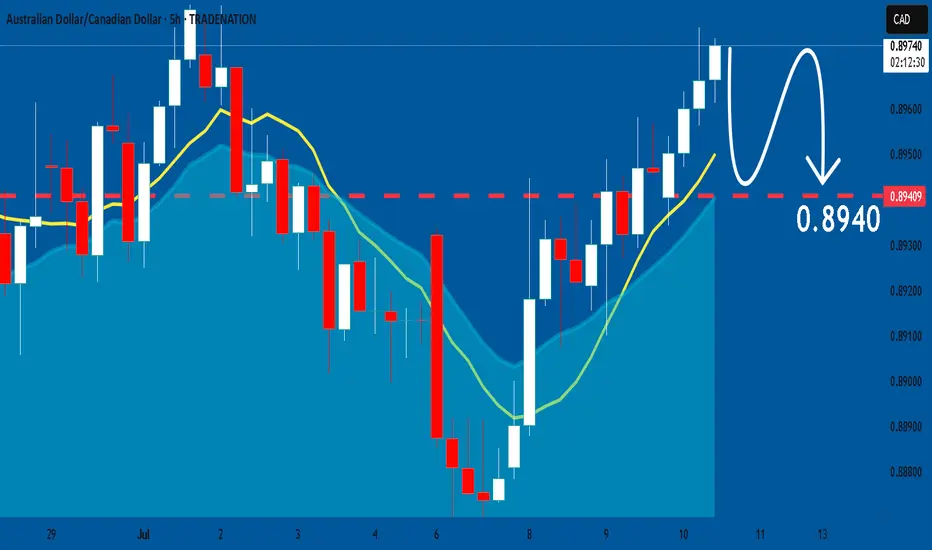
AUDCAD Eyes Key Resistance: Will It Break or Bounce?AUDCAD Eyes Key Resistance: Will It Break or Bounce?
AUDCAD is approaching a significant resistance zone near 0.8980—the same level that capped price action in early July.
While the pair is showing signs of hesitation with small candles, this indecision may be tied to broader market uncertainty, including renewed concerns over Trump-era tariffs.
If we monitor for potential reversal signals around this level, it could present a solid trading opportunity.
🎯 My targets: 0.8930; 0.8905 ; 0.8870
You may find more details in the chart!
Thank you and Good Luck!
PS: Please support with a like or comment if you find this analysis useful for your trading day
Disclosure: I am part of Trade Nation's Influencer program and receive a monthly fee for using their TradingView charts in my analysis.
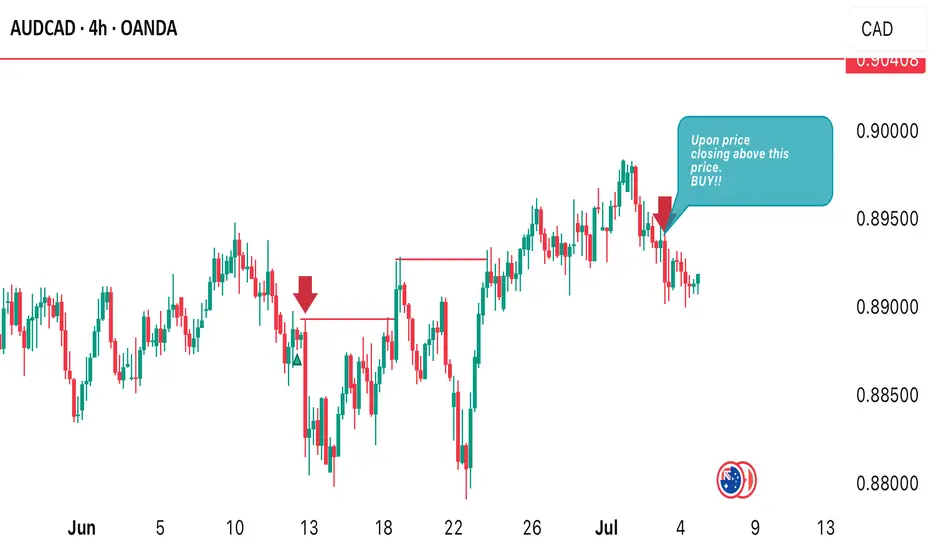
AUDCAD Trade plan: Waiting for bullish confirmation at RetestPrice broke above resistance with a momentum candle, indicating buyer control. This is our first clue that a structure shift might have occurred.
This retest is essential. Many traders make the mistake of entering too early without confirmation. But it's right here, once price touches the former resistance, that you must observe how price reacts. Look for price exhaustion or reversal candlesticks such as bullish engulfing patterns, or even inside bars.
Once rejection is confirmed, I'm looking to go long to 0.90450.
Just sharing my thoughts for the charts, this isn’t financial advice. Always confirm your setups and manage your risk properly.
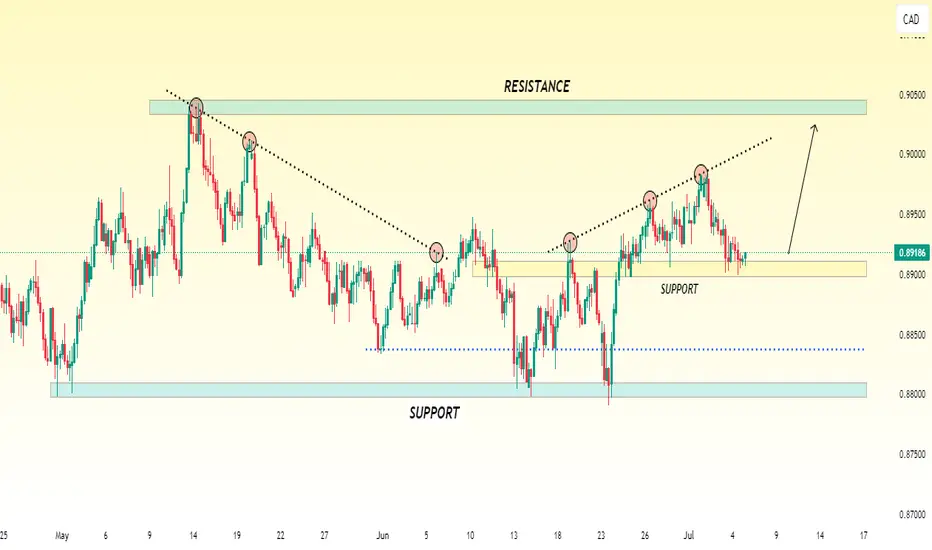
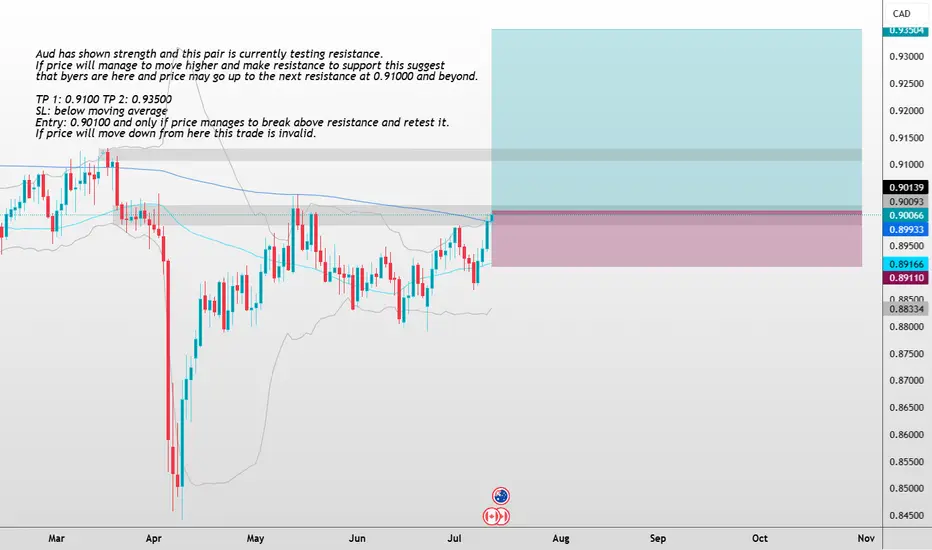
Aud/Cad LongAud has shown strength and this pair is currently testing resistance.
If price will manage to move higher and make resistance to support this suggest
that byers are here and price may go up to the next resistance at 0.91000 and beyond.
TP 1: 0.9100 TP 2: 0.93500
SL: below moving average
Entry: 0.90100 and only if price manages to break above resistance and retest it.
If price will move down from here this trade is invalid
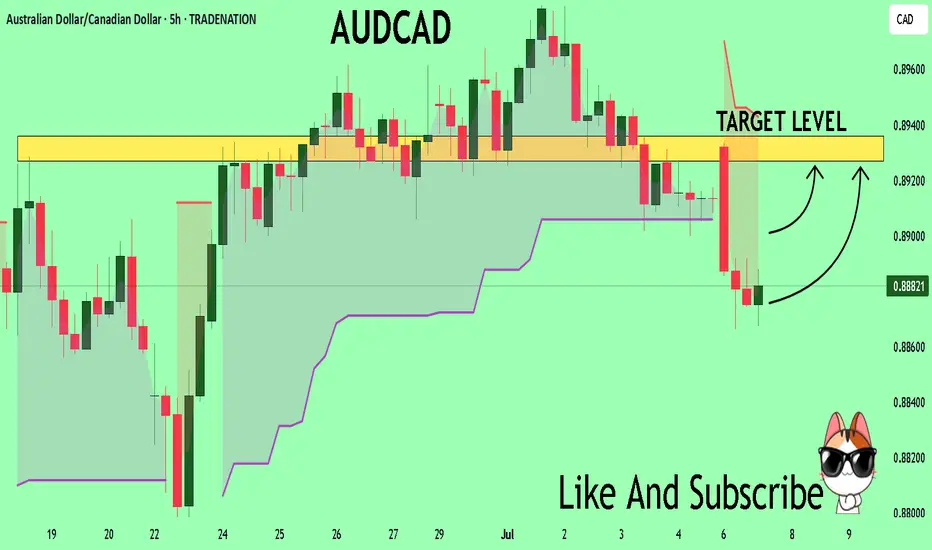
AUDCAD Trading Opportunity! BUY!
My dear subscribers,
AUDCAD looks like it will make a good move, and here are the details:
The market is trading on 0.8881 pivot level.
Bias - Bullish
Technical Indicators: Both Super Trend & Pivot HL indicate a highly probable Bullish continuation.
Target - 0.8927
About Used Indicators:
The average true range (ATR) plays an important role in 'Supertrend' as the indicator uses ATR to calculate its value. The ATR indicator signals the degree of price volatility.
Disclosure: I am part of Trade Nation's Influencer program and receive a monthly fee for using their TradingView charts in my analysis.
———————————
WISH YOU ALL LUCK
#AN020: US Tariffs, Euro Weakness, USD Strength, Forex at Risk?
1. New US Tariff Threats Against the EU and Canada
Over the weekend, President Trump announced the sending of formal letters introducing new tariffs: 35% on Canadian goods and potential tariffs for the EU as well (15-20%).
Context: The return of protectionism fuels uncertainty.
Market Impact: Shift to safe-haven currencies — the US dollar gains ground, while EUR/USD and USD/CAD remain under pressure.
2. EUR/USD Below 1.1700
The EUR/USD pair closed the week below 1.1700, failing to recover.
3. GBP/USD Loses Ground
The GBP/USD pair fell below 1.3500, hitting a three-week low.
Factors: Disappointing UK GDP data + stronger USD.
Impact: Pressure on the pound, possible continuation of the downtrend to 1.3420 unless better data emerges.
4. USD/JPY near 147.50
The dollar reached new two-week highs against the yen, hitting 147.50.
Causes: Risk flight and reduced expectations for BoJ intervention.
Outlook: If global sentiment remains adverse, USD/JPY could head towards 148.00.
5. Gold and safe-haven assets recover
Trade uncertainty is supporting gold, which has risen to near $3,360/ounce.
Outlook: Volatility and preference for the USD and JPY are increasing; gold will act as a sentinel of fear in the markets.
🔍 Summary of Impacts on Forex Markets
EUR/USD Weaker: Push toward 1.1600 due to trade concerns and USD strength
GBP/USD Down: UK data pressured + risk aversion
USD/JPY Rising: USD refuge and possible break above 148
USD/CAD Volatile: Canadian tariffs penalize CAD, but oil prices and BoC reactions to monitor
Gold & XM Gold strengthens, signaling risk, USD support; JPY and USD benefit

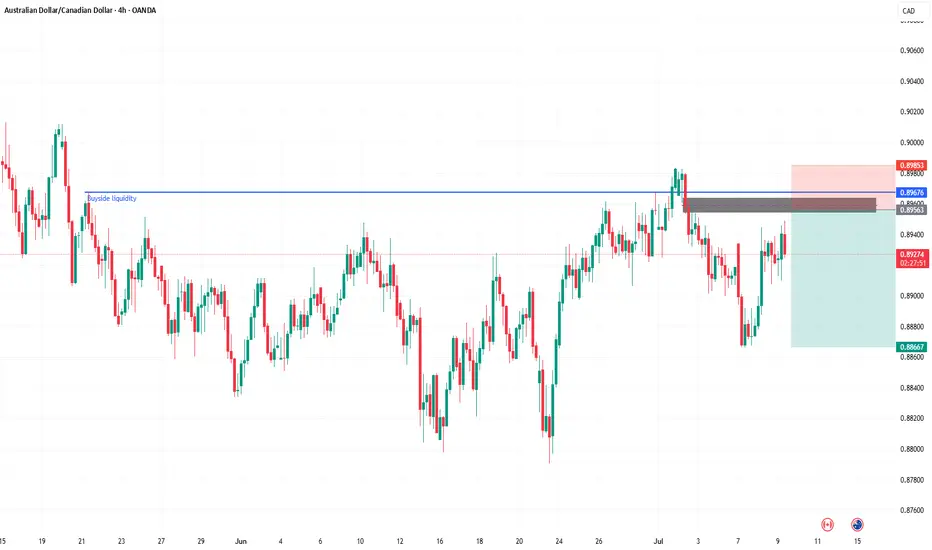
AUDCAD SHORT Potential retest of the same level as last week;
Entry at both Daily and Weekly AOi
Weekly Rejection At AOi
Previous Weekly Structure Point
Weekly EMA retest
Daily Rejection at AOi
Previous Structure point Daily
Around Psychological Level 0.89500
H4 Candlestick rejection
Levels 4.17
Entry 95%
REMEMBER : Trading is a Game Of Probability
: Manage Your Risk
: Be Patient
: Every Moment Is Unique
: Rinse, Wash, Repeat!
: Christ is King.
BUY AUDCAD now for a four hour time frame bullish trend continuBUY AUDCAD now for a four hour time frame bullish trend continuation ...............
STOP LOSS: 0.8907
This buy trade setup is based on hidden bullish divergence trend continuation trading pattern ...
Always remember, the trend is your friend, so whenever you can get a signal that the trend will continue, then good for you to be part of it
TAKE PROFIT : take profit will be when the trend comes to an end, feel from to send me a direct DM if you have any question about take profit or anything...
Remember to risk only what you are comfortable with... trading with the trend, patient and good risk management is the key to success here
Bullish ICT Entry 15 minute Entry:
1. Sell - side liquidity swept.
2. BOS up onM15 confirm shift.
3. Entry from bullish OB or FVG after pullback.
4. SL below liquidity sweep.
5. TP internal high/TP2 premium zone.
AUDCAD: Weak Market & Bearish Continuation
The recent price action on the AUDCAD pair was keeping me on the fence, however, my bias is slowly but surely changing into the bearish one and I think we will see the price go down.
Disclosure: I am part of Trade Nation's Influencer program and receive a monthly fee for using their TradingView charts in my analysis.
❤️ Please, support our work with like & comment! ❤️
07.07.25 Morning ForecastPairs on Watch -
FX:AUDCAD
FX:USDJPY
FX:EURUSD
A short overview of the instruments I am looking at for today, multi-timeframe analysis down to what I will be looking at for an entry. Enjoy!

audcad Short
We have a break of structure. we waiting for a fair value gap on lower time frame in order to sell to those zone. lets wait and see how it goes
AUDCAD profit hit Congratulations to those of us that took this
AUDCAD profit hit Congratulations to those of us that took this trade we just hit take profit now
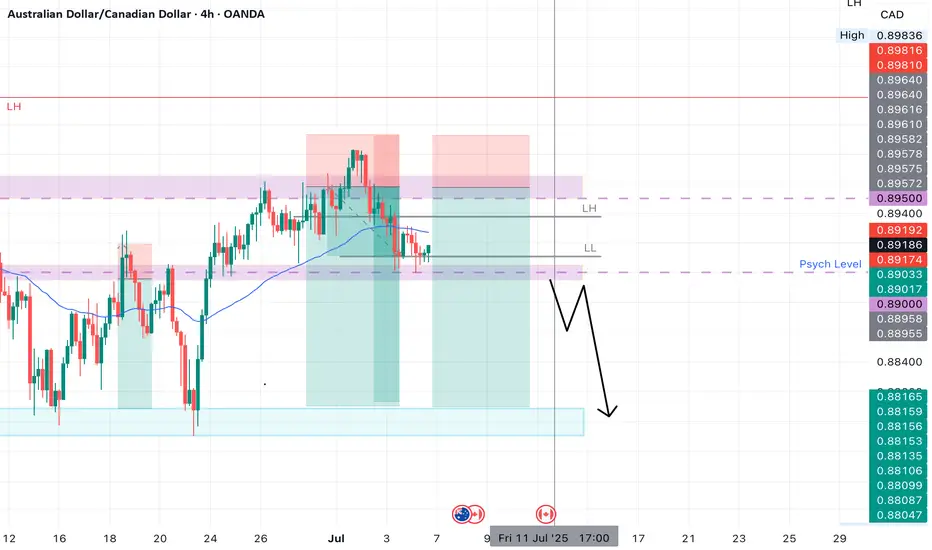
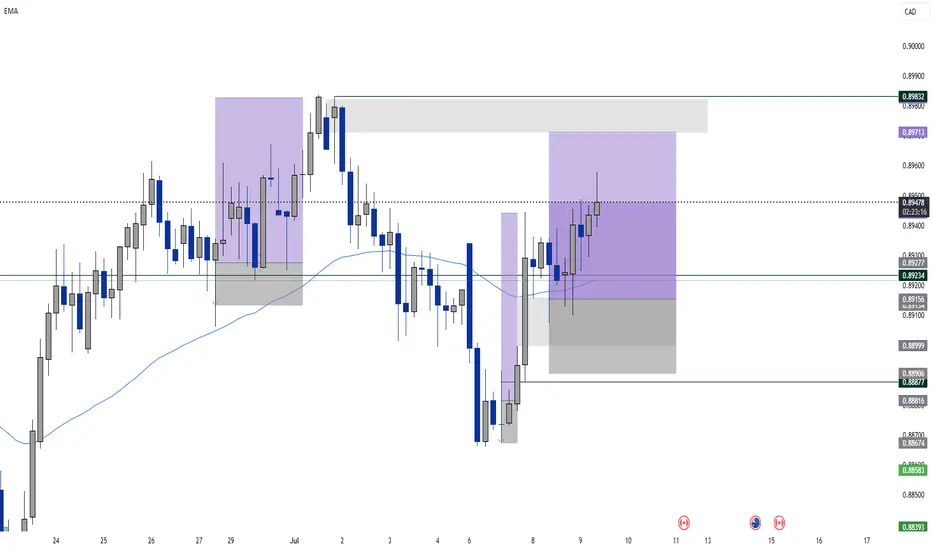
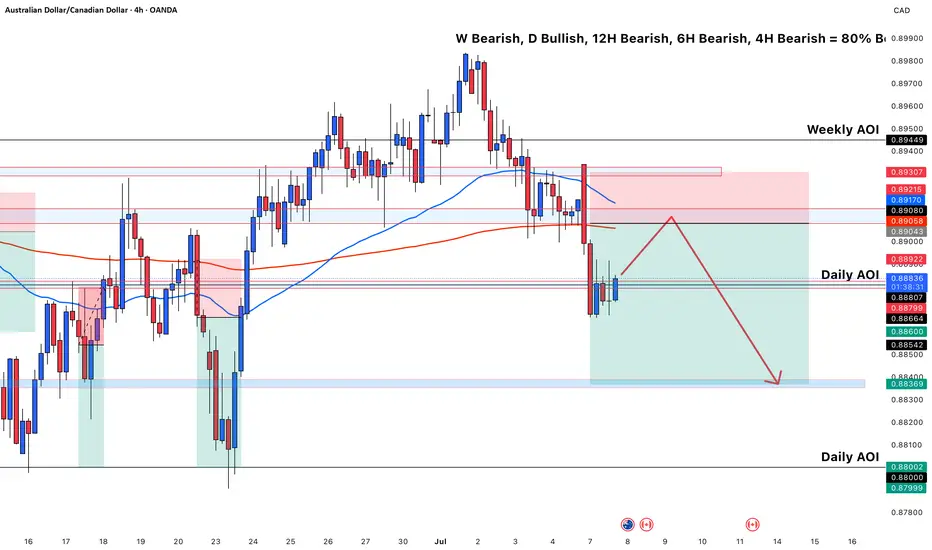
short setup on AUD/CAD🧠 Market Sentiment by Timeframe
Weekly (W): Bearish
Daily (D): Bullish
12H, 6H, 4H: Bearish
Bias: Short-term continuation to the downside after retest of supply/imbalance.
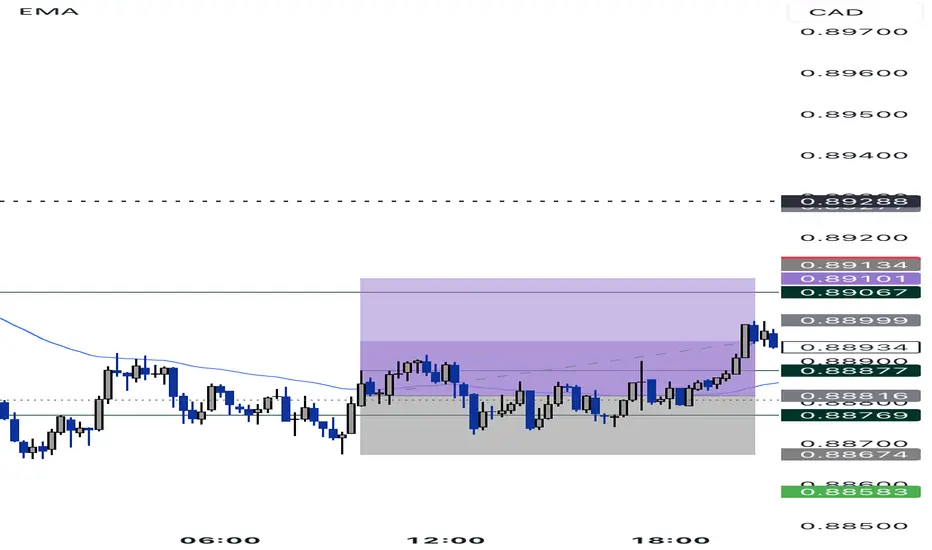
🔍 Technical Breakdown
🔴 1. Structure & Momentum
Price broke down from previous 4H support (~0.88900–0.89000) creating a lower low.
A bearish BOS confirms momentum shift.
Price is now consolidating below the 200 EMA and 50 EMA → indicating bearish pressure.
🟥 2. Weekly AOI / Supply Zone
Red box above (0.89058–0.89307) marks Weekly AOI (Supply).
It represents a strong resistance area where price previously sold off.
Expected lower high (LH) to form at the retest of this supply.
🟦 3. Trade Plan
Entry Zone: Anticipated pullback into 0.88922–0.89058 (Daily AOI + 200 EMA resistance).
Stop Loss: Above the Weekly AOI at ~0.89307.
Take Profit (TP): Toward the Daily AOI around 0.88000–0.87999, a previous demand zone.
RR: Over 2:1 potential, depending on exact entry.
🔵 4. EMA Dynamics
Price currently sits below both the 50 EMA (blue) and 200 EMA (red), confirming bearish alignment.
EMAs act as dynamic resistance zones, giving confluence to the short.
📉 Bearish Confluences
Bearish market structure on 4H, 6H, 12H.
EMA crossover and rejection.
Weekly AOI = major supply.
Daily AOI just rejected.
Anticipated lower high to form before continuation.
✅ Summary of Setup
Type: Counter-trend against Daily bullish bias, with HTF bearish confirmation.
Setup: Pullback → rejection → short continuation.
Target: Clean sweep of liquidity near 0.8800 Daily AOI.
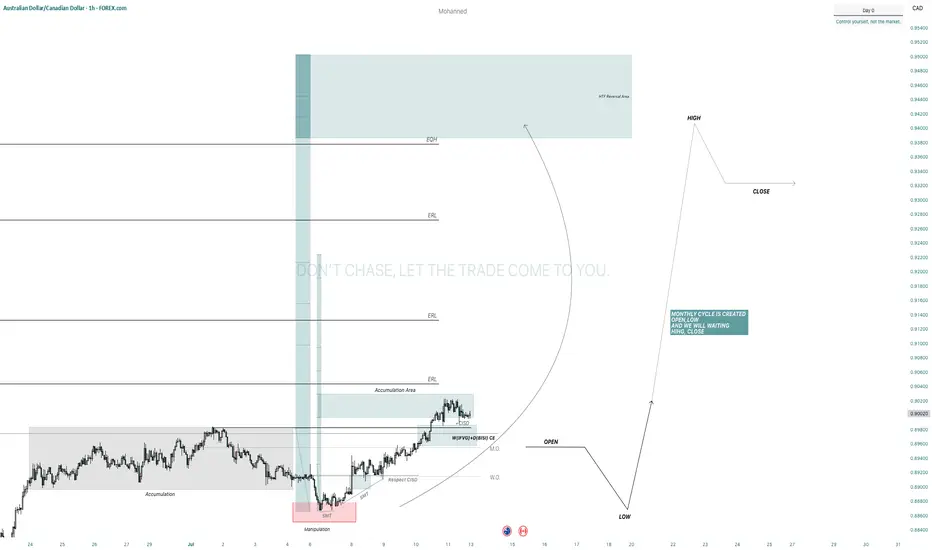
AUDCAD | Weekly Outlook | July 14, 2025🟦 AUDCAD | Weekly Outlook | ICT-Based Analysis
📅 Week Starting: July 14, 2025
🧠 "Don't chase — let the trade come to you."
🧭 Market Context (1H + HTF Alignment)
This chart outlines a clear Smart Money framework for AUDCAD using ICT principles. The market recently completed a manipulation phase below a major accumulation zone, forming a clear SMT divergence and respecting a CISD (Clean Internal Sell-side Displacement).
After manipulation and SMT confirmation, price respected the CISD and showed willingness to displace bullishly, suggesting a potential re-accumulation phase on the lower timeframes.
🔍 Key Observations
Accumulation + SMT:
We had a prolonged accumulation phase that led to a smart money manipulation (fakeout), marked by SMT divergence. This was followed by a bullish shift in structure, confirming intent.
CISD + CE Reaction:
Price respected the CISD zone and formed a bullish W reversal + OB/BI setup. This is a common ICT pattern before major expansions.
Re-Accumulation Area:
The current consolidation near ERL levels shows signs of controlled accumulation, with price respecting previous liquidity levels.
This area may act as a springboard for expansion towards HTF objectives.
📈 HTF Targeting: Reversal Area + EQH
The chart marks a High Time Frame Reversal Area (HTF) above the current price, potentially acting as a premium inefficiency or sell-side liquidity target.
EOH (Expansion Objective High) is drawn in that same region, providing a long-term magnet for price.
This aligns with the broader Monthly Cycle expectation.
🔄 Monthly Cycle Analysis
“Monthly Cycle is Created — Open, Low... Now We Wait for the High and Close.”
This suggests:
Monthly Open and Low are already formed.
A bullish monthly cycle is anticipated — meaning we're waiting for the High to form next.
Once the high is set, a retracement towards the Close level is expected by the end of the month.
This macro view gives us context for aiming long positions on pullbacks — buying dips within the re-accumulation range.
⚠️ Trader's Insight
Don’t Chase — Let the Trade Come to You.
The setup is not about chasing price. Instead, the idea is to:
Wait for price to return to favorable zones (e.g., CE of OB inside CISD)
Confirm intent with LTF SMT, FVGs, or M15 structural shifts
Target HTF inefficiencies and liquidity zones (EOH & Reversal Area)
🎯 Bias for the Week
Bullish, based on:
Monthly cycle direction (expecting HIGH)
Price behavior post-CISD respect
Clear smart money accumulation and displacement
Re-accumulation on LTFs suggesting continuation
AUDCAD 15min ICT 1:2 bullish trade 1. Daily
• Sell-side liquidity swept below previous low.
• Price bounced from a bullish order block.
• Bias: Bullish, targeting draw on liquidity above.
2. 4H
• Bullish FVG respected.
• Break of structure (BOS) to upside.
• Retracement into OB + FVG → continuation expected.
3. 1H
• Strong displacement candle.
• Price returned to 1H FVG + OB.
• MSS confirms shift in bullish momentum.
15M
• Liquidity sweep + market structure shift.
• Entry on return to OB or FVG.
• Target: Equal highs / 4HR.
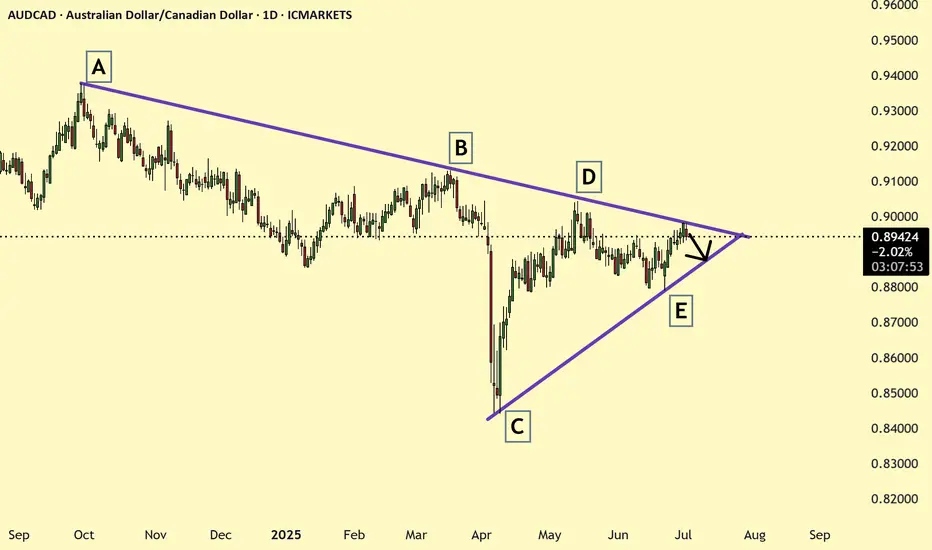
AUDCAD (Daily Timeframe) shows a symmetrical triangleAUDCAD has reached the resistance line of symmetrical upper trend line and price got rejected from here and may likely to go the support trend line. 4 hr chart makes it more clear.
AUDCAD TECHNICAL ANALYSIS TODAY! - H1 timeframe.Price recovered back to a pullback resistance of out of 0.89311 from the intraday timeframe, we are looking forward to buying AUDCAD as market trend remains bullish from the higher time frame. A buy opportunity is envisaged.

AUDCAD SHORT DAILY FORECAST Q3 D10 W28 Y25AUDCAD SHORT DAILY FORECAST Q3 D10 W28 Y25
Professional Risk Managers👋
Welcome back to another FRGNT chart update📈
Diving into some Forex setups using predominantly higher time frame order blocks alongside confirmation breaks of structure.
Let’s see what price action is telling us today! 👀
💡Here are some trade confluences📝
✅Daily Order block identified
✅4H Order Block identified
✅1H Order Block identified
🔑 Remember, to participate in trading comes always with a degree of risk, therefore as professional risk managers it remains vital that we stick to our risk management plan as well as our trading strategies.
📈The rest, we leave to the balance of probabilities.
💡Fail to plan. Plan to fail.
🏆It has always been that simple.
❤️Good luck with your trading journey, I shall see you at the very top.
🎯Trade consistent, FRGNT X

AUDCAD INTRADAY TIMEFRAME IS QUITE BULLISHPrice has completely shifted from intraday bearish to bullish. I anticipate more. Bullish price action to develop in later days of coming week. I am positioning myself for a buy opportunity. Once I see price close above 0.89413 I’m going long!
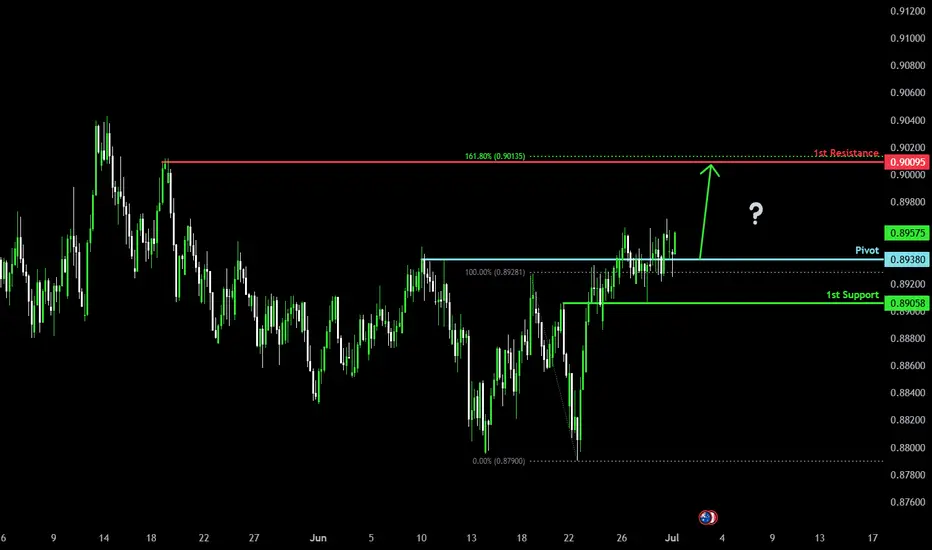
Bullish momentum to extend?AUD/CAD has bounced off the pivot and could potentially rise to the 1st resistance which lines up with the 161.8% Fibonacci extension.
Pivot: 0.8938
1st Support: 0.8905
1st Resistance: 0.9009
Risk Warning:
Trading Forex and CFDs carries a high level of risk to your capital and you should only trade with money you can afford to lose. Trading Forex and CFDs may not be suitable for all investors, so please ensure that you fully understand the risks involved and seek independent advice if necessary.
Disclaimer:
The above opinions given constitute general market commentary, and do not constitute the opinion or advice of IC Markets or any form of personal or investment advice.
Any opinions, news, research, analyses, prices, other information, or links to third-party sites contained on this website are provided on an "as-is" basis, are intended only to be informative, is not an advice nor a recommendation, nor research, or a record of our trading prices, or an offer of, or solicitation for a transaction in any financial instrument and thus should not be treated as such. The information provided does not involve any specific investment objectives, financial situation and needs of any specific person who may receive it. Please be aware, that past performance is not a reliable indicator of future performance and/or results. Past Performance or Forward-looking scenarios based upon the reasonable beliefs of the third-party provider are not a guarantee of future performance. Actual results may differ materially from those anticipated in forward-looking or past performance statements. IC Markets makes no representation or warranty and assumes no liability as to the accuracy or completeness of the information provided, nor any loss arising from any investment based on a recommendation, forecast or any information supplied by any third-party.
AUDCAD Holding at Support – Possible Move UpAUDCAD seems to be sitting on a strong support level. From this point, I think the price could start moving up. If buyers come in, we might see the market go higher in the next few days.