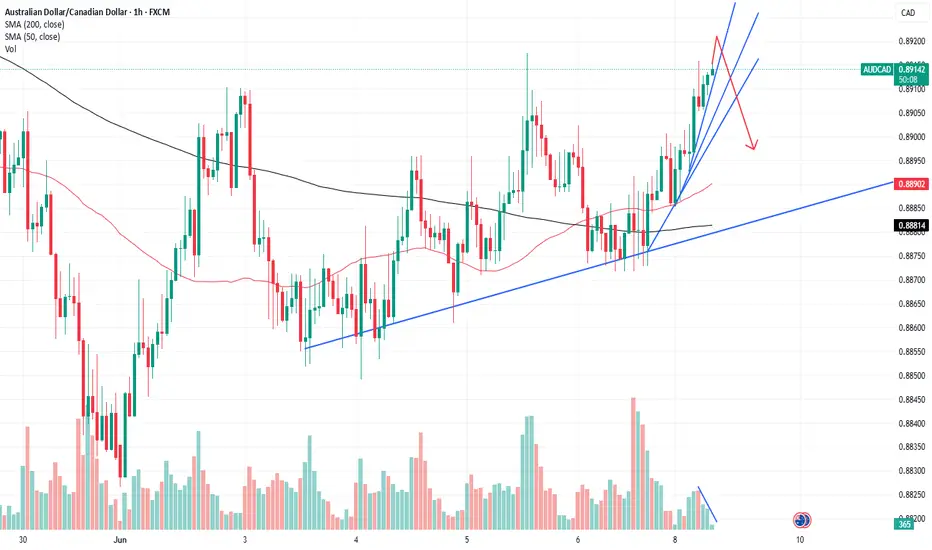
AUDCADRange Breakout: The pair has been trading within a range, and the breakout from this range signals potential bullish momentum. A breakout indicates that the price is ready to move out of its consolidation phase, with buyers now in control.
Trendline Breakout: The price breaking above a key trendline further confirms a shift from a bearish or neutral market sentiment to a more bullish one. This is a strong signal that upward momentum is building.
AUDCAX trade ideas

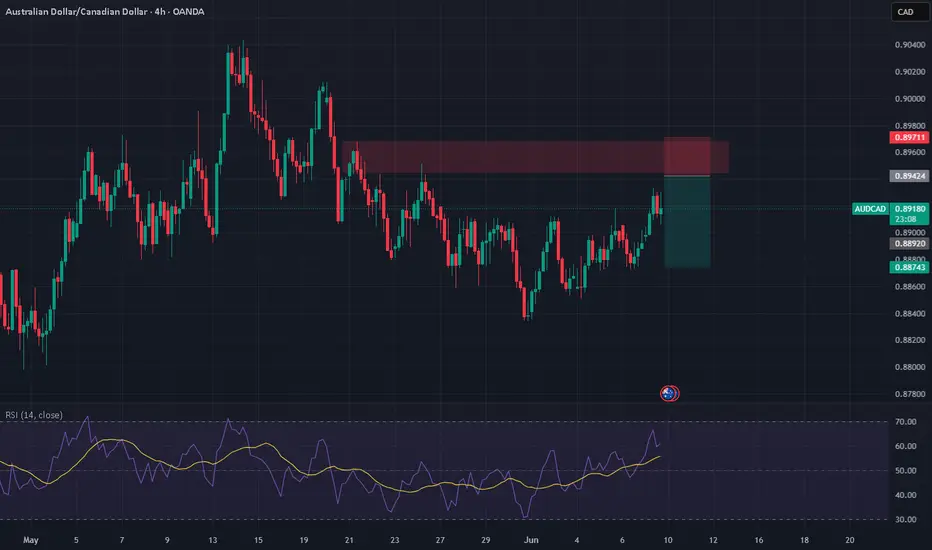
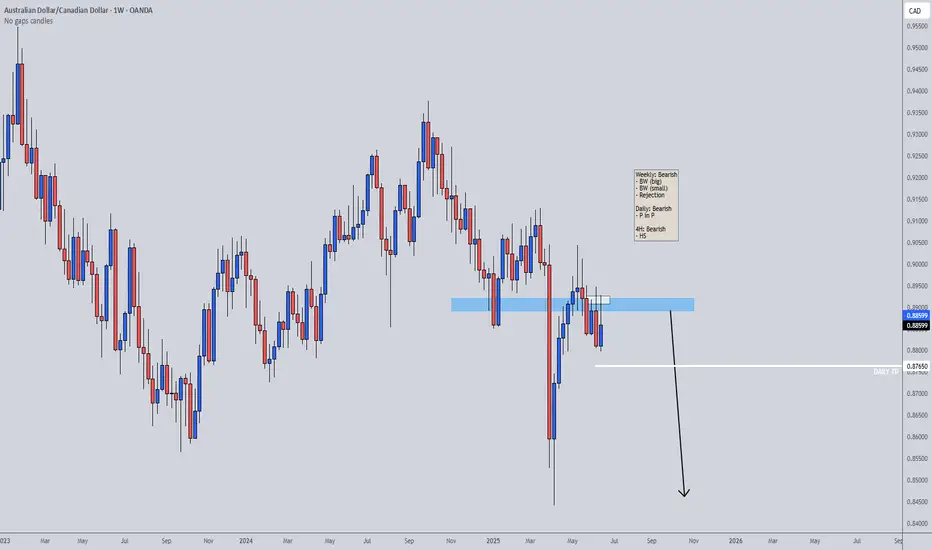
AUDCAD - Fundamentals vs Momentum – Betting on CAD🕓 Timeframe: 4H | ⚠️ Bias: Bearish From Supply Zone
AUDCAD is rejecting the 0.8940–0.8960 supply zone, a key resistance that's been respected multiple times. With RSI turning over near overbought and CAD fundamentals improving, this looks like a clean short opportunity.
📊 Technical Confluence
🔴 Resistance Zone: 0.8940–0.8960 (historical supply zone)
📉 Bearish Structure Intact: Still in a broader HTF downtrend (lower highs)
⚠️ RSI Divergence: Slowing near 62, suggesting momentum exhaustion
🕯️ Price Action: Current candle showing indecision – early signs of rejection
🌍 Fundamental Confluence
🇦🇺 AUD Weakness:
RBA paused rates, inflation easing → Dovish
AUD overextended after sentiment shift (conditional score ↑ too fast)
AUD vulnerable if sentiment shifts risk-off
🇨🇦 CAD Strength:
BoC holding firm on rates, hawkish tone
Oil production recovering → CAD-positive
COT net long position + seasonal strength
🎯 Trade Plan
📍 Entry: 0.8940–0.8955 (on bearish confirmation: engulfing/pin bar)
🛑 Stop Loss: 0.8975 (above resistance zone)
🎯 Take Profit 1: 0.8870 (mid-range)
🎯 Take Profit 2: 0.8830 (into demand zone)
⏱️ Optional: Partial entry now, scale in at 0.8960 if tapped
🧠 “Don’t chase the move. Sell the retest when momentum fades and fundamentals align.”
audcad buy tradeThe Relative Strength Index (RSI) is showing an upward trend, indicating increasing momentum. Additionally, the Moving Average Convergence Divergence (MACD) is showing a bullish crossover, further supporting the potential for an upward move.
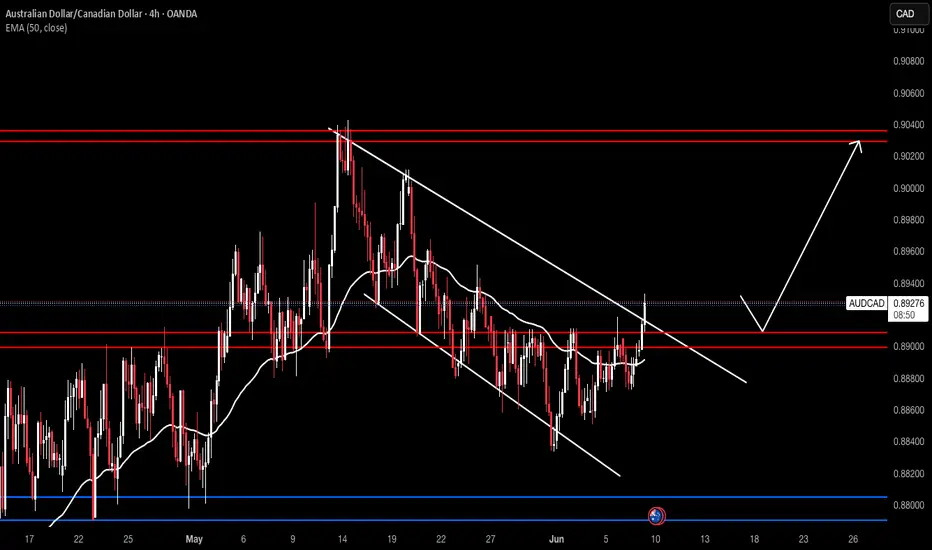
AUDCAD SIMPLE TRENDLINE BREAK & RETEST!I just identified a simple trendline break and retest in H4 timeframe. In this trading strategy, it’s advisable to long AUDCAD as this will increase the probability of this asset making more bullish move. Therefore, a buy opportunity is envisaged from the current market price. Target is 0.9012

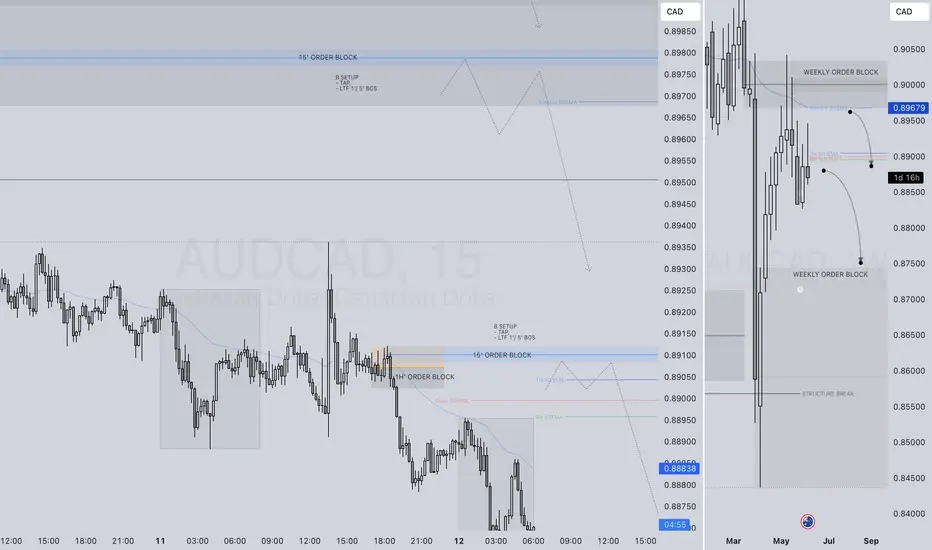
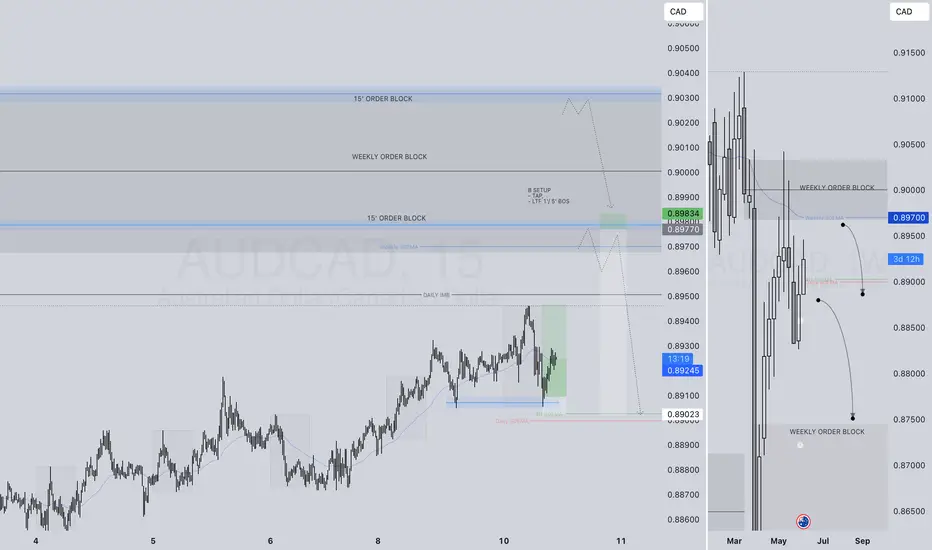
AUDCAD SHORT FORECAST Q2 W24 D12 Y25AUDCAD SHORT FORECAST Q2 W24 D12 Y25
Professional Risk Managers👋
Welcome back to another FRGNT chart update📈
Diving into some Forex setups using predominantly higher time frame order blocks alongside intraday confirmation breaks of structure.
💡Here are some trade confluences📝
✅Weekly 50 EMA
✅Weekly order block rejection
✅Daily order block rejection
✅15’ order block identification
🔑 Remember, to participate in trading comes always with a degree of risk, therefore as professional risk managers it remains vital that we stick to our risk management plan as well as our trading strategies.
📈The rest, we leave to the balance of probabilities.
💡Fail to plan. Plan to fail.
🏆It has always been that simple.
❤️Good luck with your trading journey, I shall see you at the very top.
🎯Trade consistent, FRGNT X
AUDCADHead and shoulders sell setup nothing else to say but a risk free sell. i doubt it will pull back up at all before the the setup plays out
short audcad*The content on this analysis is subject to change at any time without notice, and is provided for the sole purpose of assisting traders to make independent investment decisions.

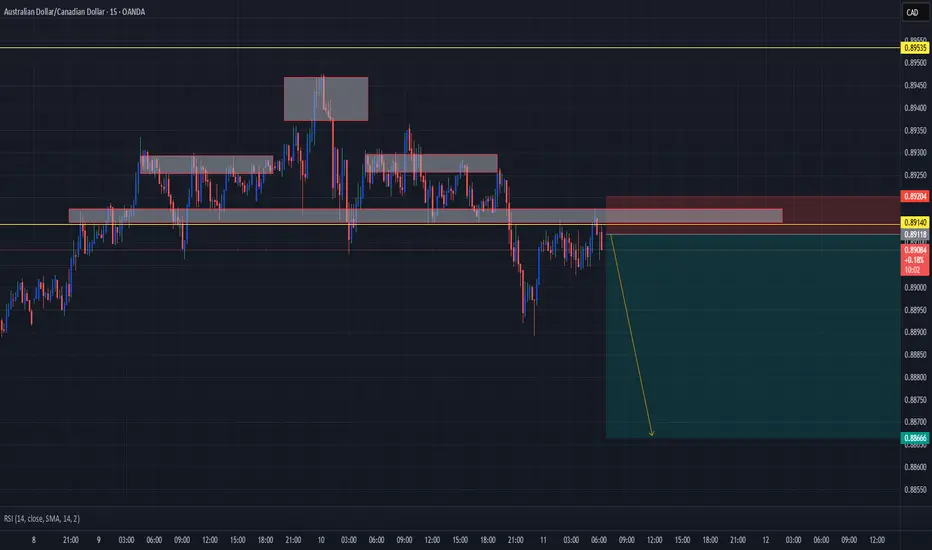
AUDCAD SHORT FORECAST Q2 W24 D10 Y25AUDCAD SHORT FORECAST Q2 W24 D10 Y25
Professional Risk Managers👋
Welcome back to another FRGNT chart update📈
Diving into some Forex setups using predominantly higher time frame order blocks alongside intraday confirmation breaks of structure.
💡Here are some trade confluences📝
✅Weekly 50 EMA
✅Weekly order block rejection
✅Daily order block rejection
✅15’ order block identification
🔑 Remember, to participate in trading comes always with a degree of risk, therefore as professional risk managers it remains vital that we stick to our risk management plan as well as our trading strategies.
📈The rest, we leave to the balance of probabilities.
💡Fail to plan. Plan to fail.
🏆It has always been that simple.
❤️Good luck with your trading journey, I shall see you at the very top.
🎯Trade consistent, FRGNT X
AUDCADAUDCAD - gunna reveal my strategy very soon for completely free. Do many donuts in this industry it’s crazy!!
AUDCAD Buys ContinuePrice has finally broken out of the H4 resistance. Waiting on retest to continue the buys. Also have a bullish flag pattern that formed.
AUDCAD: A LONG TRADE OPPORTUNITY PEPPERSTONE:AUDCAD I'll be looking for buys from the 0.88486 price level.

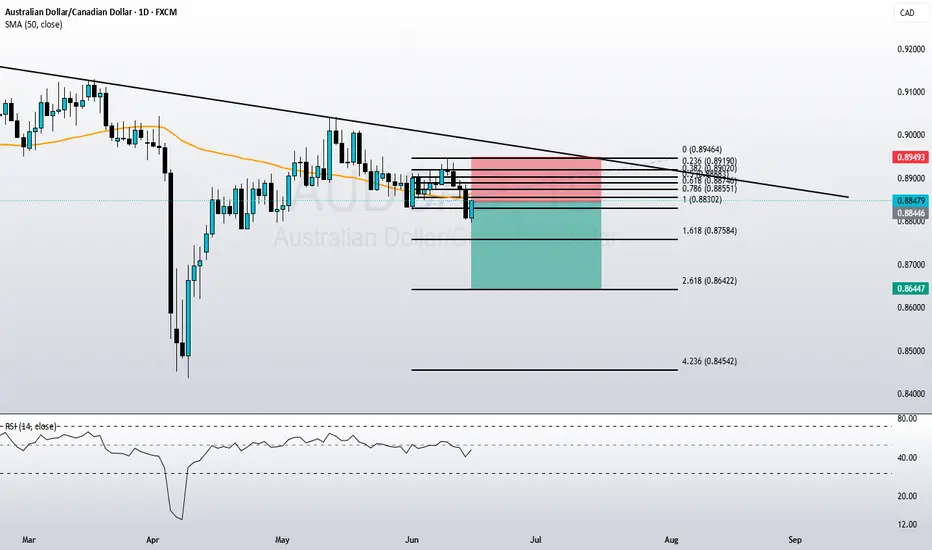
AUDCAD shortSwing Trade Idea – AUD/CAD
The price is currently trading below the 50-day moving average, indicating bearish momentum. Recently, a strong bearish candle broke the previous market structure, confirming downside pressure. Based on this, I expect the price to move lower towards the target area, which aligns with the 261.8% Fibonacci extension level.
POSSIBLE SELL OPPORTUNITY ON AUDCADAUDCAD has been trending down confirmed by a 1-2-3 pattern. We see a ideal supply level formed here where we can take a sell trade!

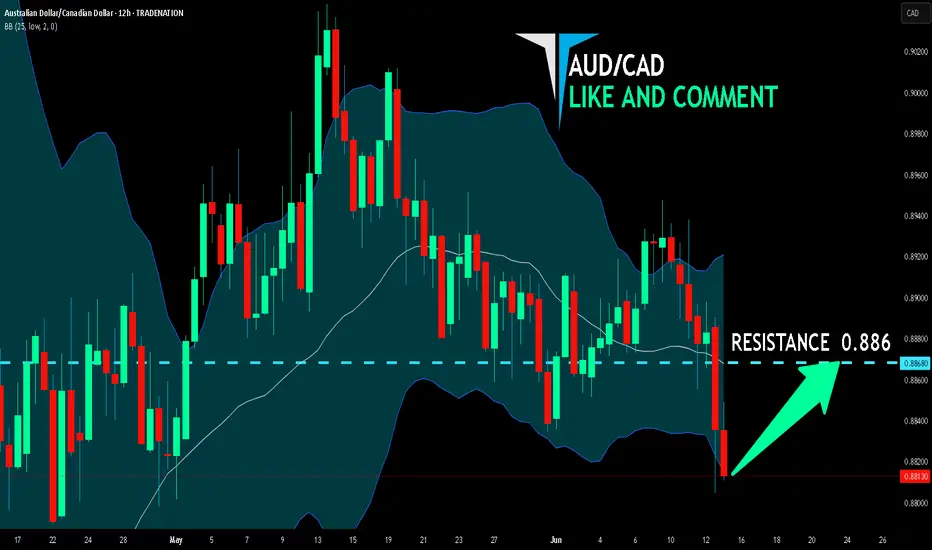
AUD/CAD BEST PLACE TO BUY FROM|LONG
Hello, Friends!
AUD-CAD downtrend evident from the last 1W red candle makes longs trades more risky, but the current set-up targeting 0.886 area still presents a good opportunity for us to buy the pair because the support line is nearby and the BB lower band is close which indicates the oversold state of the AUD/CAD pair.
Disclosure: I am part of Trade Nation's Influencer program and receive a monthly fee for using their TradingView charts in my analysis.
✅LIKE AND COMMENT MY IDEAS✅
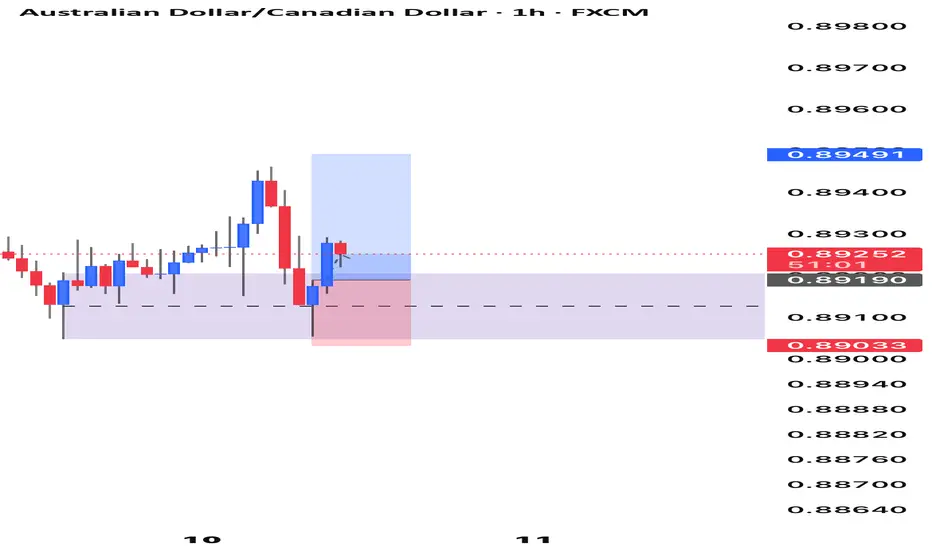
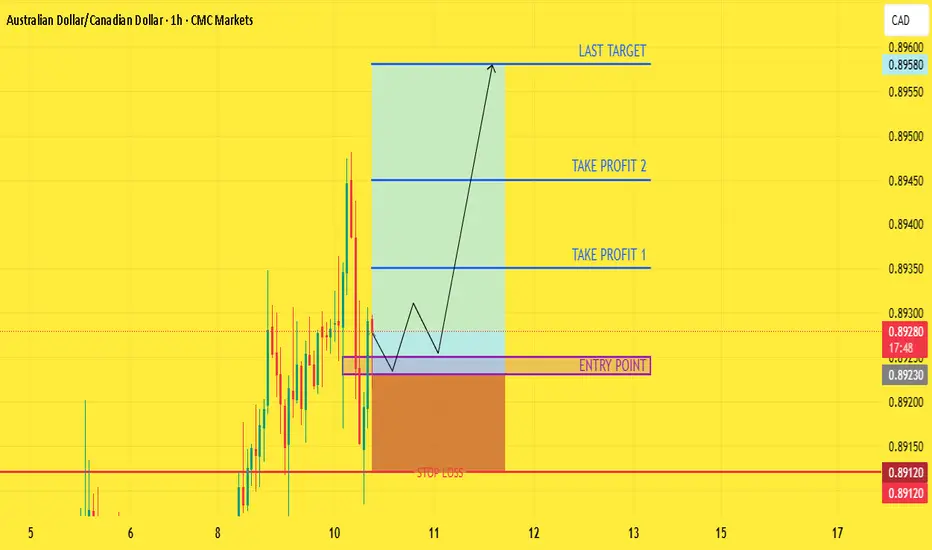
CHECK AUDUSD SIGNAL READ CAPTAIN(AUDCAD) trading signals technical analysis satup👇🏼
( AUDCAD ) BUY zone
( TRADE SATUP)
ENTRY POINT (0.89250 to (0.89230) 📊
FIRST TP (0.89350)📊
2ND TARGET (0.89450) 📊
LAST TARGET (0.89580) 📊
STOP LOOS (0.89120)❌
Tachincal analysis satup
Fallow risk management

AUDCAD - Parabolic Exhaustion, Volume DivergenceAUDCAD is appearing to want to test the previous pivot high on low volume.
If there is no new volume and a failed test of this previous high, it could signal a bearish retracement.
Be patient as a successful retest could signal a continuation of the bullish activity.
These 5 Steps Will Show You How To Short SellBased on the weekly chart this forex pair
is going down.
I was trying to learn how to buy gold and silver.
So i thought i try to trade it on
the weekly chart.Even though on this chart OANDA:AUDCAD
the daily chart for this forex pair looks
like its in an over sold zone.But if you flip
this chart to a weekly chart
you will see an over bought zone.
The overbought zone will appear on
the William.If i had the full professional
tradingview membership
I would have shown you 2 time frames back to back.
This would have been on a split chart layout.
But since i only have a free version i can
only show you how a bearish divergence looks
On the daily chart.If i had the professional membership
i would have shown you 2 layouts.
So what you need to do is the following:
1-Open the layout.
2-Put daily chart on left
3-Put weekly chart on right
4-Use the rocket booster strategy
5-Use the william% indicator
Have you notice the bearish divergence?
its overbought on the week
and the oversold
on the day chart
This is a powerful strategy and my hope is
that it will serve you well.
Rocket boost this content to learn more
Disclaimer: Trading is risky please do not use margin
and learn risk management and profit taking strategies.
Also use a simulation account before you trade with real money.

AUDCADThe 10-year bond yield differential between Australia and Canada currently stands at 1.15% (4.53% vs. 3.38%) as of May 21, 2025 . This gap significantly influences the AUD/CAD exchange rate through interest rate parity dynamics and market positioning.
Key Analysis
Yield Spread Impact
Theoretical Basis: Uncovered Interest Rate Parity (UIP) suggests the AUD should depreciate by 1.15% annually to offset its yield advantage. However, historical patterns show yield spreads often drive currency appreciation for the higher-yielding currency due to carry trades .
Current Reality: Australia’s yield premium supports AUD demand, but recent RBA rate cuts (to 3.85%) and weak GDP growth (+0.2% Q1 2025) counterbalance this effect .
Diverging Central Bank Policies
Australia: Rate cuts signal dovishness despite elevated yields, creating a "lower-for-longer" perception.
Canada: Steady rates (2.75%) and oil-price resilience (WTI ~$64.75) bolster CAD stability .
Market Behavior
Carry Trade Dynamics: A 1.15% spread historically correlates with AUD/CAD appreciation
Risk Factors: Australia’s economic stagnation and China-linked commodity exposure introduce downside risks, potentially weakening AUD despite yield advantages.
AUD/CAD Outlook
Factor AUD Impact CAD Impact
Yield Spread Bullish Bearish
Growth Outlook Bearish Neutral
Commodity Prices Mixed (Iron Ore) Bullish (Oil)
While the yield spread nominally favors AUD, conflicting fundamentals suggest limited upside. Traders should monitor:
RBA/BoC policy shifts (next meetings in July 2025)Australia's rate cut cycle vs. Canada's neutral stance creates bearish AUD bias
Iron ore vs. oil price trends
China’s economic data (critical for AUD demand)AUD's sensitivity to China growth vs. CAD's US trade links
Global Risk Sentiment
In the short term, AUD/CAD may test resistance , but sustained breaks require stronger Australian growth or hawkish RBA signals .
#AUDCAD

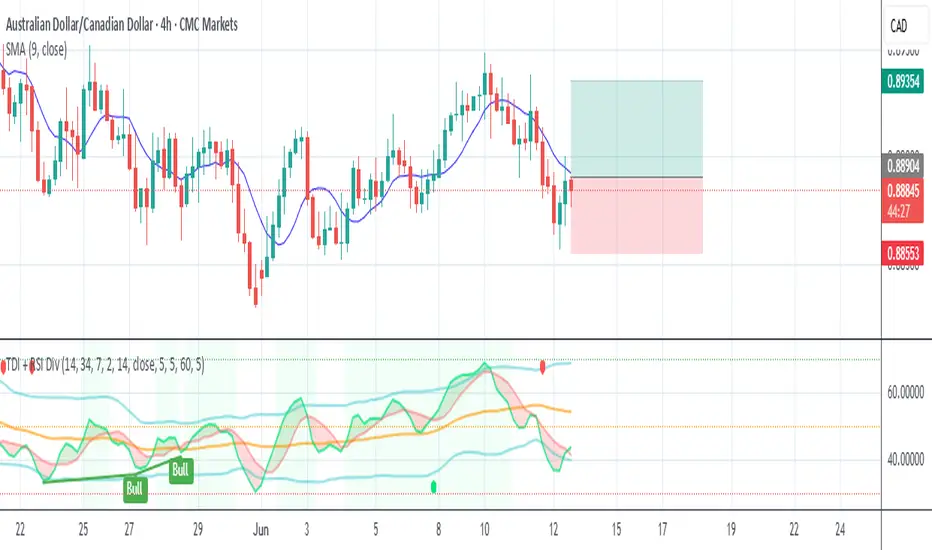
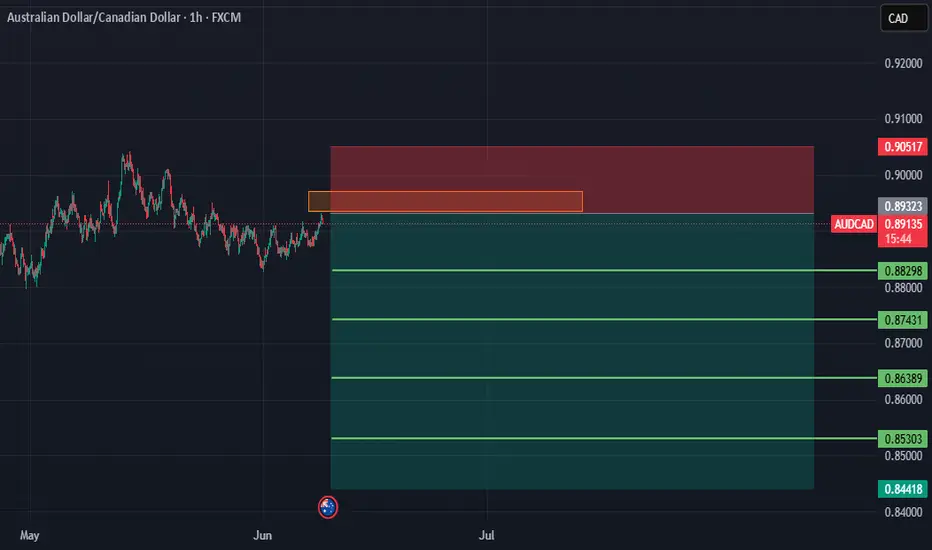
AUDCAD 1H Short 📕 Smart Money Trade Breakdown
🔻 AUDCAD 1H Short Setup
This is a short position on AUDCAD, entered at 0.88940, after price tapped into a bearish FVG (Fair Value Gap) and failed to break above the internal BOS.
📉 Entry: 0.88940
🎯 Take Profit: 0.88190
🛡️ Stop Loss: 0.89191
⚖️ Risk-Reward Ratio: ~1:3
🔍 Key Confluences:
Price tapped into FVG supply zone
Strong internal BOS confirms bearish intent
Clean trendline and liquidity sweep just before entry
Price rejecting lower high structure
This setup leverages institutional concepts like FVG + BOS rejection with proper RR alignment.
⚠️ Disclaimer: For educational purposes only. Trade with a clear risk management plan.

Price action Audcad hide it's liquidity sweep well took sometime to spot in on a 1hrs chart as clear as day light
