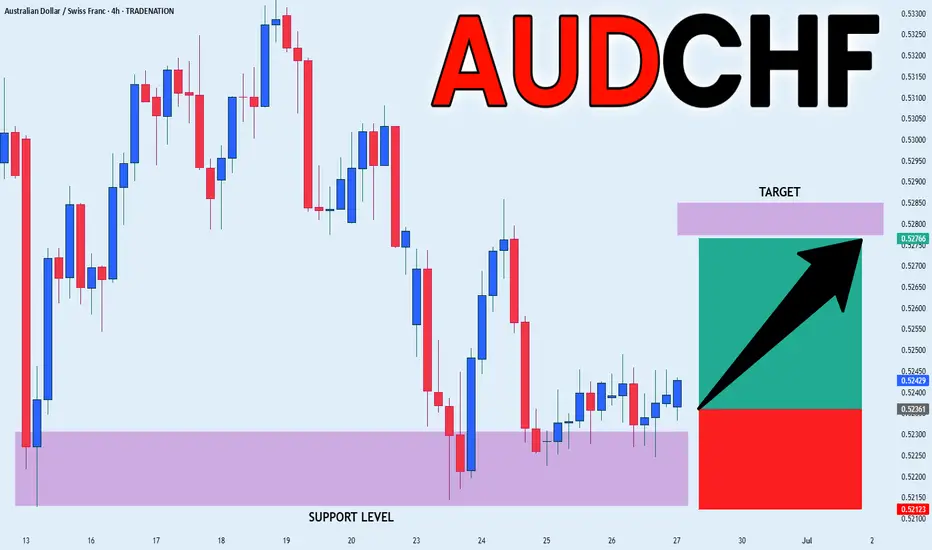
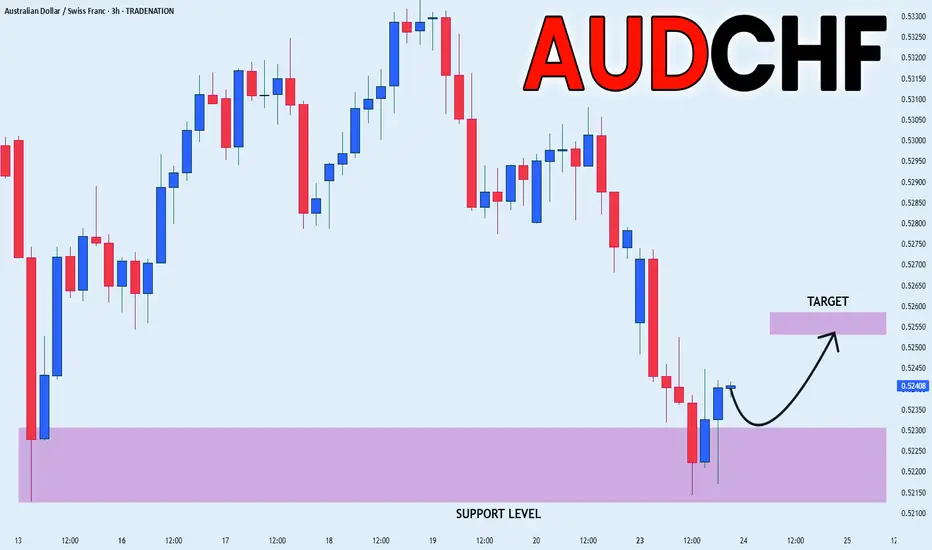
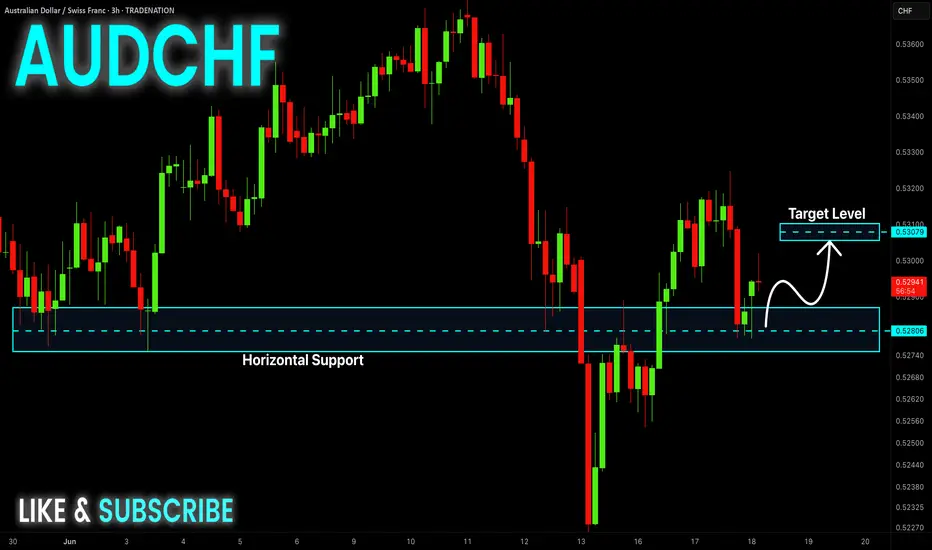
AUD_CHF LONG SIGNAL|
✅AUD_CHF was trading in a
Strong downtrend but then
Has reached a strong horizontal
Demand area around 0.5215
And failed to break the level
Which means that the bearish
Impulse might be absorbed
And we will finally see a
Bullish move up so we can
Enter a long trade with the
TP of 0.5276 and the SL of 0.5212
LONG🚀
✅Like and subscribe to never miss a new idea!✅
Disclosure: I am part of Trade Nation's Influencer program and receive a monthly fee for using their TradingView charts in my analysis.
AUDCHF trade ideas
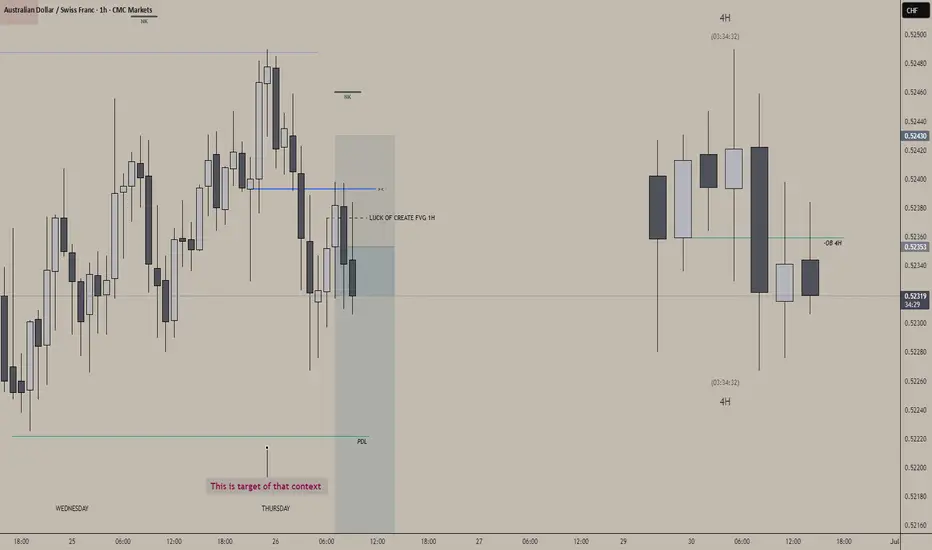
Short on AUDCHFBack to the last open day and shift lower
In 4H Create 4H -OB, that was my PDA
Wait , no tee Luck of create FVG to upside then after start respecting PDA on 15MIN i engage
AUDCHF Long opportunity in the Bearish TrendAUDCHF downtrend in a big picture. We expect 4H retracement soon.
AUDCHF at Make-or-Break Zone: Smart Money Reversal or Breakdown?1. Price Action
Price is currently trading within a descending channel, with 0.5244 hovering near a key demand zone (0.5150–0.5200), where a first bullish reaction has already occurred.
The structure suggests a potential fake breakdown, with room for a rebound toward static resistances at 0.5330, and possibly 0.5450.
RSI is rising from oversold, showing signs of a potential bullish divergence.
📌 Technical bias: Waiting for confirmation of a reversal at key support.
Upside targets: 0.5330 > 0.5450.
Ideal stop-loss below 0.5160.
2. Retail Sentiment
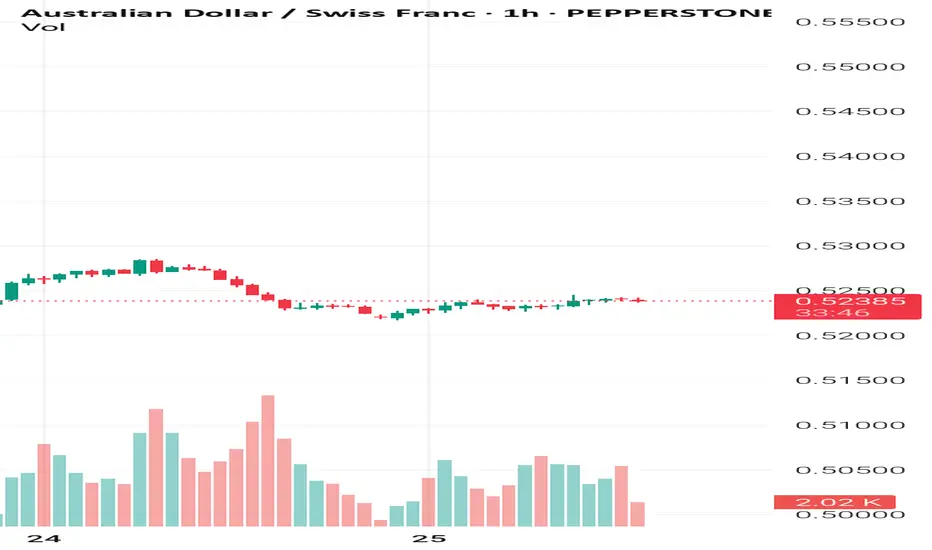
72% of retail traders are long, with an average entry at 0.5551, now facing a 300+ pip drawdown.
This increases short-term contrarian bearish pressure, but also signals liquidity above the highs, which could be targeted before a true bullish reversal.
3. Commitment of Traders (as of June 17, 2025)
AUD – Bearish
Massive drop in both commercial longs (-60k) and shorts (-60k) suggests broad disengagement.
Non-commercials remain net short (-69k), with overall open interest declining.
CHF – Neutral to Bullish
CHF also sees declines in positioning, but commercial traders remain firmly net long (+51.7k).
Non-commercials are net short (-25.5k).
📌 COT Conclusion: AUD remains structurally weaker than CHF, but both currencies are showing signs of positioning uncertainty. This compression phase may precede a technical rebound on AUDCHF.
4. Seasonality
AUD
June historically shows modest strength on 10Y and 5Y averages.
However, 2Y data points to weakness → any rally may be short-lived or fragile.
CHF
CHF tends to be strong in June, especially on 20Y and 10Y views.
Yet, short-term (2Y) data shows end-of-month weakness, suggesting possible profit-taking ahead.
✅ Operational Outlook
Short-term bias: Long AUDCHF (corrective rebound)
Medium/long-term bias: Bearish (still in a downtrend)
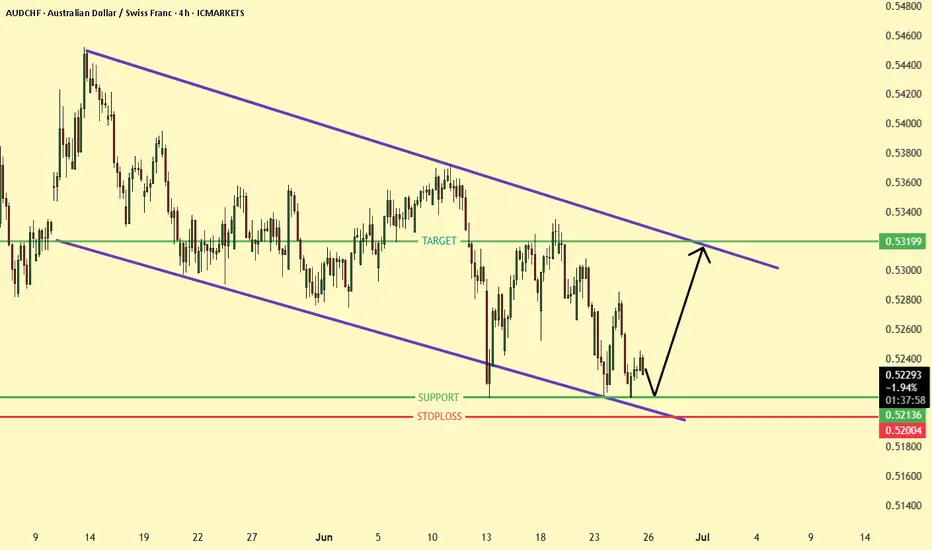
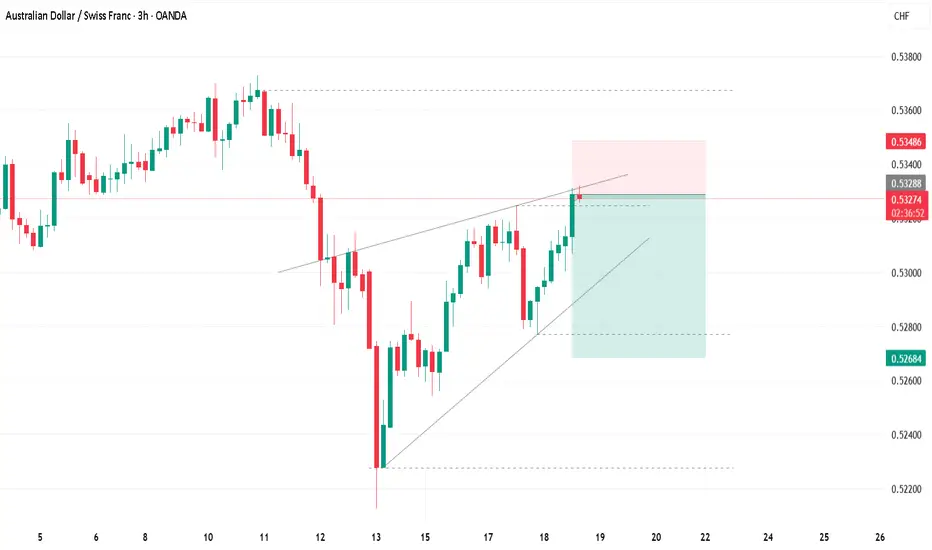
AUD/CHF Falling Channel Reversal SetupThe AUD/CHF 4H chart shows a well-defined descending channel with current price action rebounding from the lower boundary near the 0.52136 support. A bullish reversal is expected toward the upper trendline near the 0.53199 target. The setup suggests a potential buy opportunity with a stop loss at 0.52004, aiming for a short-term bullish move within the channel.
AUD CHF long ideaWith the markets Middle East and tariff concerns put to one side for time being, a risk on trade currently seems viable. The positive mood is backed up by FED board members turning dovish.
This could be classed as either a 'risk on' or '4hr support and resistance' trade simply a 'risk on' trade.
The risk to the trade is negative sentiment. Chair Powell is speaking again today, but I can't envision he will say anything out of the ordinary compared to yesterday. Another risk is that I may look back and a different pair may have been a better option to trade, but I feel CHF strength is overdone considering the growingly positive environment.
AUDCHF ShortAUD/CHF is now net short on the regression break.
The roll short is terrible. I will not take this trade.

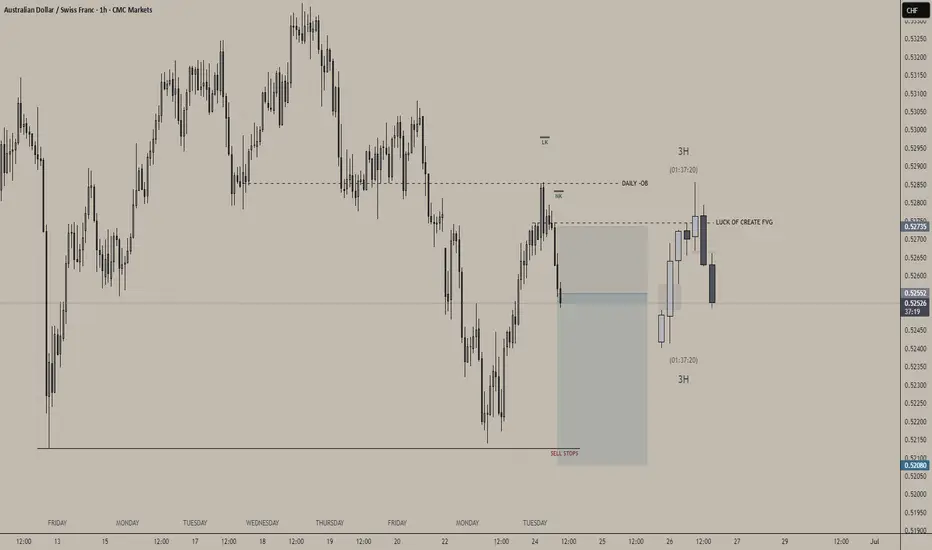
AUDCHF SHORTFROM DAILY -OB to > EQL
engage in daily -OB in N-Y shift down in 1H I SEE start create FVG
i engage directly SL above BAG
target 2RR
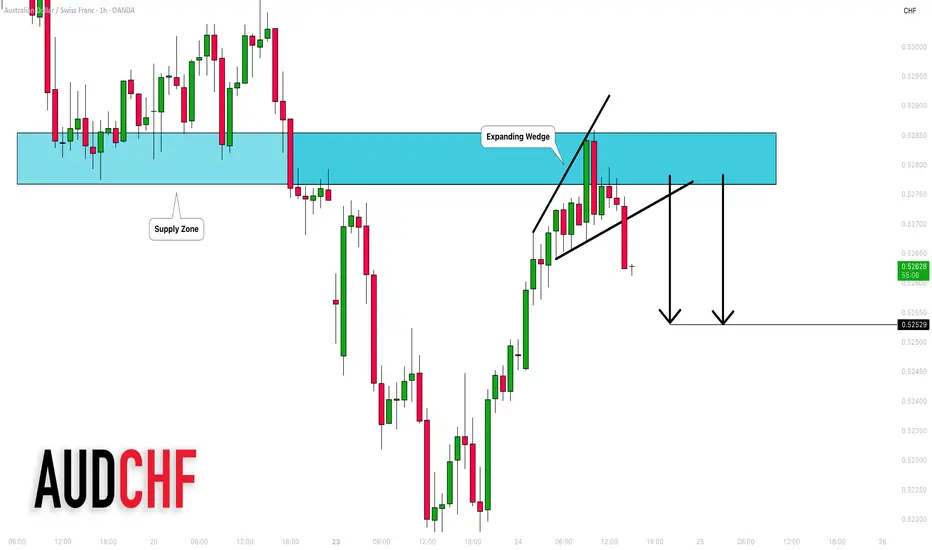
AUDCHF: Bearish Move From Resistance Confirmed?! 🇦🇺🇨🇭
AUDCHF may drop from the underlined blue supply zone,
following a bearish breakout of a support line of an expanding
wedge pattern on an hourly time frame.
Goal - 0.5253
❤️Please, support my work with like, thank you!❤️
AUD_CHF POTENTIAL LONG|
✅AUD_CHF fell down sharply
But a strong support level was hit at 0.5214
Thus as a rebound is already happening
A move up towards the target of 0.5255 shall follow
LONG🚀
✅Like and subscribe to never miss a new idea!✅
Disclosure: I am part of Trade Nation's Influencer program and receive a monthly fee for using their TradingView charts in my analysis.
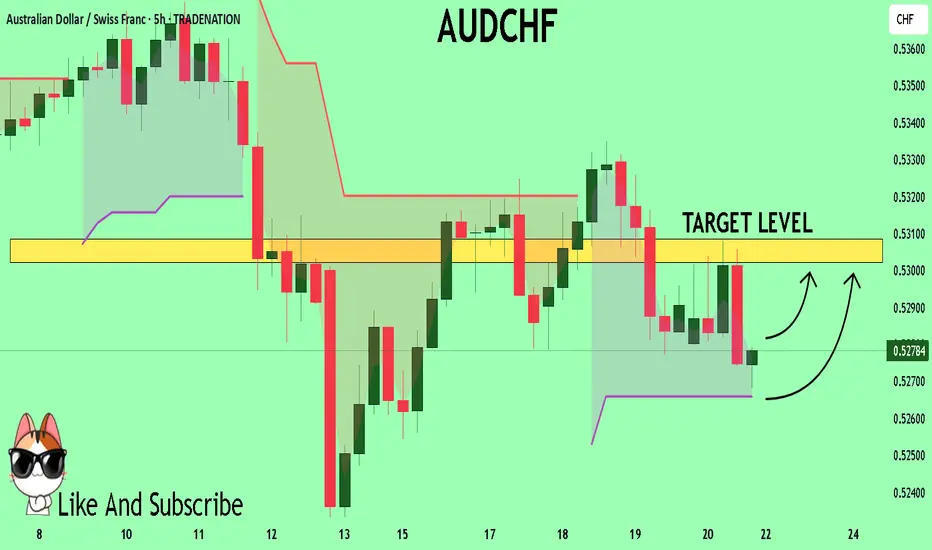
AUDCHF: Growth & Bullish Forecast
Looking at the chart of AUDCHF right now we are seeing some interesting price action on the lower timeframes. Thus a local move up seems to be quite likely.
Disclosure: I am part of Trade Nation's Influencer program and receive a monthly fee for using their TradingView charts in my analysis.
❤️ Please, support our work with like & comment! ❤️
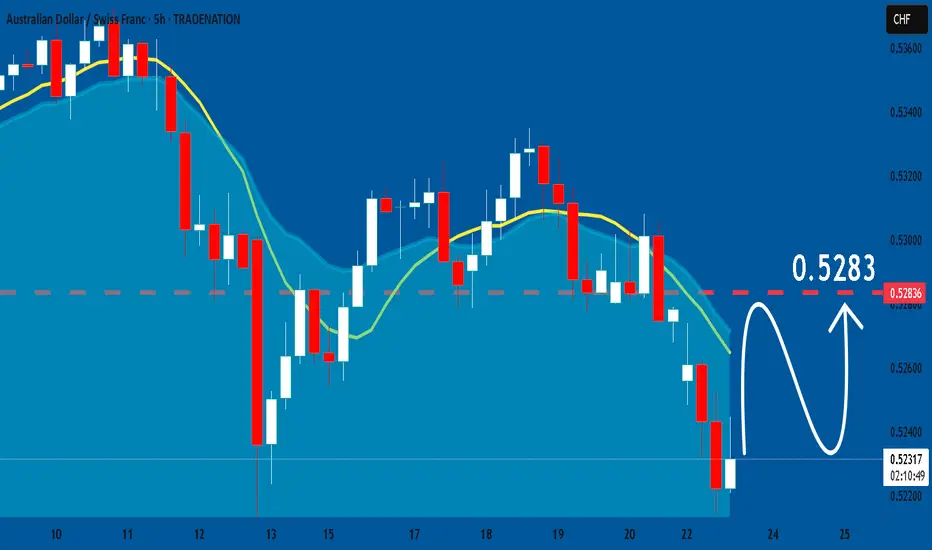
AUDCHF Technical Analysis! BUY!
My dear friends,
Please, find my technical outlook for AUDCHF below:
The instrument tests an important psychological level 0.5278
Bias - Bullish
Technical Indicators: Supper Trend gives a precise Bullish signal, while Pivot Point HL predicts price changes and potential reversals in the market.
Target - 0.5302
About Used Indicators:
Super-trend indicator is more useful in trending markets where there are clear uptrends and downtrends in price.
Disclosure: I am part of Trade Nation's Influencer program and receive a monthly fee for using their TradingView charts in my analysis.
———————————
WISH YOU ALL LUCK
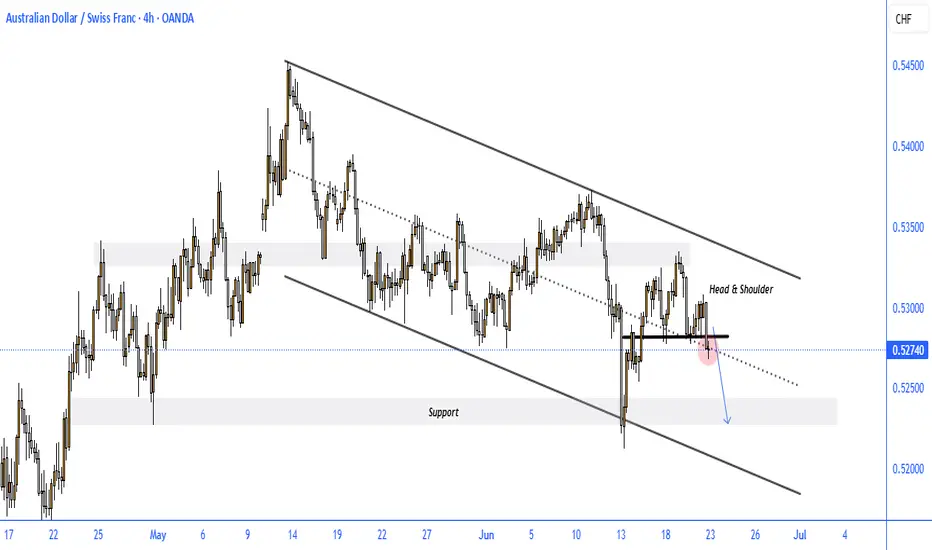
AUD CHF Trend UpdateWe are still in the bearish channel, with a H&S formation at the 4Hr timeframe. It might retest the neckline @0.5280 AOI before continue its downtrend.
Waiting for a price action at the AOI to sell
Good Luck!
AUDCHF BEARISH SETUPThe AUD/CHF 4-hour chart is presenting a classic Head & Shoulders pattern within a well-defined bearish descending channel, signaling a likely continuation to the downside if neckline support fails.
Key Observations:
Bearish Channel in Play: The broader trend remains bearish, with price action respecting both channel boundaries.
Head & Shoulders Formation: A visible Head & Shoulders pattern has formed near the top of the channel, with the neckline around 0.5275.
Neckline Break Risk: Price is currently testing the neckline area (highlighted in red). A confirmed break below would likely trigger bearish momentum.
Downside Target: A break below the neckline could push AUD/CHF toward the support zone near 0.5220, in line with the lower boundary of the channel.
Trend Structure: Lower highs and lower lows continue to dominate, reinforcing the bearish bias.
Conclusion:
AUD/CHF remains technically weak, and the emerging Head & Shoulders breakdown may act as a strong continuation signal within the existing downtrend channel. A clear close below 0.5270 could open the door for a further drop toward 0.5220. Caution is warranted for bulls unless a significant reversal signal emerges.
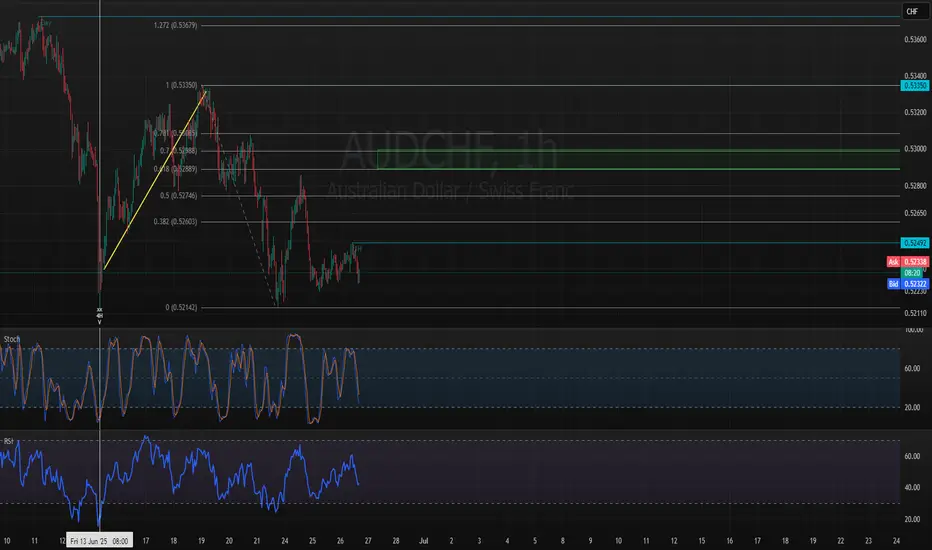
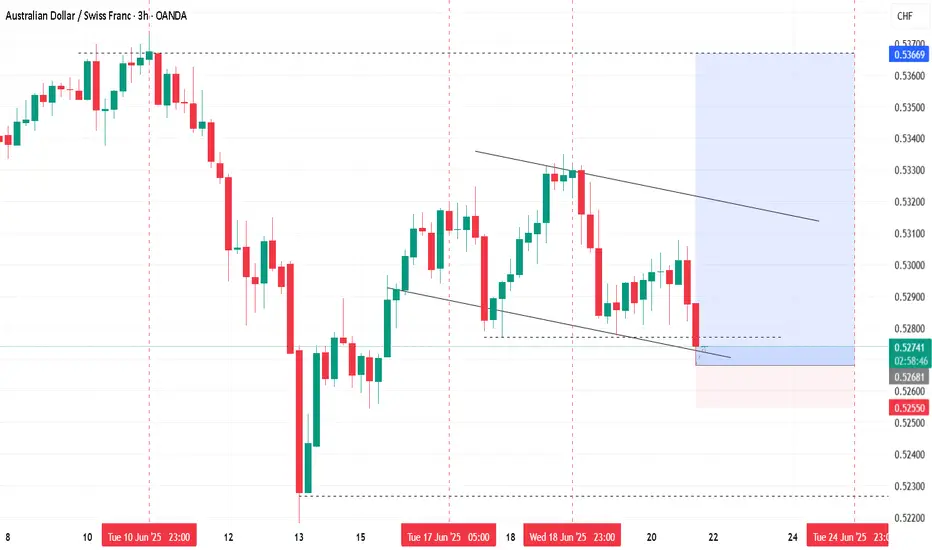
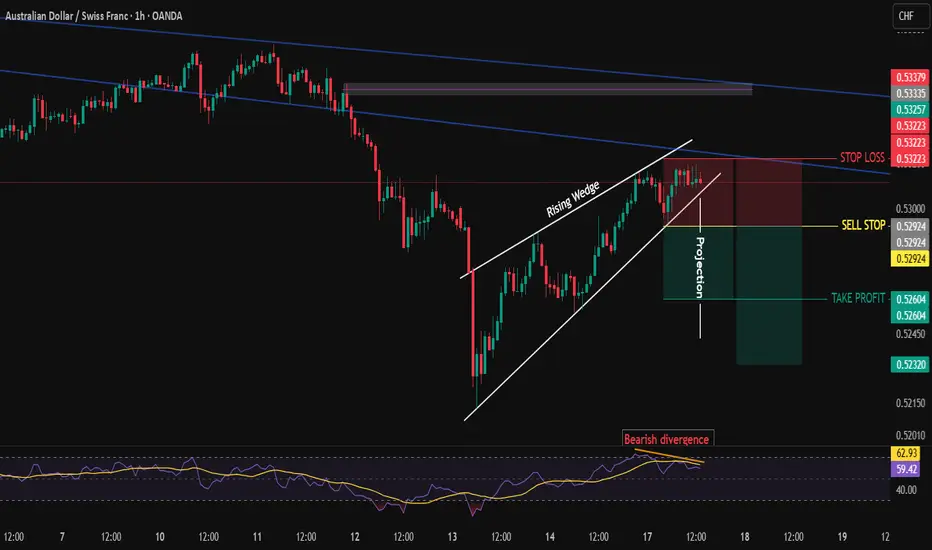
AUD/CHF – Bearish Harmonic Setup with RSI DivergenceKey Structure Highlights:
• ✳️ Bearish Harmonic Pattern (likely AB=CD) completed at point D
• 📉 Bearish divergence visible on RSI while price makes a Higher High (HH) — a classic sign of weakening momentum
• 📊 Clear entry plan with:
• Sell Stop: 0.52928
• Stop Loss: 0.53201
• TP1: 0.52629
• TP2: 0.52337
On the 1H chart, a Bearish Harmonic Pattern has completed near the 0.5315 level. Price formed a higher high (HH), while the RSI shows bearish divergence, signaling a loss of bullish momentum.
🟠 I’m looking to go short below 0.52928 with:
• 🛑 Stop loss above point D: 0.53201
• 🎯 TP1: 0.52629
• 🎯 TP2: 0.52337
🧠 Market Bias: Bearish
Although the recent trend shows higher highs and higher lows, the confluence of:
• Harmonic pattern completion
• Bearish divergence on RSI
…indicates a possible short-term reversal.
Scenario
⚠️ Always wait for confirmation before entering. The structure remains technically bullish until we break below the HL zone.

BUY AUDCHFSwing buys on AUDCHF as price begins to reject at the support. Price should aim for the recently created highs 0,53700 and possibly higher.
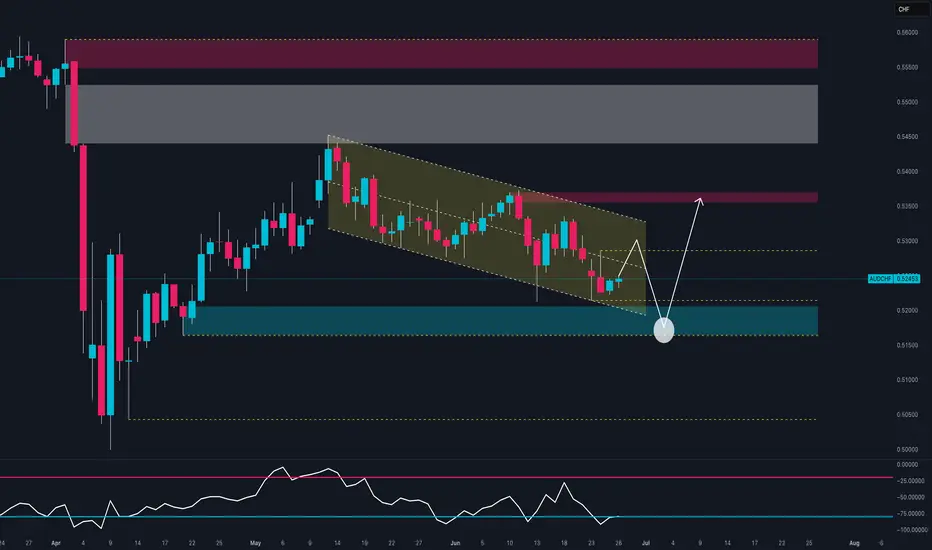
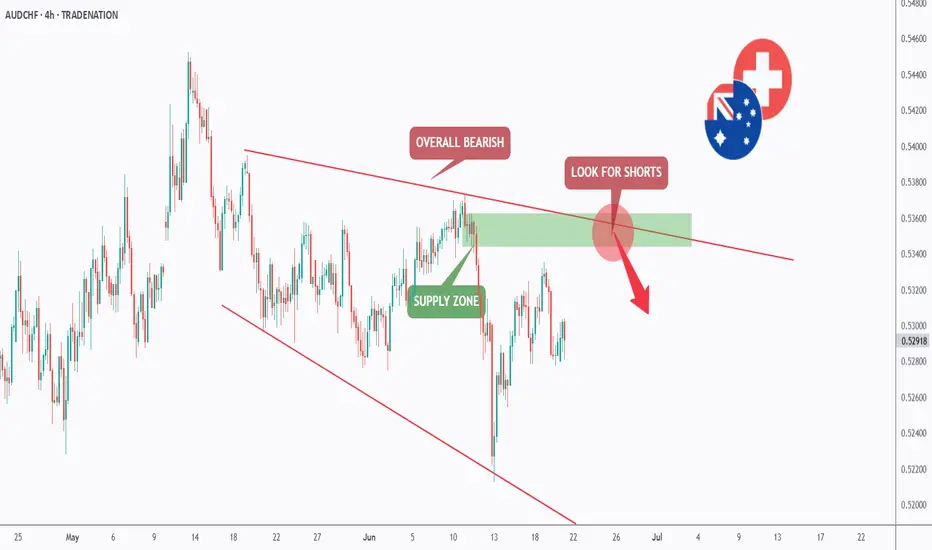
AUDCHF - Wait For it!Hello TradingView Family / Fellow Traders. This is Richard, also known as theSignalyst.
📈AUDCHF has been overall bearish trading within the flat falling broadening wedge pattern marked in red.
Moreover, the green zone is a supply.
🏹 Thus, the highlighted red circle is a strong area to look for sell setups as it is the intersection of the upper red trendline and supply.
📚 As per my trading style:
As #AUDCHF approaches the red circle zone, I will be looking for bearish reversal setups (like a double top pattern, trendline break , and so on...)
📚 Always follow your trading plan regarding entry, risk management, and trade management.
Good luck!
All Strategies Are Good; If Managed Properly!
~Rich
Disclosure: I am part of Trade Nation's Influencer program and receive a monthly fee for using their TradingView charts in my analysis.
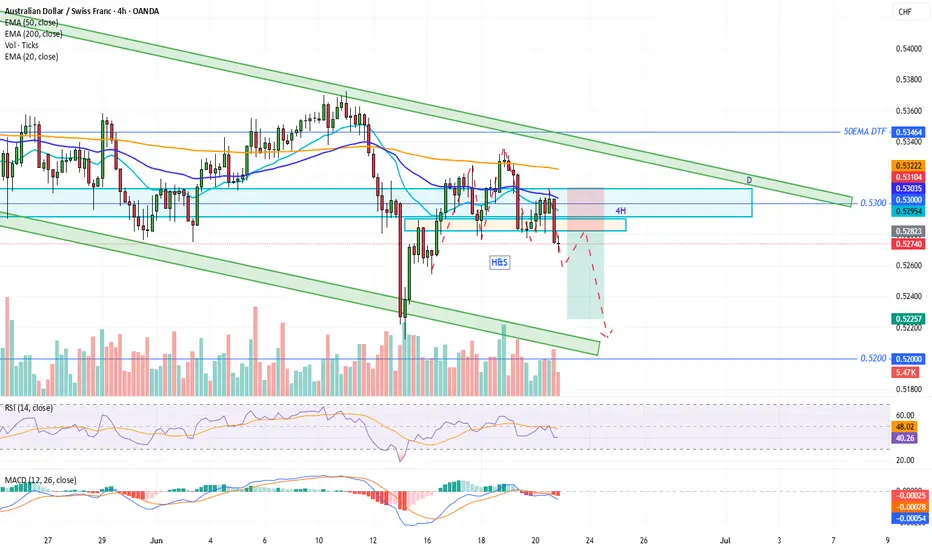
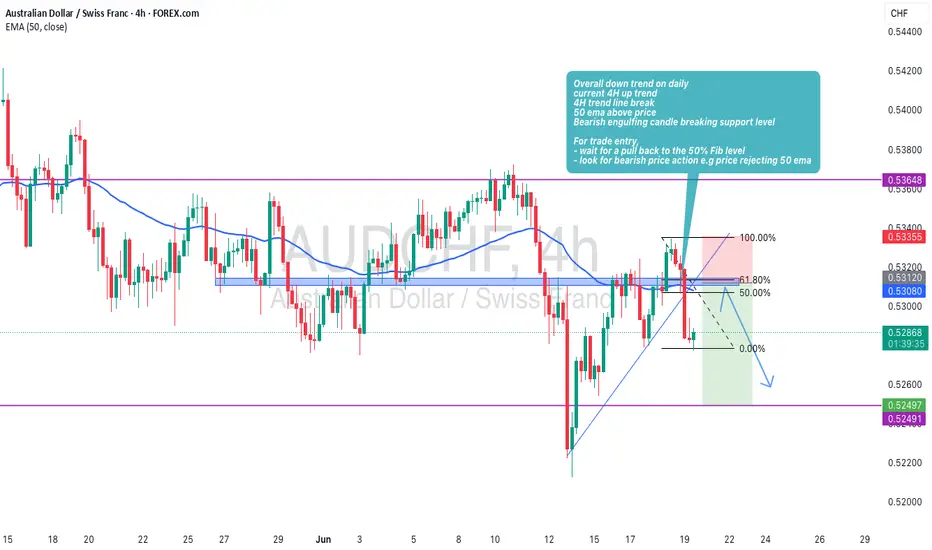
AUDCHF Bearish bias as M, W, D, 4H are bearish! Overall down trend on daily
current 4H up trend
4H trend line break
50 ema above price
Bearish engulfing candle breaking support level
For trade entry,
- wait for a pull back to the 50% Fib level
- look for bearish price action e.g price rejecting 50 ema
AUDCHF BEARISH SETUPAUDCHF looks like bearish setup.
Trend has been a bullish but at RSI is a formed bearish divergence.
And also reversal pattern rising wedge formed.
I took a trade with sell stop order after breaking a HL.
Manage your trade accordingly.
AUDCHFToday, after seeing the close of 4H candle above 4H SIBI FVG i change my bias to bullish
After engagement on 4H FVG i take my entry

AUD-CHF Bullish Bias! Buy!
Hello,Traders!
AUD-CHF is trading in an
Uptrend and the pair made
A bullish breakout of the
Key horizontal level of 0.5280
Which is now a support and
Went up sharply then made a
Retest of the new support level
And we are already seeing a
Bullish rebound so we are
Bullish biased and we wil
Be expecting a further
Bullish move up
Buy!
Comment and subscribe to help us grow!
Check out other forecasts below too!
Disclosure: I am part of Trade Nation's Influencer program and receive a monthly fee for using their TradingView charts in my analysis.
SWING SHORT AUDCHFon weekly price back to weekly OB and last weekly candl was bearish
On Daily price engage in Daily SIBI but failed to give as reaction and last day
Price take PCH as liquidity after no reaction from Daily FVG
Last day was respected candle to downsides > that lead me to bearish BIAS
so in 4H was my entry point from 4H FVG
My SL above SWING HIGH
