THIS WEEK GBPAUD TRADE SETUPPair: GBPAUD
✔ Classic Bearish formation
GBPAUD is STARTING down Trend so after market retracement I can take sell entry. If your analysis matches it take a trade otherwise skip the trade.
"💖 Show your love by liking & leaving a comment! Your support means the world to us! 💖"
AUDGBP trade ideas
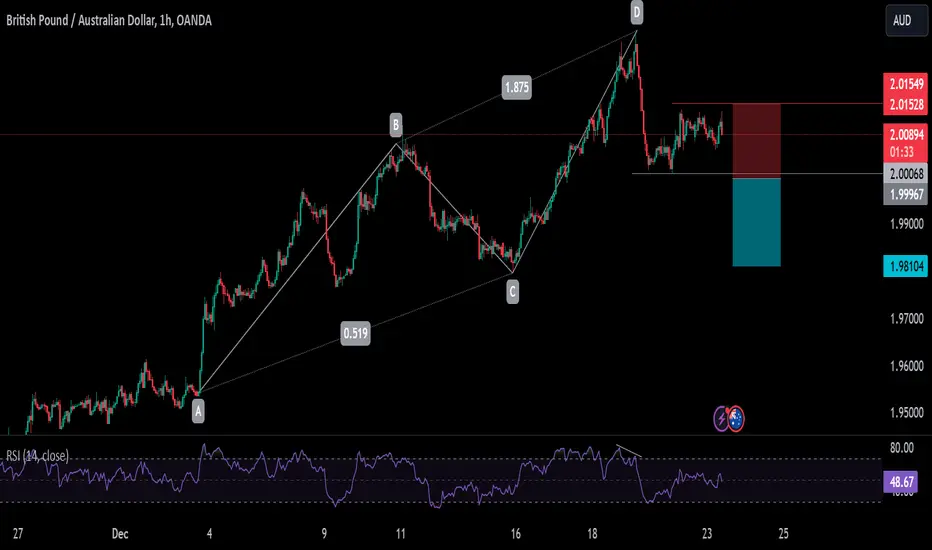
GBPAUD1.AB=CD is reversal pattran is complete.
2.Divergence at top.
3.Daily time frame bearish engulfing candle.
4.Also bearish flage at 1H TM
Sell stop 1.99974
Stop loss 2.01528
TP 1.98104
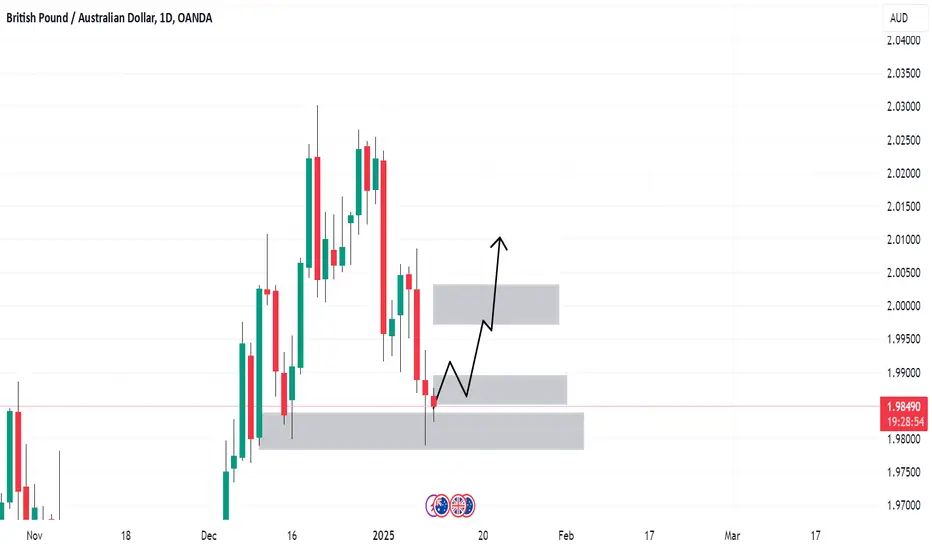
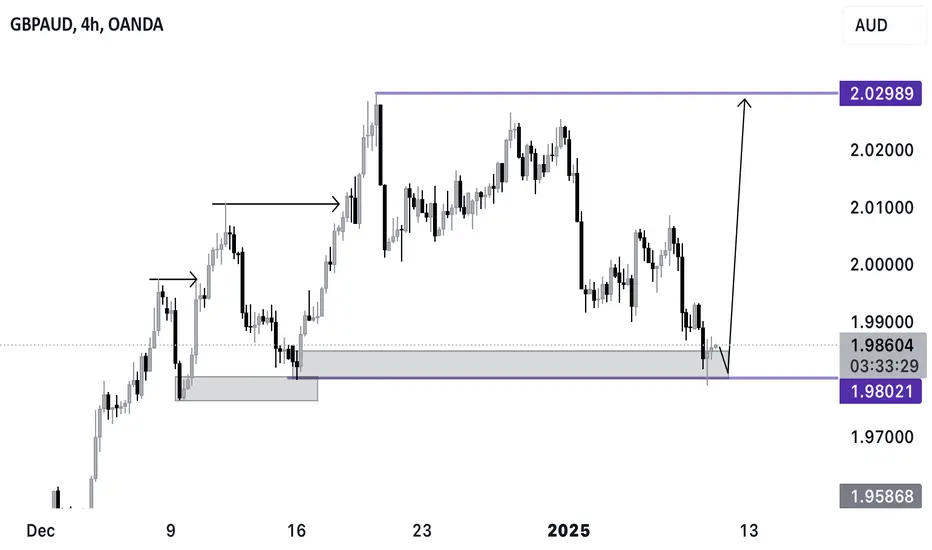
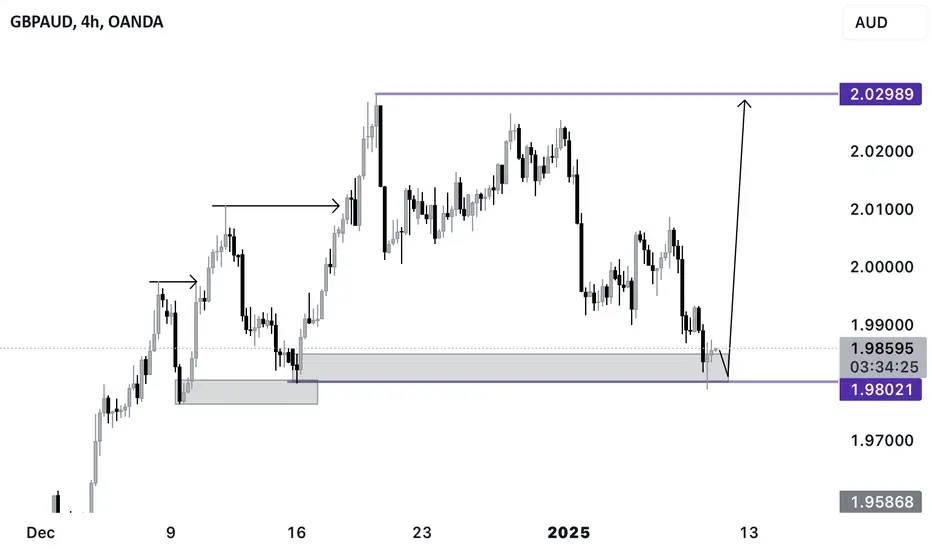
GBPAUD UPDATE!GBPAUD UPDATE!
Long-term structure: BULLISH
Short-term pullback: UNDERWAY
Daily time frame: Pullback in progress...
Are you ready for a potential further drop?
Stay ahead of the market with our:
Real-time updates
Exclusive analysis
Accurate predictions

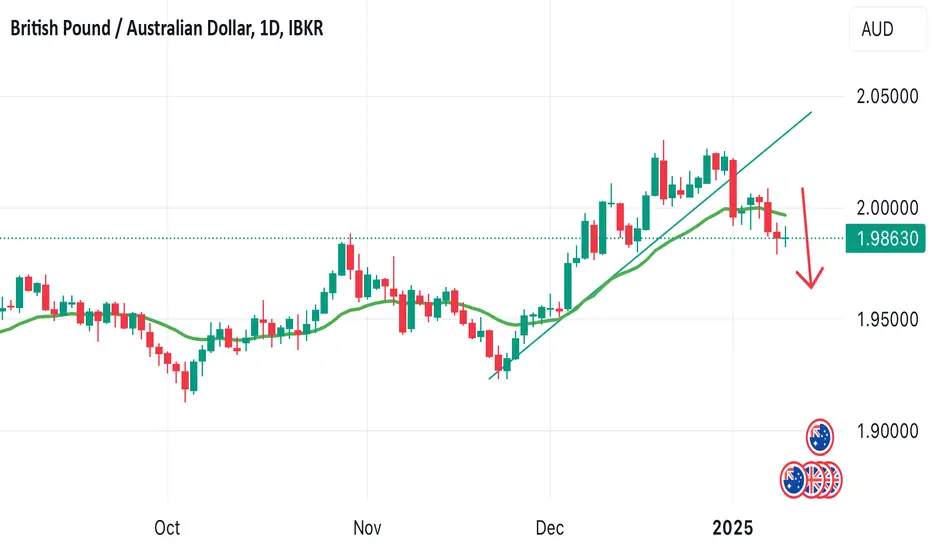
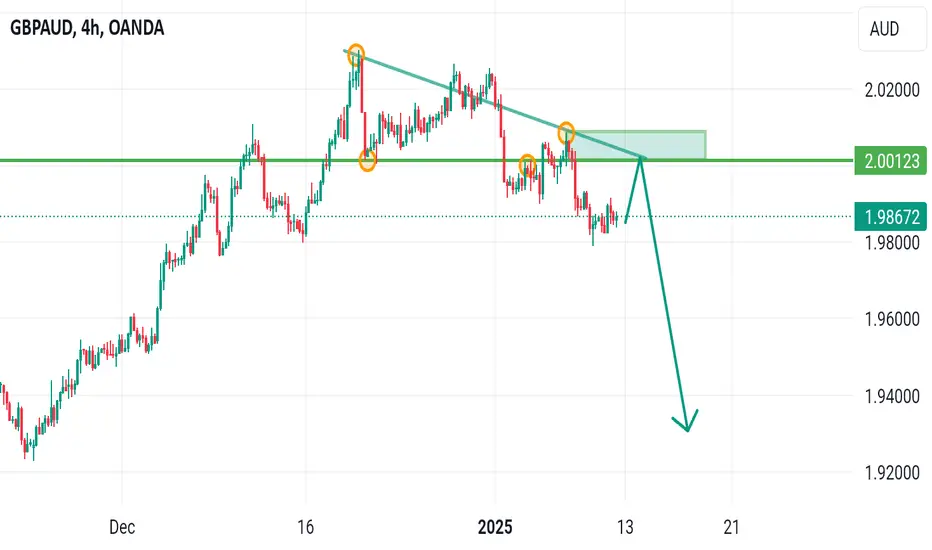
GBPAUD PRICE BREAKS TRENDLINE EXPECT A SELL!Price recently broke Below the trendline and and also crossed the 20EMA to the downside. I anticipate a sell opportunity from this market behaviour. In the coming week, we are looking forward to positioning ourselves to capitalize on the sell opportunity.
SellWe are waiting for 3rd touch of trend linein coincidence to significant support and resistant zone to sell
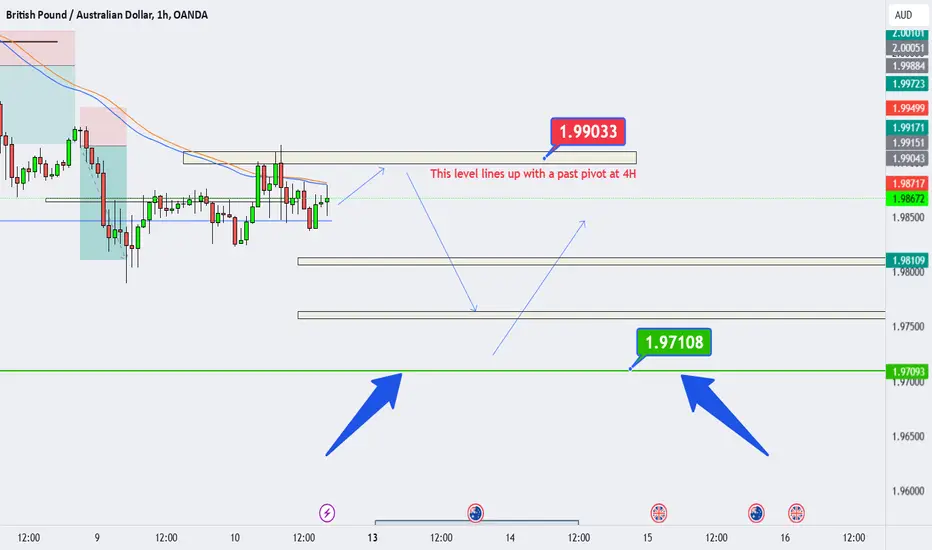
GBPAUD analysis This is how I'm seeing GBPAUD for the near future.
It's still in a strong uptrend, but I'm expecting a retracement to the 'green zone' (1.97108) before it moves to the upside. That level also lines up as follows: strong resistance turned into support / Pivot Point untouched on the weekly / Fair Value Gap on the Daily, and it also lines up beautifully with the Fibb tool at the 0.382 on the week.
**This is not an advice, it's just my view on how I'm seeing the possibilities of future price action.**
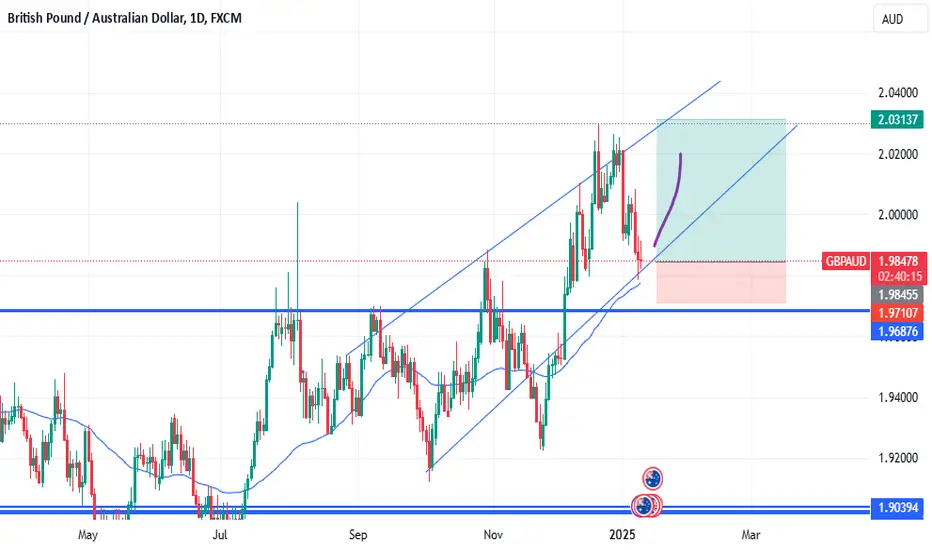
GBP/AUD ALERT: Reversal Opportunity in Play!📈 GBP/AUD ALERT: Reversal Opportunity in Play! 🚀
The GBP/AUD pair is showing a high-potential reversal setup on the daily chart! Here's why this could be your next big trade:
🔥 Channel Support in Action
The price is testing the lower boundary of a strong ascending channel, a proven support zone that has triggered multiple bullish moves in the past.
💡 Key Levels to Watch
Support Zone: 1.97107 - A major bounce zone.
Bullish Target: 2.03137 - Potential for an explosive 500+ pip move!
📊 Indicators Align for a Bounce
With price at critical support, a reversal toward the channel’s resistance is highly probable.
⚠️ Risk Management
Stop-loss just below 1.96876 keeps your trade safe while offering an excellent risk-to-reward ratio!
🎯 Trade Smart, Ride the Wave!
The GBP/AUD is poised for a big move—don’t miss this opportunity to capitalize on the market’s momentum!
👉 Are you ready to make the most of this setup? 💰
GBP/AUD BULLS WILL DOMINATE THE MARKET|LONG
Hello, Friends!
It makes sense for us to go long on GBP/AUD right now from the support line below with the target of 2.022 because of the confluence of the two strong factors which are the general uptrend on the previous 1W candle and the oversold situation on the lower TF determined by it’s proximity to the lower BB band.
✅LIKE AND COMMENT MY IDEAS✅
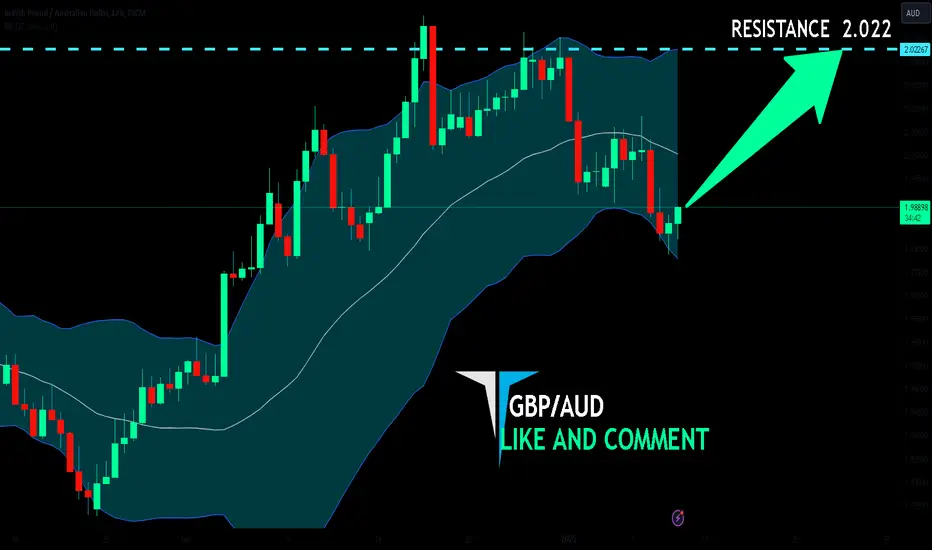
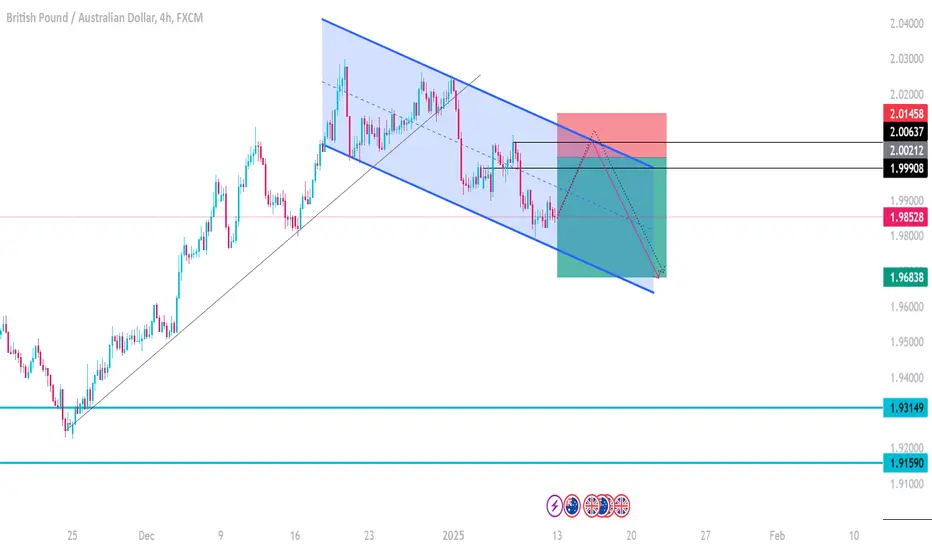
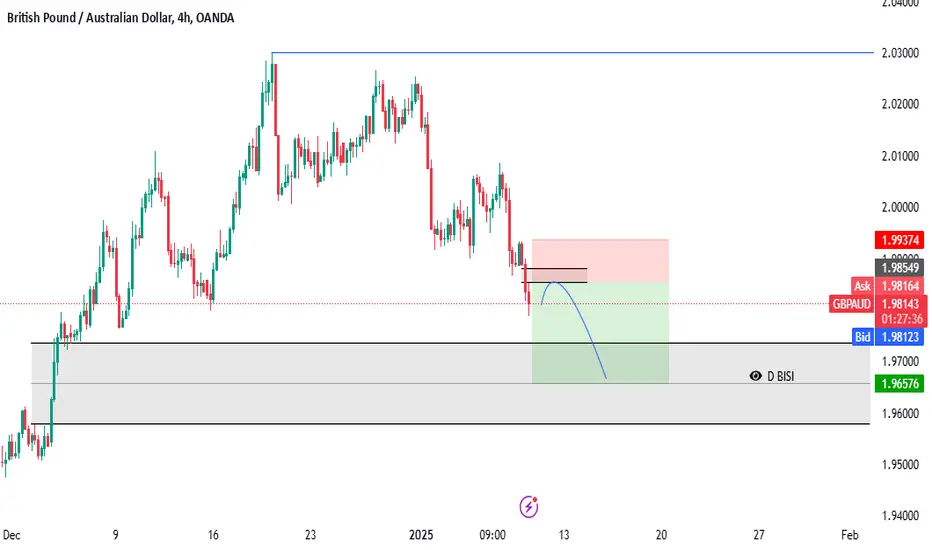
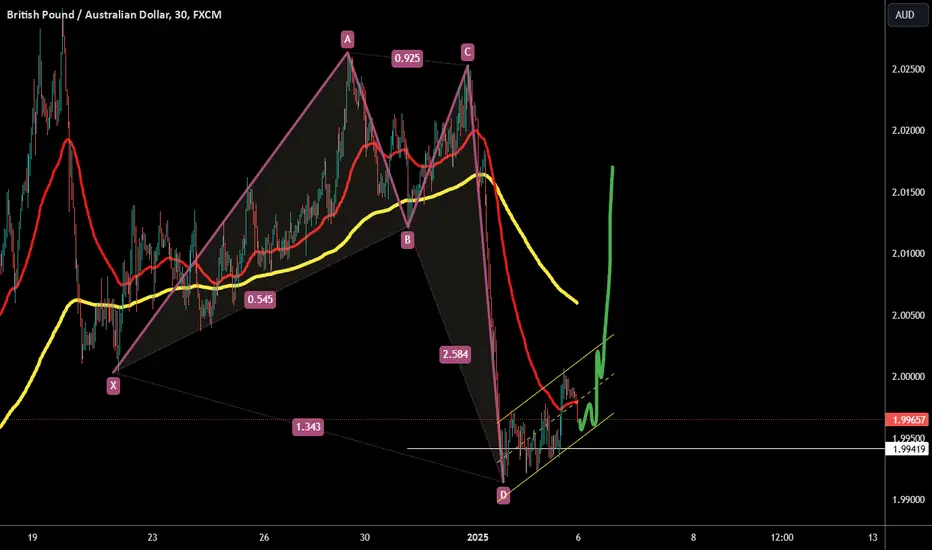
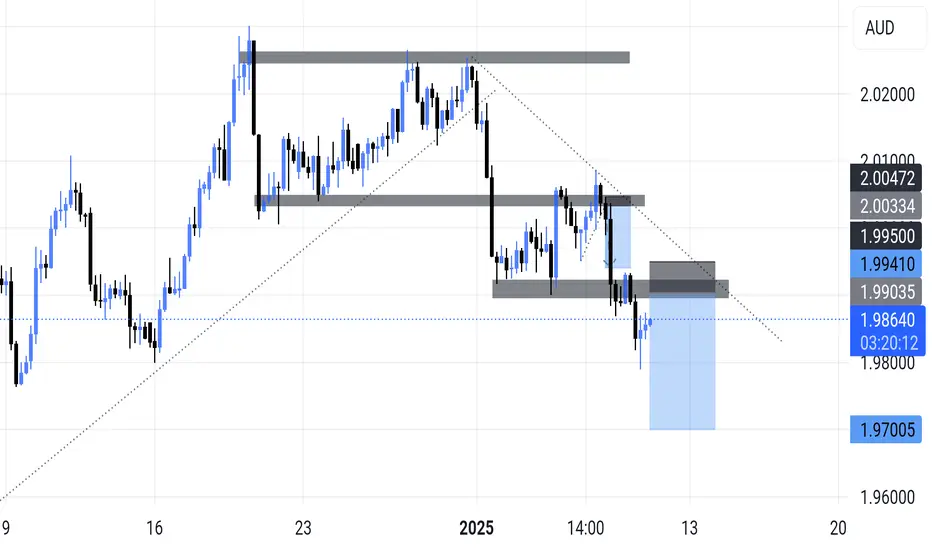
Chart : GBP/AUDHarmonic Analysis:
The GBP/AUD chart suggests the possibility of a "Bat Pattern" or "Crab Pattern," with the D point approaching.
The market is currently near the lower trendline of the ascending channel, which could act as a critical "reversal" zone.
Opportunities and Risks:
Opportunity: If the D point (support at 1.9940) holds, GBP/AUD could rebound and move back toward the upper trendline of the channel.
Risk: If GBP/AUD breaks below the lower trendline, the harmonic pattern could fail, leading to a significant further decline.
Recommendation:
Wait for GBP/AUD to reach or confirm the D point near the lower channel line. If it holds, there is a good opportunity to enter the market for a move upward.
GBPAUD LONG OANDA:GBPAUD
wait 1 day candle close zone break
and wait for 4 hr retracement
entry tp1 1day support,
tp2 weakly support,
tp3 potion and hold
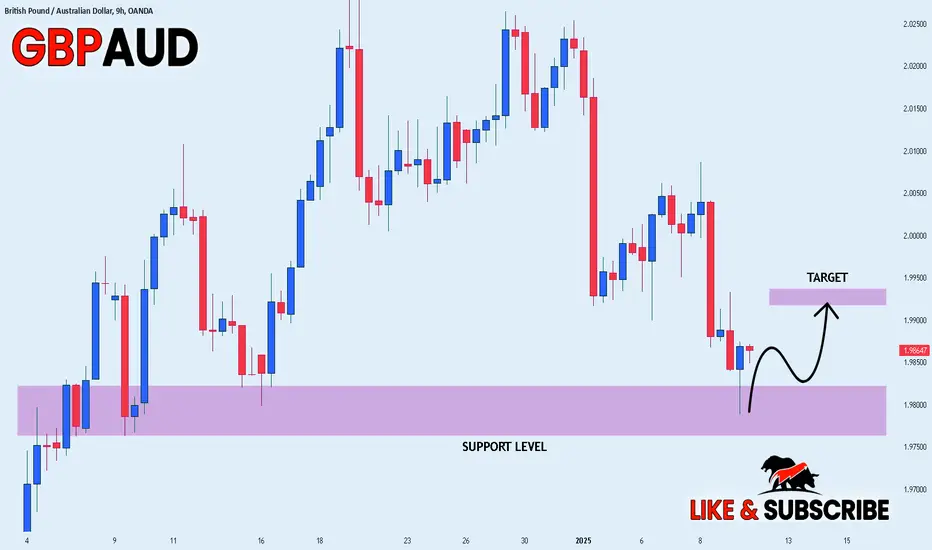
GBP_AUD GROWTH AHEAD|LONG|
✅GBP_AUD went down to retest a horizontal support of 1.9763
Which makes me locally bullish biased
And I think that a move up
From the level is to be expected
Towards the target above at 1.9919
LONG🚀
✅Like and subscribe to never miss a new idea!✅
GBPAUD SELL PROJECTION GBPAUD is in a downtrend and as we know we are not suppose to trade against the trendline, price as has touched it twice which signifies a strong down trend , so retest to the zone and we go short
GBPAUD next possible long ideaGBPAUD may resume its upward movement from the major support
Let’s look for lower timeframe market structure shift for a good confirmation
GBPAUD next possible long ideaGBPAUD may resume its upward movement from the major support
Let’s look for lower timeframe market structure shift for a good confirmation
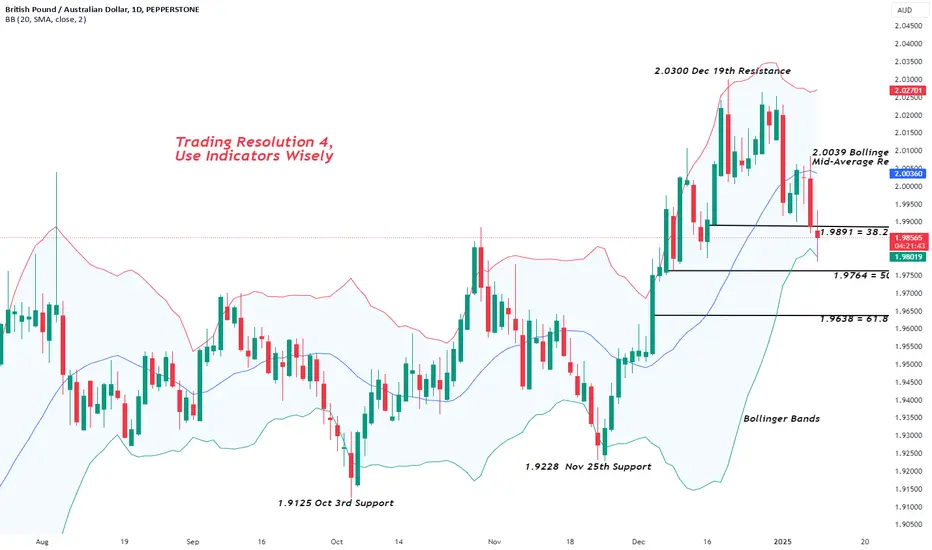
Trading Resolutions for 2025The start of a New Year is always a time to not only look back on the old, but also look ahead to the new.
Resolutions are often made during this period, so we wanted to provide some suggestions of what you could try from a trading perspective in the year ahead.
1. Keeping a Trading Journal: This doesn’t have to be as onerous as I’m sure you’re thinking! Every time you initiate a trade, write down in a notebook, on your phone or in a file on your laptop, why you’ve executed the trade, your expectations for the trade, the entry and stop loss level(s), possible objectives, the outcome of the trade, and finally your thoughts on what was right/wrong/or how things could have been improved.
This will allow you to look back on all your trades, assess your trading strategy and check on how results have changed from trade to trade. Does one strategy consistently outperform the others? Are you making consistent mistakes with trades that lose you money? Are your stop losses being hit more than objectives?
This can be performed on a daily, weekly, monthly, or even annual basis to provide valuable insights into what you may be doing wrong and, more importantly, what you are doing right
2. Never Trade Without a Stop Loss in Place: The first question you should always ask yourself before you hit the trade button, is where your stop loss needs to be.
Choose chart levels that matter, like previous highs or lows, moving averages, or Fibonacci retracements. Setting a stop loss based solely on risk tolerance may place it above strong support or below strong resistance, where price reversals often occur after stops are triggered. Consider putting your stop loss just above resistance for short positions or just below support for long positions.
3. Determine the Size of Position You Take in Each Trade by Using The Stop Level: This follows on from number 2 above. Try not to go into every trade thinking, I’m prepared to lose X amount financially on each trade, so I will trade my usual size of the asset, which means the stop should be here.
Consider whether a better approach maybe to identify where your stop loss should be before you trade an asset, then try adjusting the size of your position to suit where the stop loss level you identified should be placed.
This way, your financial risk remains the same each trade, but your stop is in what you have identified as the correct position.
4. Establish a Chart Template on Your Pepperstone System Using Technical Indicators You Trust: Consider assessing what technical indicators you like and trust, be it for example Bollinger Bands, Moving Averages, Momentum and/or Trending indicators, or a combination of them. Whatever you feel works for you and you have a feel for.
If you’re not sure which indicators work best for you and your trading, use a Pepperstone demo trading account to test out the technical signals you receive and see what does work for you in a risk free live environment.
Remember you don’t have to overcomplicate things by always having all the indicators available to you on a chart. Consider keeping it simple with one momentum, one trending, one sentiment indicator, and an indicator that allows to gauge sentiment, such as Bollinger Bands.
Take a look at our timeline where we have already covered several indicators and the types of signals they generate; over time we will add to this coverage.
5. If you like our posts, please hit the Rocket button so we know you like our work, or leave us a comment and let us know if you’d like anything in particular covered.
The material provided here has not been prepared in accordance with legal requirements designed to promote the independence of investment research and as such is considered to be a marketing communication. Whilst it is not subject to any prohibition on dealing ahead of the dissemination of investment research, we will not seek to take any advantage before providing it to our clients.
Pepperstone doesn’t represent that the material provided here is accurate, current or complete, and therefore shouldn’t be relied upon as such. The information, whether from a third party or not, isn’t to be considered as a recommendation; or an offer to buy or sell; or the solicitation of an offer to buy or sell any security, financial product or instrument; or to participate in any particular trading strategy. It does not take into account readers’ financial situation or investment objectives. We advise any readers of this content to seek their own advice. Without the approval of Pepperstone, reproduction or redistribution of this information isn’t permitted.