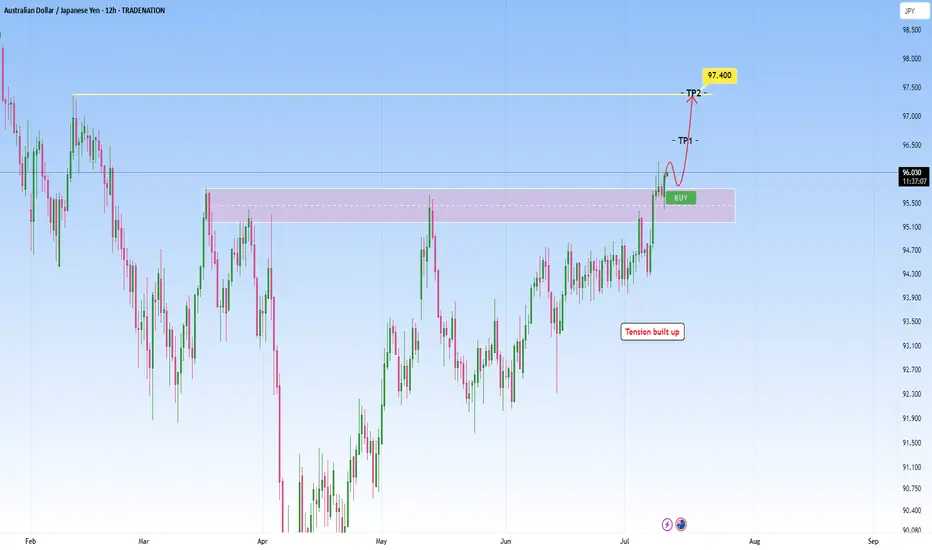
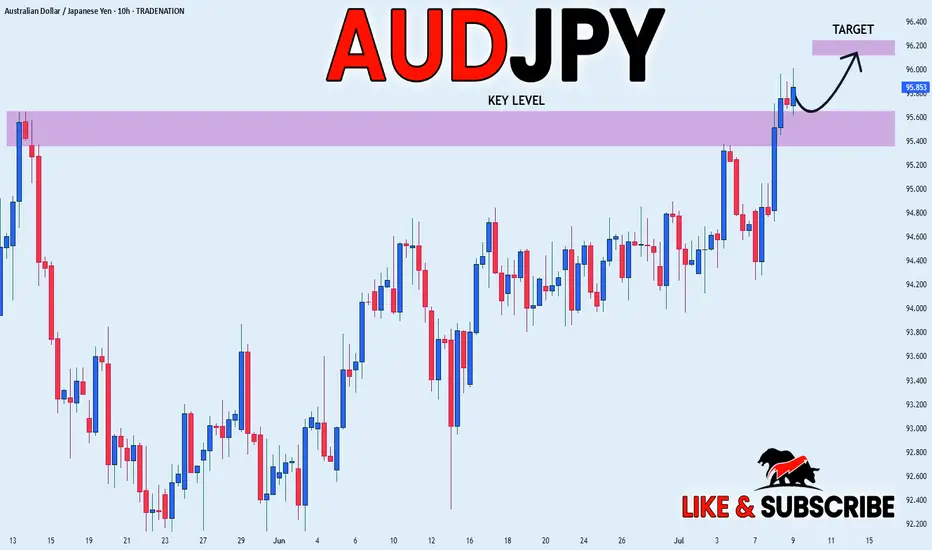
AUDJPY Technical Breakout - Targeting 97.400 Next?TRADENATION:AUDJPY has recently broken decisively above a key resistance zone that had previously capped price for several months. This breakout was preceded by a period of compression and range-bound price action, where bullish momentum steadily built up, indicated by higher lows pressing against the resistance level. This type of structure typically leads to an explosive breakout, which we are now seeing unfold.
After the breakout, price came back for a clean retest of the broken resistance zone, which has now flipped into support. The retest held firmly, suggesting strong buyer interest at this level and confirming the validity of the breakout.
With this structure in place, the bullish momentum is likely to extend further toward the next target zone around 97.400, provided price remains above the current support.
As long as the price holds above the retested zone, the bullish outlook remains intact. A breakdown back below this area, however, would be a warning sign and could open the door to a deeper pullback.
Remember, always wait for confirmation before entering trades, and maintain disciplined risk management.
AUDJPY trade ideas
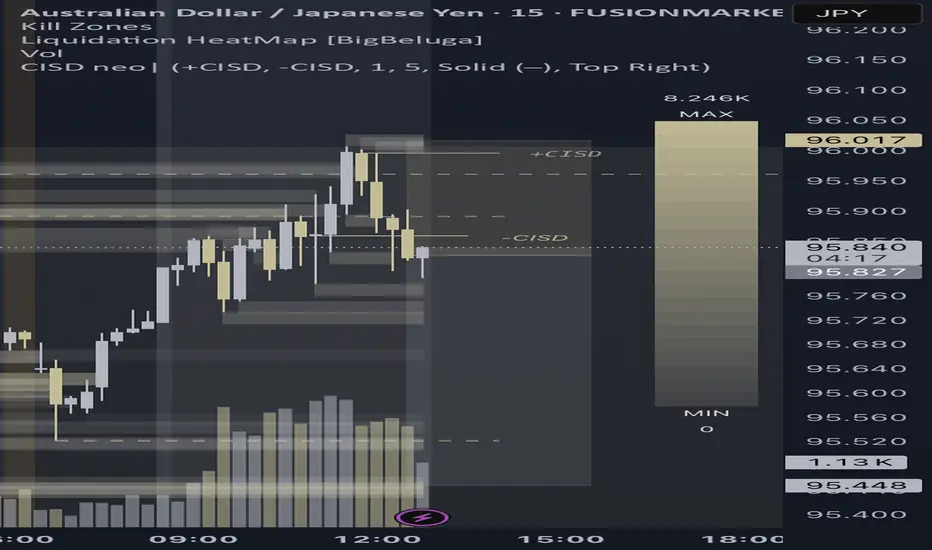
AUDJPY – Liquidity Trap Short Setup
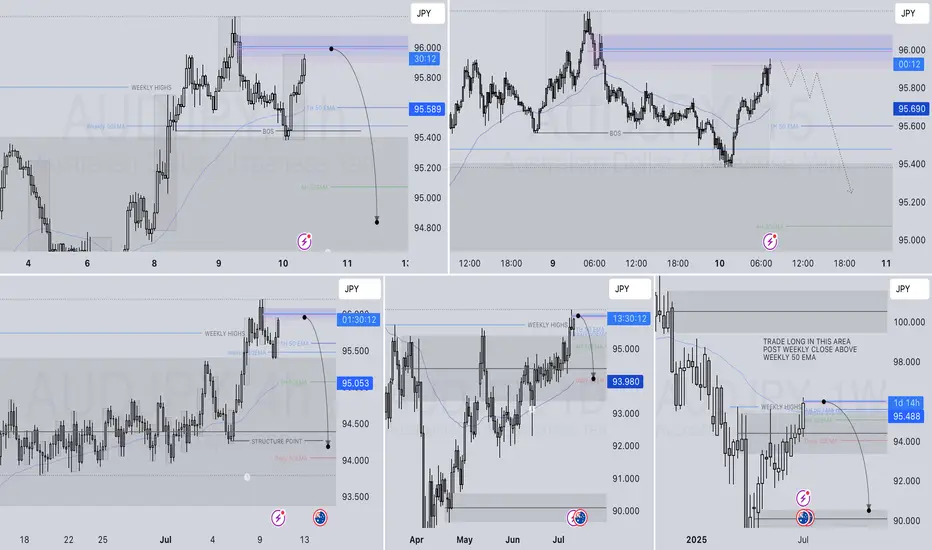
Box framed between 95.961–94.719, with layered buyside liquidity swept at 95.859 and 95.961. Price printed a bearish body below structural shift (-CISD), confirming trap activation.
Entry executed post-shift → targeting sellside liquidity at 95.521, with extended draw potential toward 94.719.
Liquidation heatmap shows dim clusters above, bright gold clusters below = strong directional bias.
Narrative: smart money sweep complete → trap symmetry locked → discount magnet engaged. 📉🎯
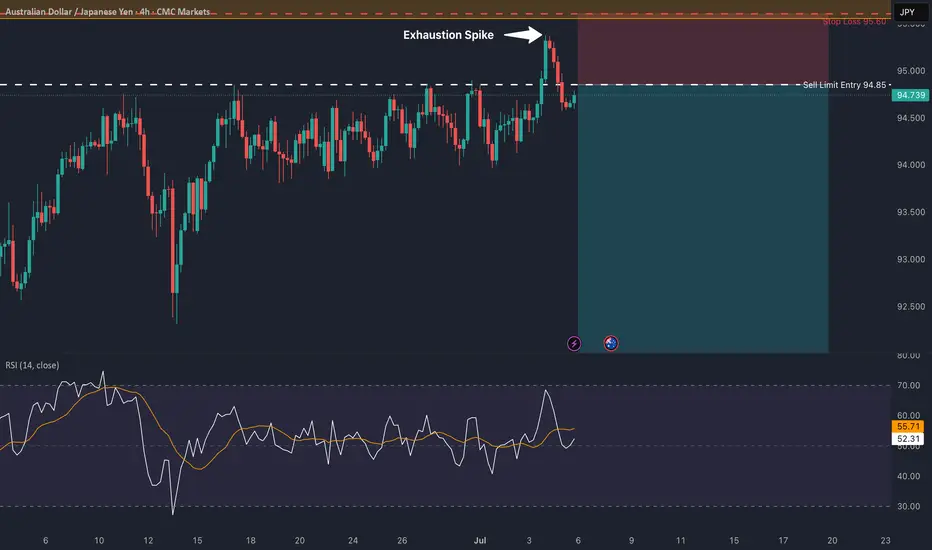
AUD/JPY: Rejection at Key ResistanceThis is a high-conviction short setup on AUD/JPY based on a powerful rejection pattern that has formed on the 4-hour chart. As you can see, the price spiked into the critical resistance zone between 95.00 and 95.55 but was immediately and forcefully rejected, leaving behind a long "Exhaustion Spike."
This is a classic sign of buyer exhaustion and seller dominance. It tells us that despite the recent rally, there is significant supply waiting at these higher levels. This price action provides a clear opportunity to short the pair in anticipation of a significant move down.
🏦 Fundamental Analysis
The fundamental backdrop provides a strong tailwind for this trade, with two key drivers:
1️⃣ Central Bank Divergence: The Reserve Bank of Australia (RBA) is in an easing cycle, having recently cut rates to 3.85% with more cuts expected. In stark contrast, the Bank of Japan (BoJ) is on a path of normalization, having already raised its rate to 0.50%. This divergence in monetary policy is structurally bearish for AUD/JPY.
2️⃣ Imminent Catalysts: This week is packed with event risk that is skewed to the downside for this pair. We have the RBA interest rate decision on Tuesday, July 8th , and the U.S. tariff deadline on Wednesday, July 9th . A dovish RBA or a "risk-off" move from the tariff news would likely accelerate the decline in AUD (a risk currency) and strengthen the JPY (a safe-haven currency).
📊 Technical Analysis
The price action on the chart confirms the bearish bias:
1️⃣ 4-Hour Rejection: The "Exhaustion Spike" at the 95.00 - 95.55 supply zone is the primary signal. It shows a clear failure by buyers and a strong takeover by sellers at a key level.
2️⃣ Long-Term Trend: On the daily chart, the price is trading below the critical 200-day moving average , confirming the long-term trend remains bearish.
3️⃣ Waning Momentum: There is a clear bearish divergence on the daily RSI. The price made a higher high, but the momentum indicator made a lower high, signaling that the rally is internally weak and losing steam.
📋 Trading Setup
This is a swing trade designed to capture a significant correction with a simple "set and forget" plan.
📉 Direction: SHORT / SELL
👉 Entry: Sell Limit @ 94.85
⛔️ Stop Loss: 95.60
🎯 Take Profit: 91.10
💡 Rationale: The entry is placed strategically to capitalize on a potential retest of the rejection area. The stop loss is placed safely above the rejection wick and the major resistance zone. The take profit targets the major structural support from the May 2025 lows, offering an excellent risk-to-reward ratio.
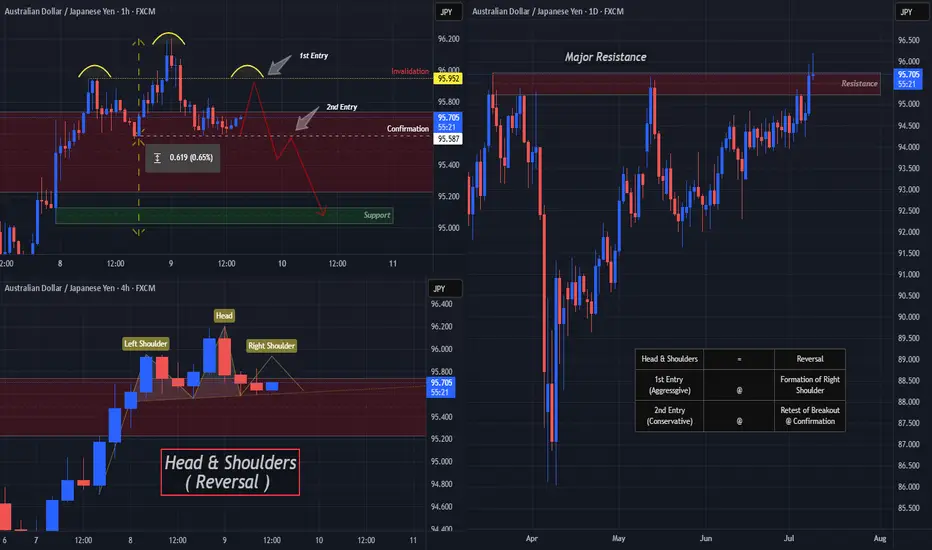
AUDJPY Ready To "Drop A Shoulder"? Multi-Timeframe May Help!OANDA:AUDJPY is beginning to form a very convincingly strong Reversal Pattern, the Head & Shoulders!
Starting with the Daily Chart we can see that Price is Forming a Doji Candle just after trying to Breakout of a Major Resistance Zone created from the Highs of March 18th and if Price is unable to close above this level, this strengthens the Bearish and Reversal Bias.
Now the 4 Hr Chart shows both the "First Shoulder" or Previous Higher High that was surpassed by the "Head" which is the New Higher High, has formed quite quickly with a slightly Ascending "Neckline" or Support Line where Bulls were able to make their Last Stand.
With a Reversal Pattern, you want to see a Change in Trend, in this case, would be a Lower High then that of the Higher High or "Head" @ 96.204.
*If Bulls are able to Push Price above the "Left Shoulder" or Previous Higher High @ 95.952, this will Invalidate the Head & Shoulders Set-up!
**If Bulls are unable to Break Above 95.952 and Price is pushed back down to the Confirmation or "Neckline" for a 3rd time, this Confirms the Head & Shoulders Set-up!!
Based on the Distance between the Head and Neckline, we can project a potential drop down to the next Support Level as a Price Target @ 95.00 once:
1) Pattern is Confirmed
2) Breakout is Validated
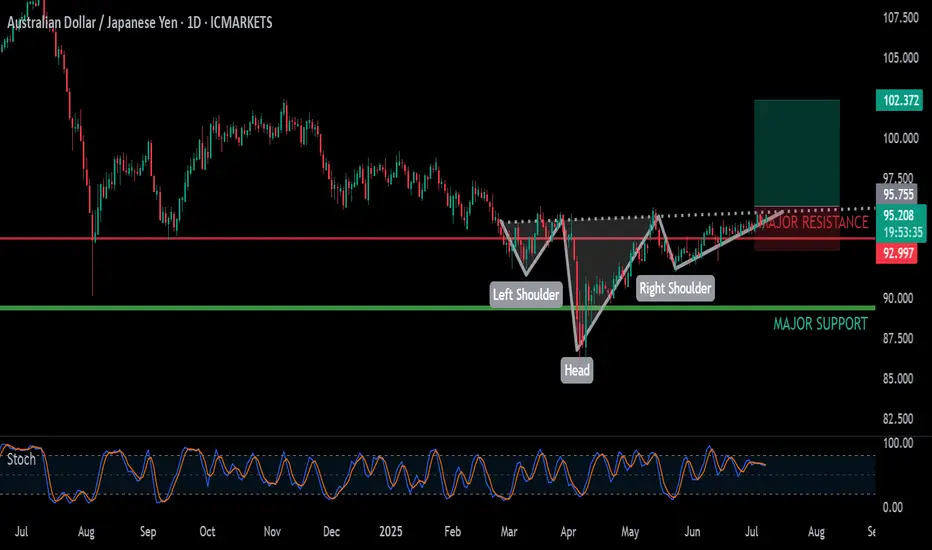
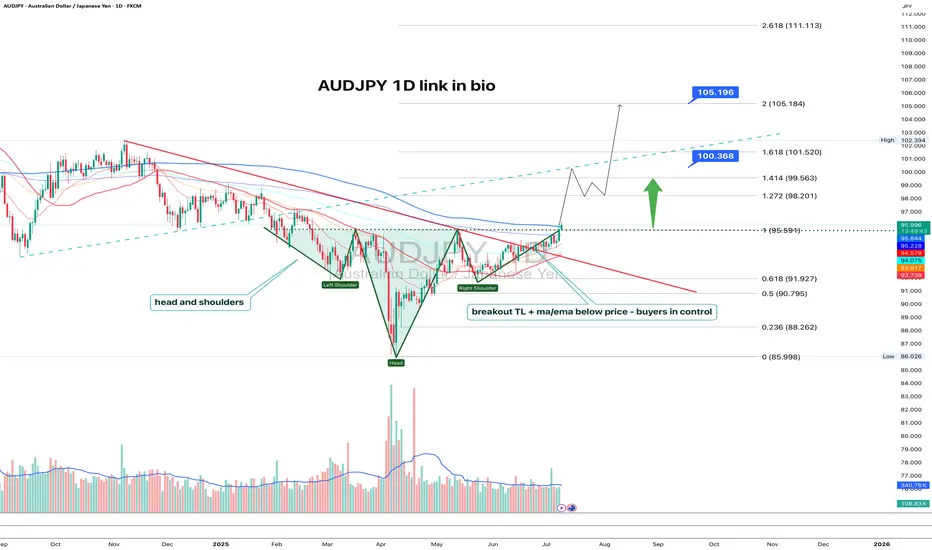
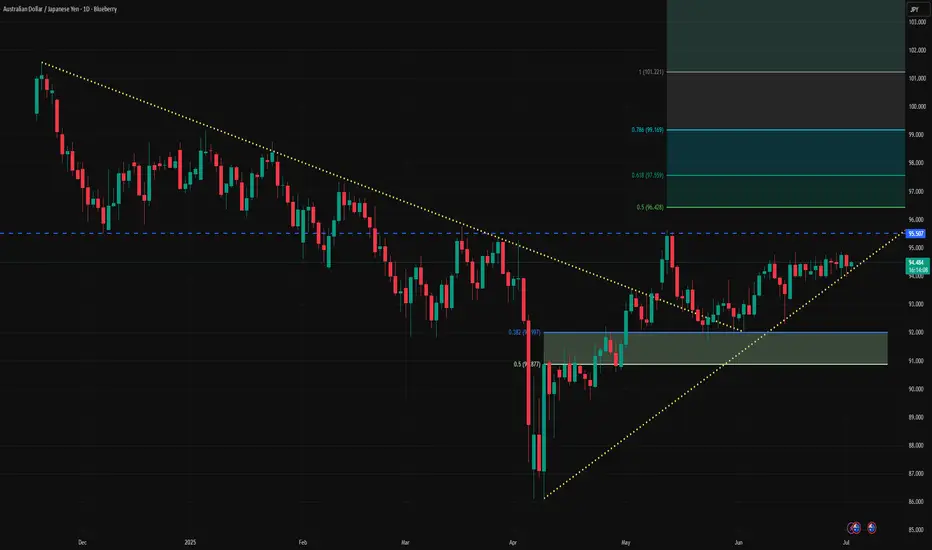
AUDJPY 1D: breakout toward 100–105AUDJPY has confirmed an inverse head and shoulders breakout on the daily chart, with a strong move above the neckline. All key moving averages, including MA50 and MA200, remain below the current price — confirming bullish momentum. Volume increased on the breakout, and price has held above the 95.6 neckline zone. As long as that level holds, the setup remains valid. Targets are set at 100.36 (1.618 Fibo) and 105.19 (2.0 Fibo).
RBA in focus: AUD JPY to continue up? It's a week bereft of major US data. In the main it'll be up to the 'risk environment' to determine proceedings (which currently means tariff headlines).
But we do have the RBA and RBNZ rate decisions to potentially create opportunities.
First up, during Tuesday's Asian session is the RBA, a central bank with a preference for high interest rates (hawkish).
*Reminder: (risk environment aside) high interest rates 'generally' equals strong currency.
Analyst concencious is for a 0.25bp cut.
I can envision two scenarios:
A rate cut with 'hawkish narrative' (non or limited cuts on the horizon).
No rate cut (hold), with data dependent forward guidance.
Both scenarios 'should' be AUD positive. Possibly creating another AUD JPY long trade.
Of course, especially after Friday's NFP, we know that anything can happen and the RBA could deliver a 'dovish cut'. But considering inflation is still relatively high in Australia, I would be surprised with that outcome.
And, of course, a lot depends on the overall 'risk environment'. We could very well have 200% tariffs across the board in 12 hours time. And I would only long the AUD in a 'positive risk environment'.
*Side note: With the S&P 'near all time highs', it's only natural that it could pull back a little. So, I'm more focused on the actual narrative at the moment rather than correlations.
**Second side note: I'm slowly starting to revisit the ' buy / sell stop anticipation trade'. And arguably, an 'AUD long' pre-rate decision is viable. (Whereby you place an 'AUD long' stop order pre event, if it's a dovish outcome the order doesn't trigger). It's not something I endorse in a 'live account' but it's a strategy worth considering. Particularly as I suspect 'red flag' US releases could become important moving forward.
Ultimately, no matter the type of trade you take, it's very important to remember that 50% will hit profit and 50% will stop out. That's why we use a higher risk/ reward per trade.
AUDJPY SHORT FORECAST Q3 D10 W28 Y25AUDJPY SHORT FORECAST Q3 D10 W28 Y25
Professional Risk Managers👋
Welcome back to another FRGNT chart update📈
Diving into some Forex setups using predominantly higher time frame order blocks alongside confirmation breaks of structure.
Let’s see what price action is telling us today! 👀
🔑 Remember, to participate in trading comes always with a degree of risk, therefore as professional risk managers it remains vital that we stick to our risk management plan as well as our trading strategies.
📈The rest, we leave to the balance of probabilities.
💡Fail to plan. Plan to fail.
🏆It has always been that simple.
❤️Good luck with your trading journey, I shall see you at the very top.
🎯Trade consistent, FRGNT X
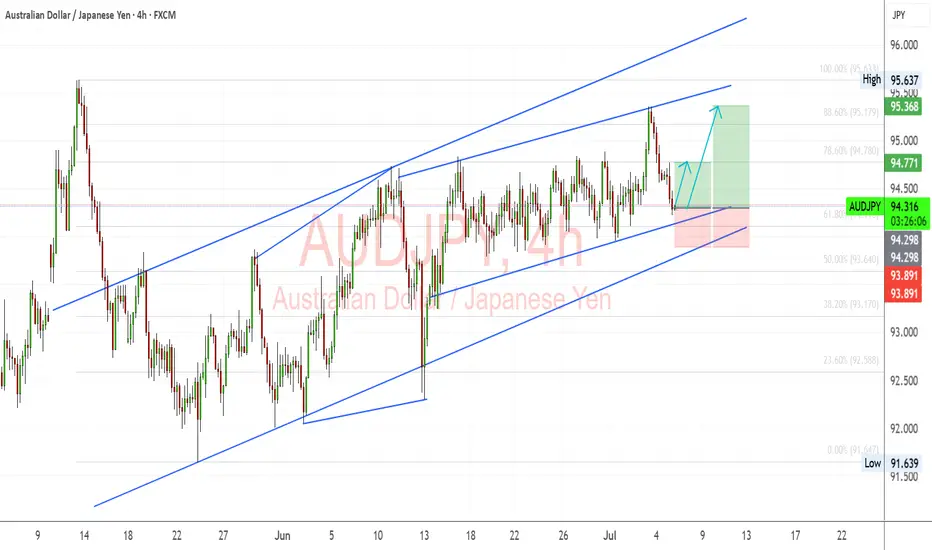
AUDJPY Bullish Channel Still Intact, Eyeing Breakout Above 95.00AUDJPY continues to respect its ascending channel, with the current bounce occurring right at the 61.8% Fibonacci retracement and lower trendline support. The structure supports further upside as long as price holds above the 94.00–93.80 zone, with targets set toward 94.77 and 95.36, potentially extending to 95.63 highs.
🧠 Fundamentals:
AUD Strength Drivers:
RBA remains relatively hawkish vs other G10 banks.
Australia's data this week (retail sales, NAB confidence) were mixed, but no rate cut pricing in the near term supports AUD.
Iron ore demand showing resilience despite Chinese slowdown concerns.
JPY Weakness Drivers:
BoJ remains ultra-dovish. No action expected in July.
Japan’s inflation remains tame; the yield gap with other majors keeps widening.
Risk-on sentiment reduces demand for safe-havens like JPY.
🔍 Technical Structure:
Strong upward channel since early June remains valid.
Current pullback held the 61.8% Fib retracement of the June-July leg.
Bullish engulfing near support confirms entry.
Immediate resistance at 94.77 → 95.36 → potential breakout to 95.63.
Invalid if price closes below 93.80 (channel break).
⚠️ Risk Factors:
Risk-off shift (e.g., geopolitical escalation or U.S. CPI surprise) may boost JPY.
China growth fears can weigh on AUD.
A sudden dovish shift from the RBA would invalidate bullish fundamentals.
🔁 Leader/Lagger Dynamics:
AUDJPY typically leads other yen crosses (e.g., NZDJPY, CADJPY) during risk-on moves. It’s also a barometer for broader risk sentiment, often following moves in equity indices like US500 or commodity-linked assets.
✅ Trade Bias: Bullish
TP1: 94.77
TP2: 95.36
TP3 (aggressive): 95.63
SL: Below 93.80
Event to Watch: China data this week + U.S. CPI (Jul 11)
📌 Watch for a strong bullish daily candle above 94.77 for continuation confirmation. Stay nimble around key global risk events.
AUD_JPY WILL KEEP GROWING|LONG|
✅AUD_JPY is going up
Now and the pair made a bullish
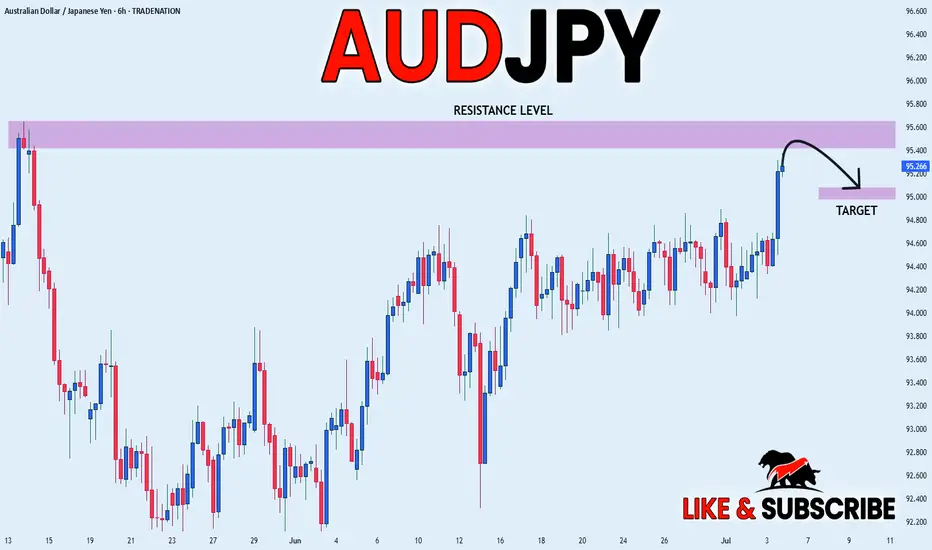
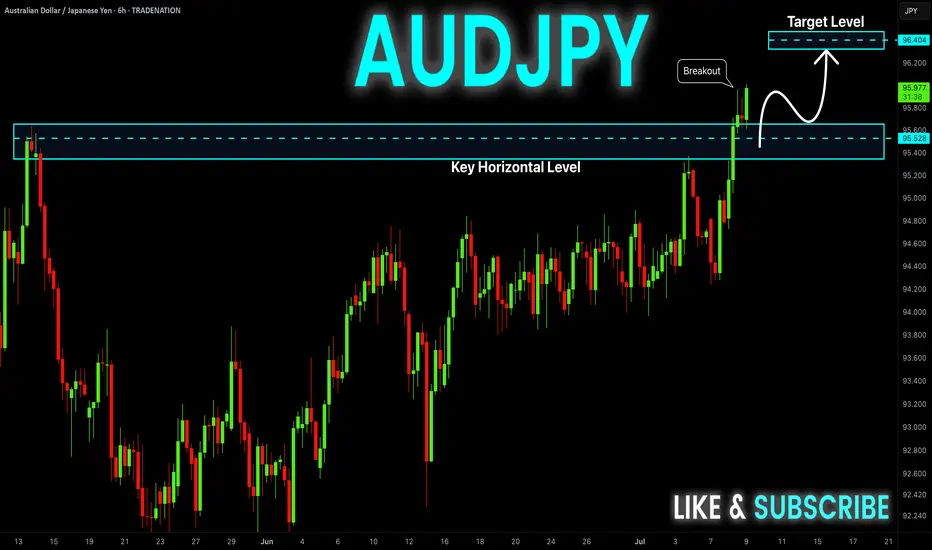
Breakout of the key horizontal
Level of 95.600 and the breakout
Is confirmed so we are bullish
Biased and further growth
Is to be expected
LONG🚀
✅Like and subscribe to never miss a new idea!✅
Disclosure: I am part of Trade Nation's Influencer program and receive a monthly fee for using their TradingView charts in my analysis.
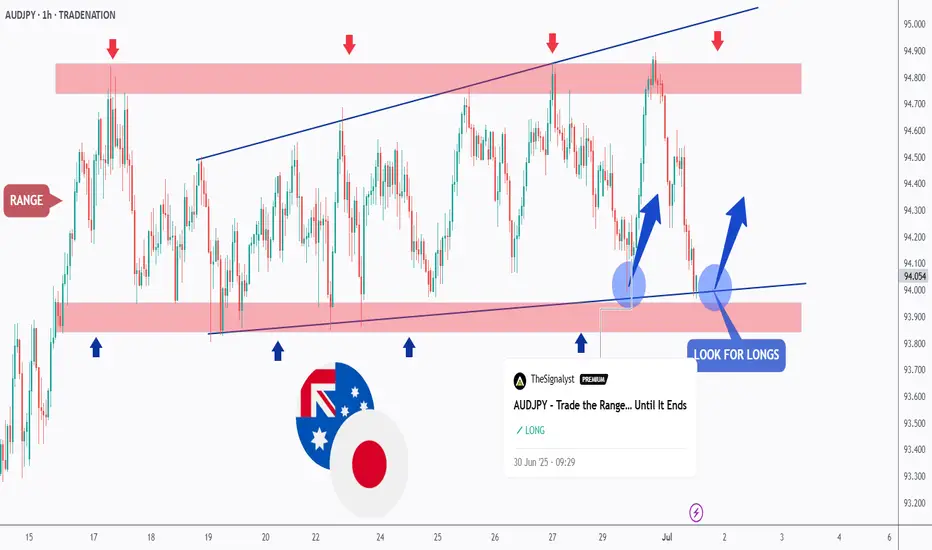
AUDJPY - let's do it again!Hello TradingView Family / Fellow Traders. This is Richard, also known as theSignalyst.
As per our last AUDJPY analysis (attached on the chart), it rejected the first blue circle zone and surged in a parabolic manner.
📈AUDJPY is currently retesting the intersection of the blue trendline and red support.
📚 As per my trading style:
As #AUDJPY is around the latest blue circle zone, I will be looking for bullish reversal setups (like a double bottom pattern, trendline break , and so on...)
📚 Always follow your trading plan regarding entry, risk management, and trade management.
Good luck!
All Strategies Are Good; If Managed Properly!
~Rich
Disclosure: I am part of Trade Nation's Influencer program and receive a monthly fee for using their TradingView charts in my analysis.
AUD_JPY RISKY SHORT|
✅AUD_JPY is set to retest a
Strong resistance level above at 95.600
After trading in a local uptrend for some time
Which makes a bearish pullback a likely scenario
With the target being a local support below at 95.081
SHORT🔥
✅Like and subscribe to never miss a new idea!✅
Disclosure: I am part of Trade Nation's Influencer program and receive a monthly fee for using their TradingView charts in my analysis.
AUD-JPY Bullish Breakout! Buy!
Hello,Traders!
AUD-JPY is trading in a
Strong uptrend and the pair
Made a bullish breakout of
The key horizontal level
Of 95.650 which is now a
Support and the breakout
Is confirmed so we are bullish
Biased and we will be expecting
A further bullish move up
Buy!
Comment and subscribe to help us grow!
Check out other forecasts below too!
Disclosure: I am part of Trade Nation's Influencer program and receive a monthly fee for using their TradingView charts in my analysis.
AUDJPY SHORT FORECAST Q3 D8 W28 Y25AUDJPY SHORT FORECAST Q3 D8 W28 Y25
Professional Risk Managers👋
Welcome back to another FRGNT chart update📈
Diving into some Forex setups using predominantly higher time frame order blocks alongside confirmation breaks of structure.
Let’s see what price action is telling us today! 👀
🔑 Remember, to participate in trading comes always with a degree of risk, therefore as professional risk managers it remains vital that we stick to our risk management plan as well as our trading strategies.
📈The rest, we leave to the balance of probabilities.
💡Fail to plan. Plan to fail.
🏆It has always been that simple.
❤️Good luck with your trading journey, I shall see you at the very top.
🎯Trade consistent, FRGNT X
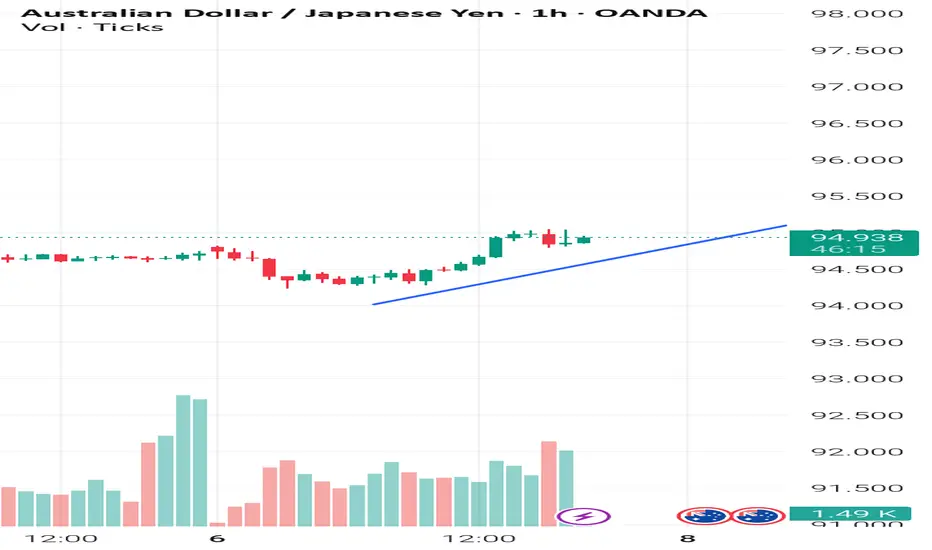
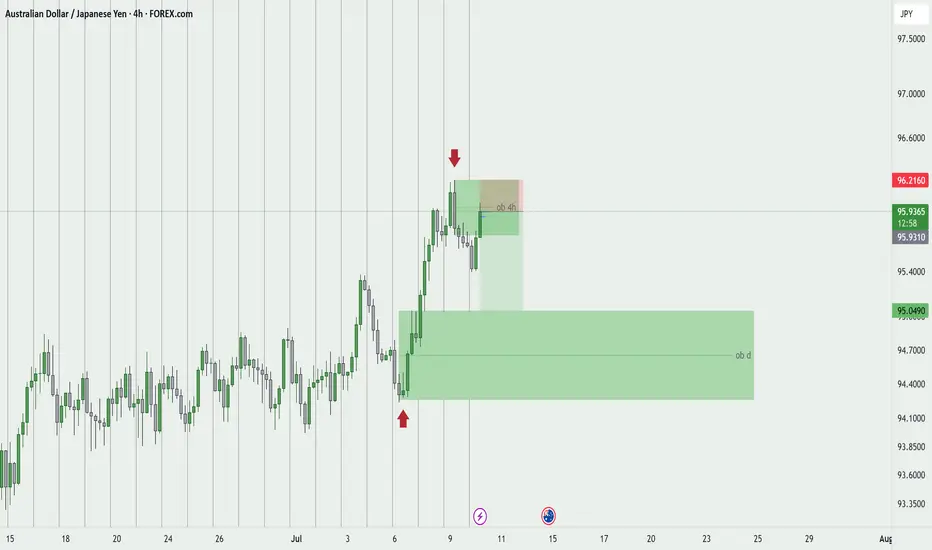
AUDJPY 4Hour TF - July 6th, 2025AUDJPY 7/6/2025
AUDJPY 4hour Neutral Idea
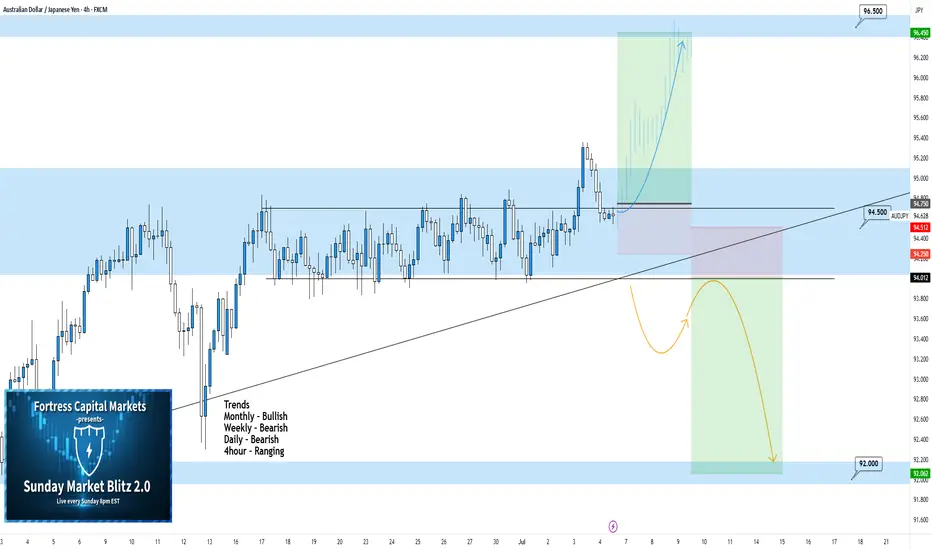
Monthly - Bullish
Weekly - Bearish
Dailly - Bearish
4hour - Ranging
We’re getting some mixed signals here on AJ so i’ll keep this as a neutral idea as we need more info from price action. Most of the major trends seem bearish but the 4hour trend seems to have some bullish pressure. Let’s see how this could play out this week:
Bullish Breakout - We already saw a pretty significant bullish attempt to break out of this range around 94.500. If we can spot some bullish conviction, now that we're retesting what seems to be a broken range, then we can confirm a bullish 4hour trend and prepare for potential long scenarios. I’ll be looking higher toward key resistance around 96.500 if this happens.
Bearish Breakout - For us to consider comfortable bearish scenarios, we would need to see price action fall back through our 94.500 zone and form a lower high. If we see structure formed below 94.500 we can begin targeting lower for potential short positions. Look toward key support levels as targets.
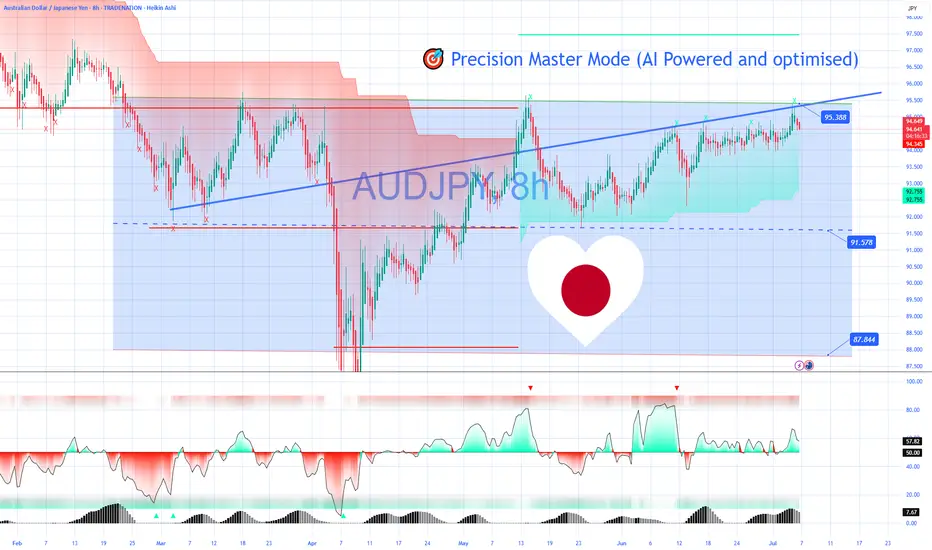
The Chart Says ''Cheer Up Japan'' – JPY Looks Safe📊🇯🇵 The Chart Says "Cheer Up Japan" – JPY Looks Safe 💙✨
There’s been talk, worry, even viral prophecy this week… but I’m here to say:
I read charts — not fear.
And right now, the JPY is showing strength, not weakness.
After running a full scan with my AI-powered Precision Master Mode, the cleanest trade setup aligned with this view is:
AUDJPY SHORT 📉
🗾 Cheer up, Japan — the Yen’s got this.
No panic in the charts. Just structure, volume, and momentum confirming that JPY is holding its ground as a safe-haven currency.
🔍 TRADE SETUP – AUDJPY SHORT
ENTRY: Market (or 94.85 for better R:R)
STOP LOSS: 95.70 (above trap high)
TARGETS:
TP1: 93.50
TP2: 91.57
TP3: 87.84 (macro target)
📈 What the chart shows:
– Strong rejection from top channel zone (structure is King!)
– SuperTrend flip starting on multiple TFs
– VWRSI fading = momentum loss
– Volume Profile confirms resistance
So while the headlines play on emotions, my execution comes from structure.
Let’s ride this JPY strength into next week — calmly, confidently.
📸 Chart attached (8H view – AI tuned)
📰 Article on the 'prophecy' that sparked the buzz:
www.telegraphindia.com
Have a nice weekend Japan and all Asia! After a 'scary prophecy' troubling your minds the weekend can end up being a crazy happy one!
One Love,
The FXPROFESSOR 💙
Disclosure: I am happy to be part of the Trade Nation's Influencer program and receive a monthly fee for using their TradingView charts in my analysis. Awesome broker, where the trader really comes first! 🌟🤝📈
AUDJPY LONG????OANDA:AUDJPY showing resilience at channel support (94.50).
Multi-year uptrend intact with price bouncing from lower boundary. Current consolidation above 94 suggests strength.
Watch for continuation toward 100 resistance. #forex #technicalanalysis
AudjpyAudjpy now i think going in bearish trend 4h because , 4h is market structur shift and back in Ooderblock 4h and in daily it first candle bearish and take profit is Orderblock Daily
RR 1:3
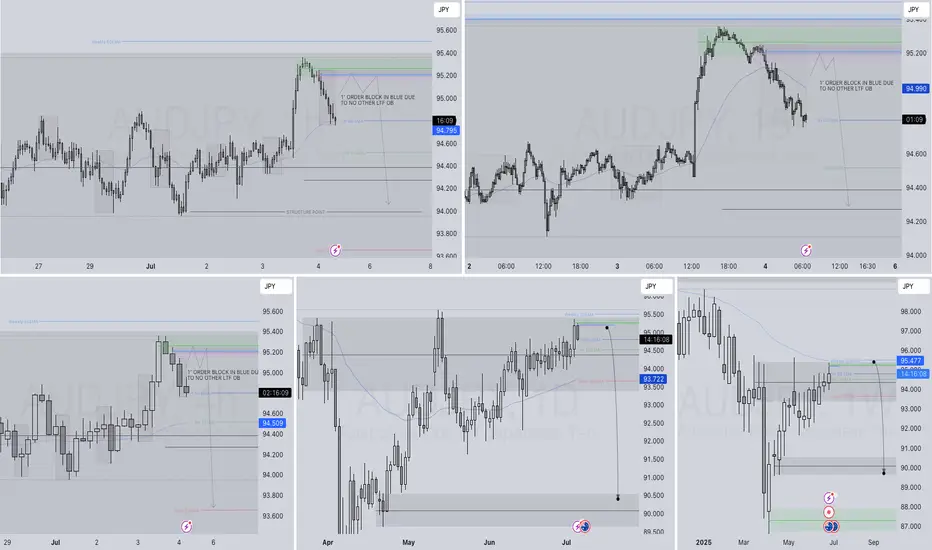
AUDJPY SHORT FORECAST Q3 W27 D4 Y25AUDJPY SHORT FORECAST Q3 W27 D4 Y25
Professional Risk Managers👋
Welcome back to another FRGNT chart update📈
Diving into some Forex setups using predominantly higher time frame order blocks alongside confirmation breaks of structure.
Let’s see what price action is telling us today! 👀
💡Here are some trade confluences📝
✅Weekly Order Block Identified
✅Daily Order block identified
✅4H Order Block identified
✅15' Order block identified
🔑 Remember, to participate in trading comes always with a degree of risk, therefore as professional risk managers it remains vital that we stick to our risk management plan as well as our trading strategies.
📈The rest, we leave to the balance of probabilities.
💡Fail to plan. Plan to fail.
🏆It has always been that simple.
❤️Good luck with your trading journey, I shall see you at the very top.
🎯Trade consistent, FRGNT X
AUD/JPY pair exhibits a strong buy signalThe AUD/JPY cross attracts some buyers around 94.50 during the Asian session on Wednesday. The Japanese Yen edges lower against the Aussie following domestic weaker than expected inflation data for May as the relative interest rate differentials between the two currencies will play a crucial role in determining the AUD/JPY direction.
From a technical perspective, the AUD/JPY appears poised to test higher prices in the short term. The Relative Strength Index (RSI) is bullish, while price action posting a series of higher lows, despite lacking higher highs, could pave the way for challenging the 95.00 figure. A breach of the latter will expose the April 2 high of 95.30, followed by the May 13 swing high of 95.64.
Conversely, a reversal that drives AUD/JPY below the June 30 swing low of 93.98 could sponsor a drop to challenge a seventh month-old support trendline near 93.50/75. If cleared, down lies 93.00.
The forecasts provided herein are intended for informational purposes only and should not be construed as guarantees of future performance. This is an example only to enhance a consumer's understanding of the strategy being described above and is not to be taken as Blueberry Markets providing personal advice.
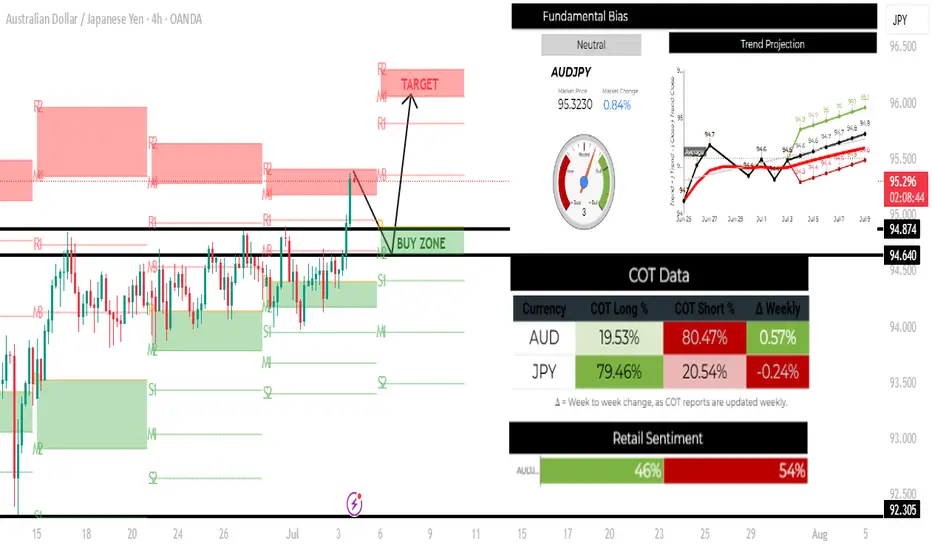
AUDJPY H4 LONG SETUPTECHNICAL ANALYSIS
This week AUDJPY broke out of the range to the upside. The price is currently at the weekly target. Given that it's Thursday and the end of the week is approaching, a possible take profit could occur from now until the end of Friday.
Support is at the previous resistance price level of 94.830, which is now the future buy zone. I will wait for the price to drop to this level before considering a long position.
FUNDAMENTAL ANALYSIS
Institutional traders are long JPY(79.46%) and Short AUD(80.47%) according to the COT data, which means long term it's possible to see a stronger JPY and weaker AUD.
Retail traders are short JPY(54%) and long AUD(46%). The strength meter is slightly tilted in favour of JPY strength.
Although institutional traders are long JPY, the technicals, however, show that a possible bullish trend is beginning, so while keeping that in mind, the current price and market direction are bullish in favour of AUD.
Live trade: AUD JPY long Entry 95.71
Nothing has happened to alter my 'risk in bias'. A, I've been waiting for a 'nice but of support' to place a stop loss behind. And I'm comfortable with the 1hr swings that have formed.
It's a 20 pip stop loss with 30 pip profit target.
The risk to the trade is a fresh bout of negative sentiment
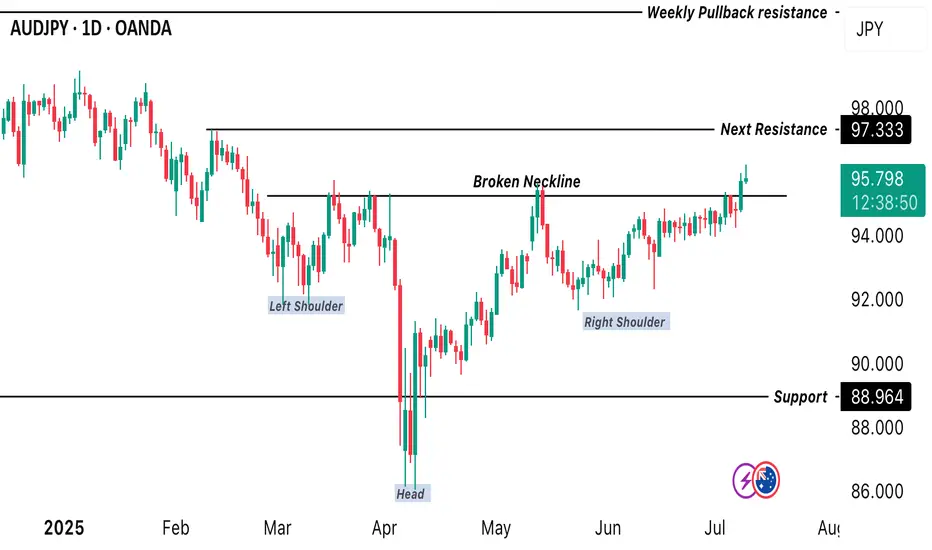
Inverse head and shoulder pattern in AUDJPY - Daily Timeframe!Price just formed an inverse head and shoulder pattern in daily timeframe. Technically, this validates a chance of seeing more bullish price action development. Next resistance will be at 97.333 The higher timeframe (monthly) remains bullish so we’re expecting more of the bullish trend to continue.