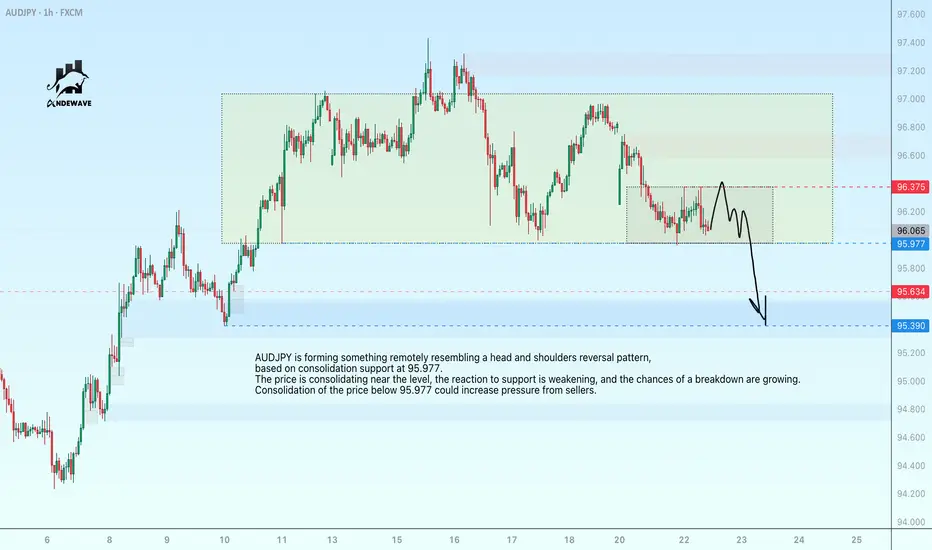
AUDJPY may reverse its upward trendAUDJPY is forming something remotely resembling a head and shoulders reversal pattern, based on consolidation support at 95.977. The price is consolidating near the level, the reaction to support is weakening, and the chances of a breakdown are growing. Consolidation of the price below 95.977 could increase pressure from sellers.
In addition, the fall of the dollar is causing the Japanese yen to strengthen, which could lead to a fall in the AUDJPY currency pair.
AUDJPY trade ideas
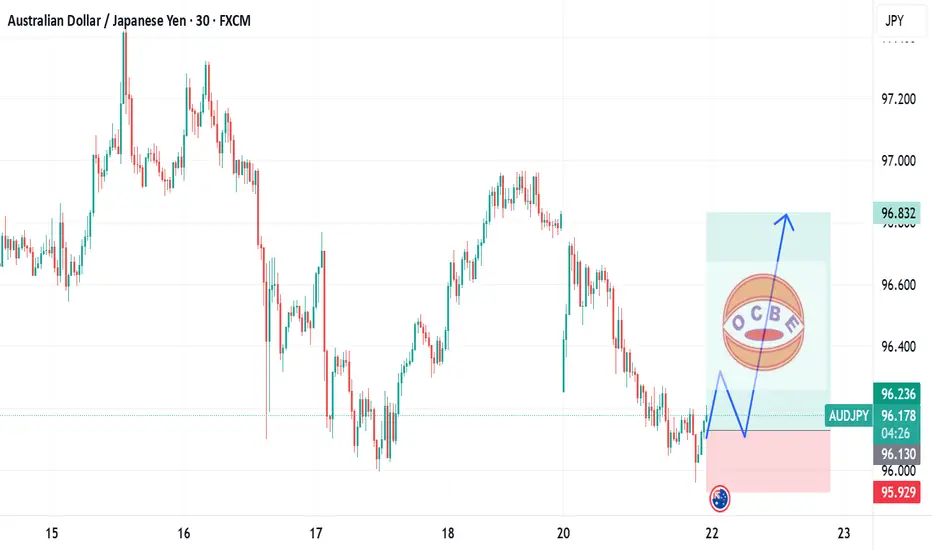
AUDJPY long movePrice had reached our demand zone and reacted bullishly and hence price cloud continues to move upward from the current level.
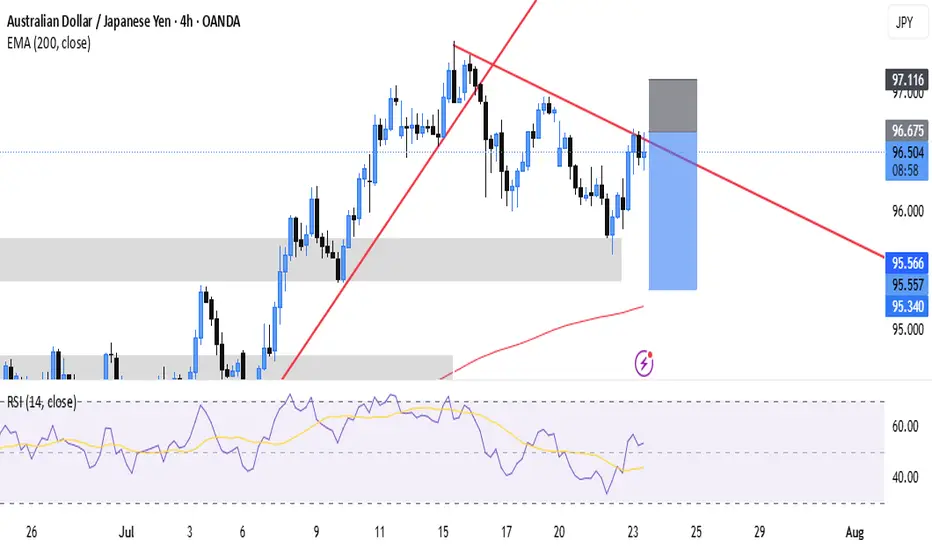
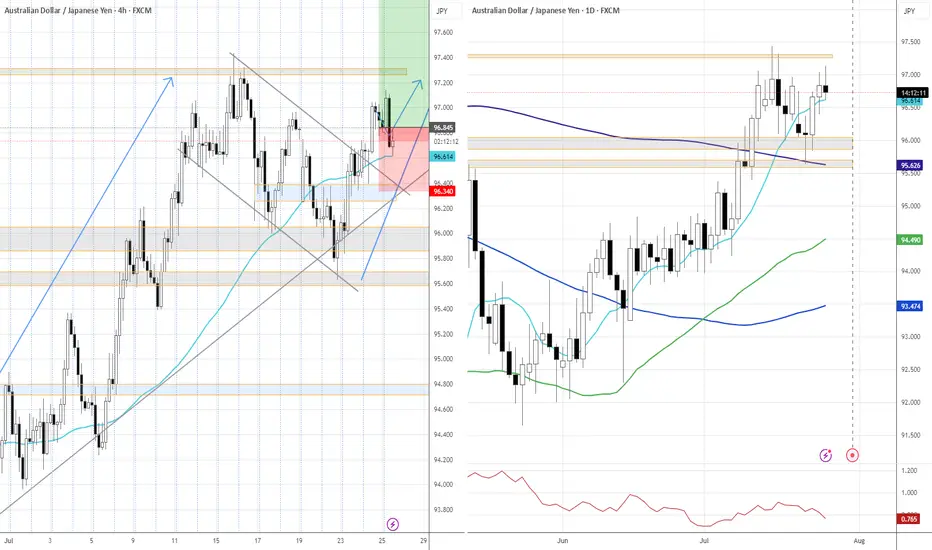
AUDJPY Wave Analysis – 23 July 2025- AUDJPY reversed from support zone
- Likely to rise to resistance level 97.40
AUDJPY currency pair recently reversed up from the support zone located between the pivotal support level 95.55 (former monthly high from March and May), 20-day moving average and support trendline of the daily up channel from May.
This support zone was further strengthened by the 38.2% Fibonacci correction of the upward impulse from June.
AUDJPY currency pair can be expected to rise to the next resistance level 97.40, former monthly high from February, which also stopped the earlier impulse wave earlier this month.

AUDJPY BEARISHTechnically:
AUDJPY printed bearish divergence
AUDJPY broke LL
AUDJPY respecting bearish trendline
AUDJPY retrace which is new LH
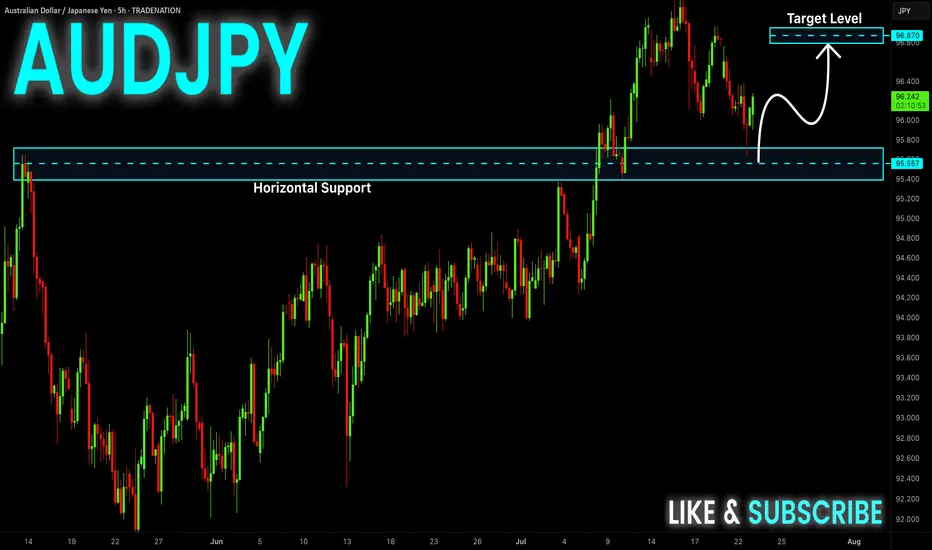
AUD-JPY Will Grow! Buy!
Hello,Traders!
AUD-JPY already made a
Bullish rebound from the
Strong horizontal support
Of 95.610 and as we are
Bullish biased we will be
Expecting a further bullish
Move up
Buy!
Comment and subscribe to help us grow!
Check out other forecasts below too!
Disclosure: I am part of Trade Nation's Influencer program and receive a monthly fee for using their TradingView charts in my analysis.
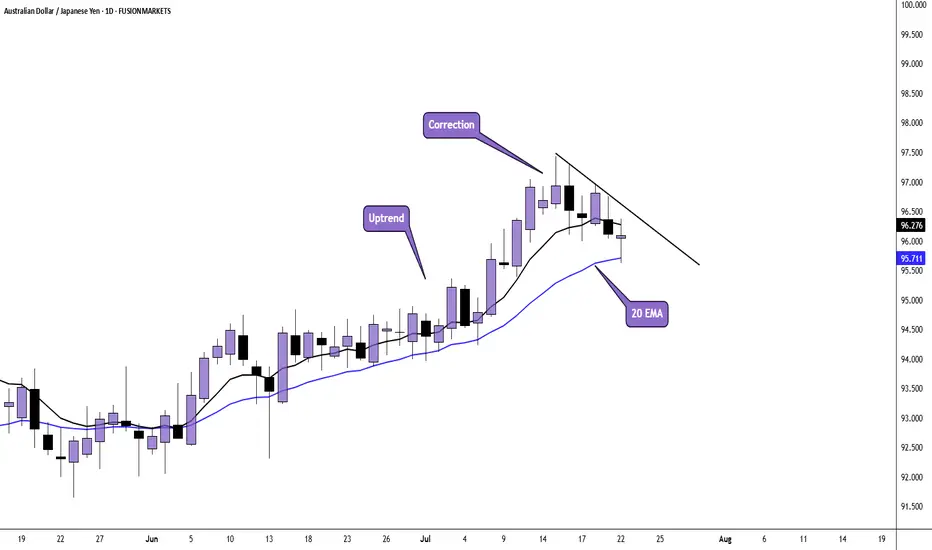
AUD/JPY Daily AnalysisPrice is in a daily uptrend and has pulled back to the 20 EMA.
Price may find support here and could see the next bullish impulse.
Wait for the breakout and a buy setup that meets your strategy rules if you agree.
AUDJPY Buy Stop Setup | Trend Continuation in FocusAUDJPY is in an established uptrend, forming higher highs and higher lows. A buy stop is positioned above the recent swing high to confirm bullish continuation. The setup includes a defined stop-loss below the previous higher low to manage risk and two target profit levels (TP1 & TP2) aligned with key resistance zones. This approach favors trend-following traders seeking confirmation of upward momentum before entry.

idealistic trade of usdchfsharing my insights of the trade that im holding .....hopefull this will educate lot of people out the ....................

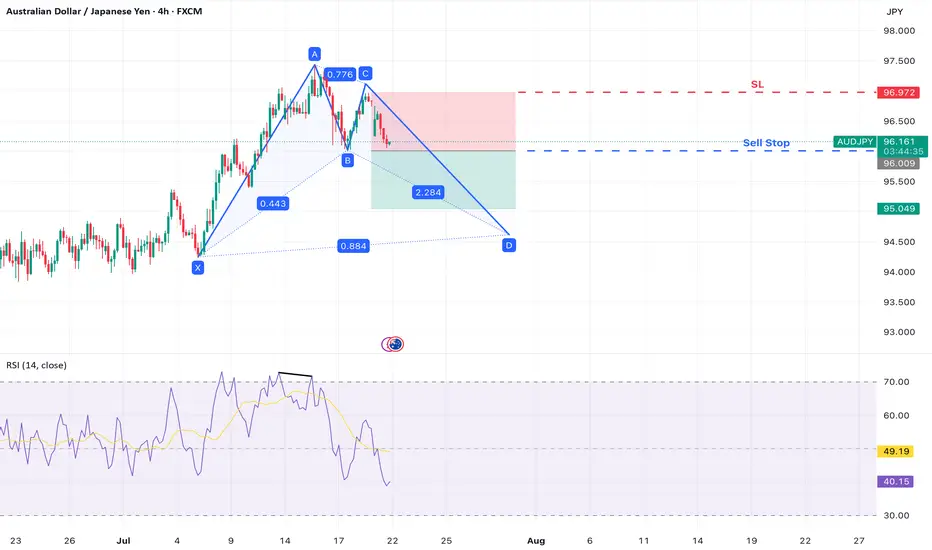
AUD/JPY – Bearish Move Within Bullish Bat StructureAUD/JPY is developing a Bullish Bat harmonic pattern on the 4-hour chart . While the full pattern has not yet completed, a potential short-term bearish opportunity is emerging as the pair begins forming the CD leg.
A clear b earish divergence on the RSI at Point A suggests waning bullish momentum, and a break below Point B may confirm the start of the final leg down toward Point D , completing the harmonic structure.
Trade Setup
Sell Stop Entry: 96.009 (break of Point B – confirms CD leg underway)
Stop Loss: 96.978 (above Point C – invalidates CD leg projection)
Take Profit 1: 95.040 (1:1 risk-to-reward level)
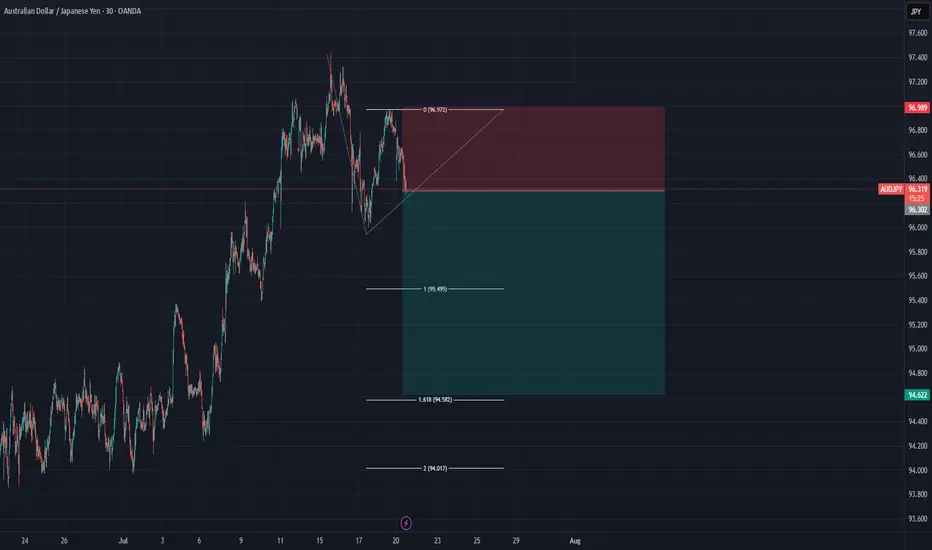
SHORT AUDJPYsell audjpy and target tp 1 at 100% fib level. like i said in my previous chfjpy post that they all had similar movement
AUDJPY 4Hour TF - July 20th,2025AUDJPY 7/20/2025
AUDJPY 4hour Bullish Idea
Monthly - Bullish
Weekly - Bearish
Dailly - Bullish
4hour - Bullish
We’re looking mostly bullish on AJ going into this week but will this 96.500 hold as support? Let’s take a look at two potential scenarios for the week ahead:
Bullish Continuation - This is the most likely for AU this week according to the trends in play. For us to get confident in long scenarios, we would like to see strong bullish rejection from support around 96.500. If this happens look to target higher toward our negative fib levels and key resistance.
Bearish Reversal - For us to consider AJ bearish for the week, we would need to see some bearish pressure step in and push us below 96.500. If this happens we only need confirmation in the form of a lower high below 96.500.
Look to target lower toward major support levels like 94.500 area if this happens.

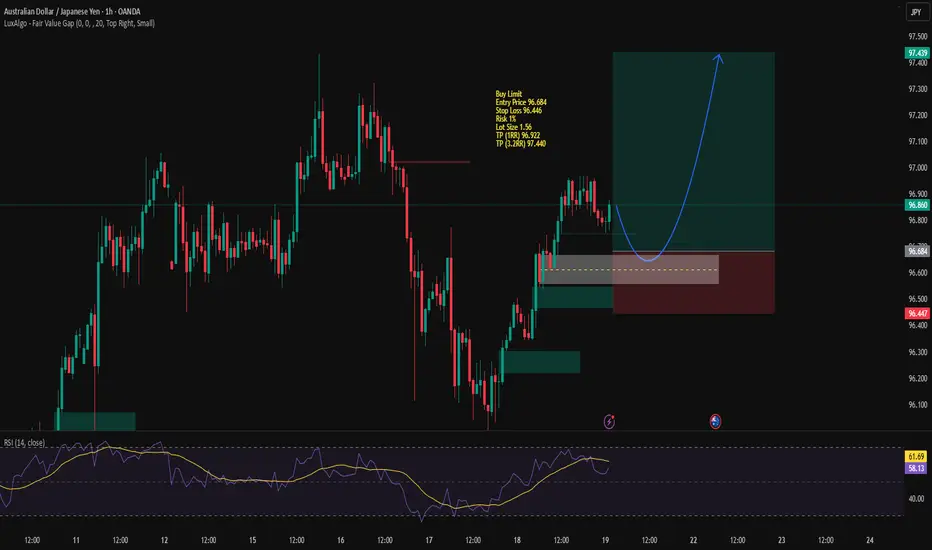
AUDJPY in Uptrend ContinuationBuy Limit
Entry Price 96.684
Stop Loss 96.446
Risk 1%
Lot Size 1.56
TP (1RR) 96.922
TP (3.2RR) 97.440
AUDJPY SELL📉 Technical Analysis – AUDJPY (Daily Timeframe)
Follow on telegram public channel @Forexzorexpublic
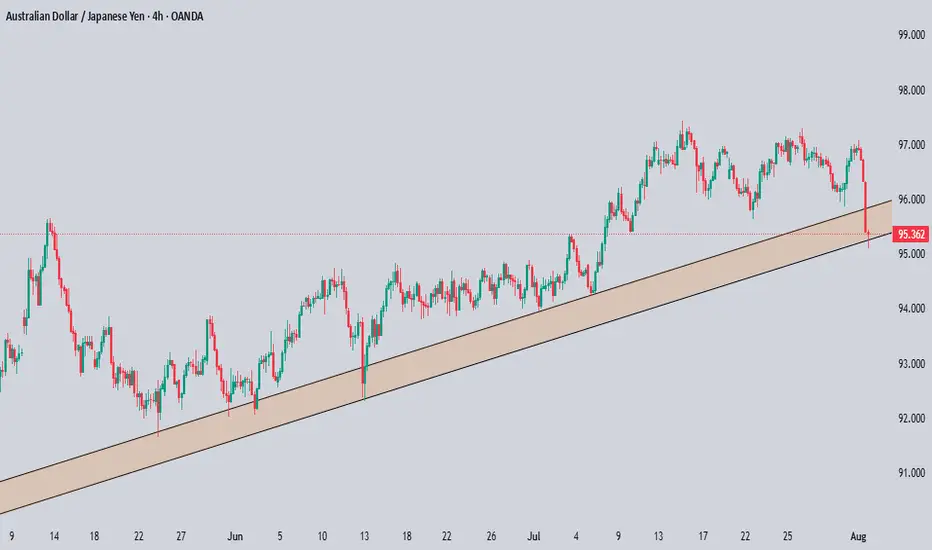
The pair has been moving within an ascending channel for months, but is now showing clear selling pressure after rejecting the upper boundary.
Price is heading toward key support at 94.308, which aligns with the lower edge of the channel — a potential rebound zone.
🔽 Expected Move: Bearish toward 94.308
🔄 Watch: A daily close below this support could signal a deeper correction
📌 Currently on watchlist — no entry recommended until a confirmation candle appears.
Follow on telegram public channel @Forexzorexpublic

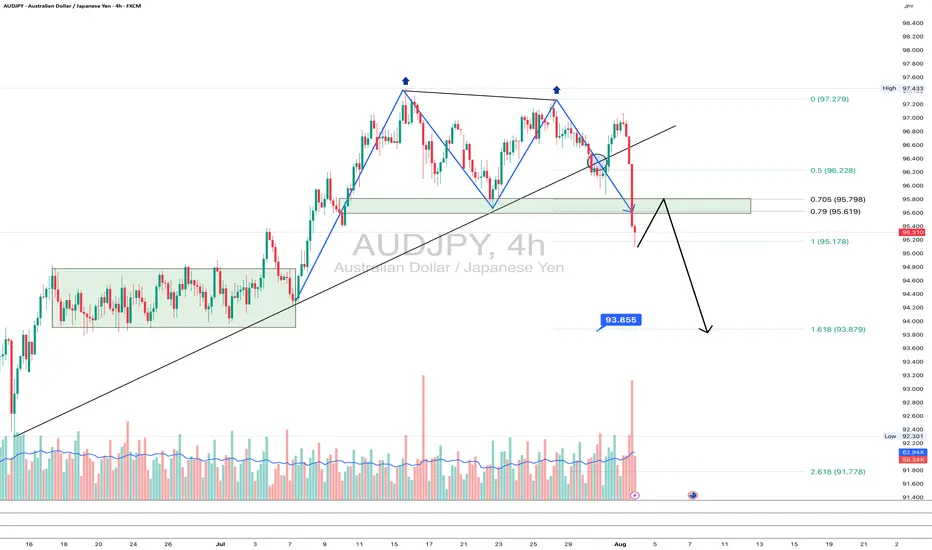
AUDJPY: goodbye uptrend?On the 4H chart, AUDJPY has printed a textbook double top pattern, breaking the rising trendline and diving below the 95.6–95.78 support zone - now acting as resistance. The pair is currently retesting this zone from below, which often provides a clean re-entry point for bears.
This area also aligns with the 0.705–0.79 Fibonacci retracement, reinforcing it as a key resistance. If the price rejects this zone, the next target is 93.85 (1.618 Fibo projection), followed by 93.25 and potentially 91.71 if momentum strengthens.
Fundamentally, the yen gains strength on risk-off flows and diverging rate expectations, while the Australian dollar is pressured by falling commodity prices and a likely pause from the RBA. This widens the rate differential and weakens AUD.
As long as price remains below 95.78, sellers are in control. Watch for a rejection from this retest zone.
AUDJPY Technical & Order Flow AnalysisOur analysis is based on a multi-timeframe top-down approach and fundamental analysis.
Based on our assessment, the price is expected to return to the monthly level.
DISCLAIMER: This analysis may change at any time without notice and is solely intended to assist traders in making independent investment decisions. Please note that this is a prediction, and I have no obligation to act on it, nor should you.
Please support our analysis with a boost or comment!
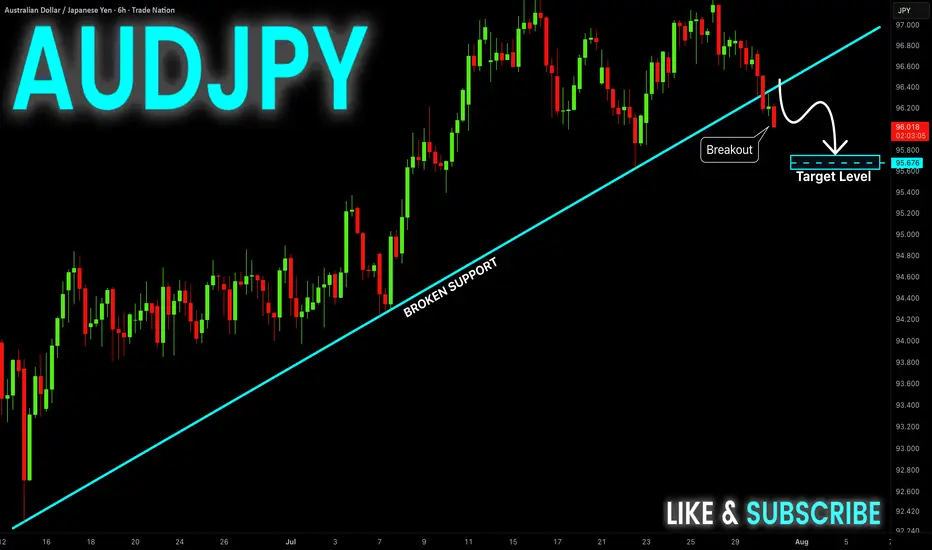
AUD-JPY Bearish Breakout! Sell!
Hello,Traders!
AUD-JPY made a bearish
Breakout of the rising support
Line and we are bearish biased
So we will be expecting a
Further bearish move down
Sell!
Comment and subscribe to help us grow!
Check out other forecasts below too!
Disclosure: I am part of Trade Nation's Influencer program and receive a monthly fee for using their TradingView charts in my analysis.
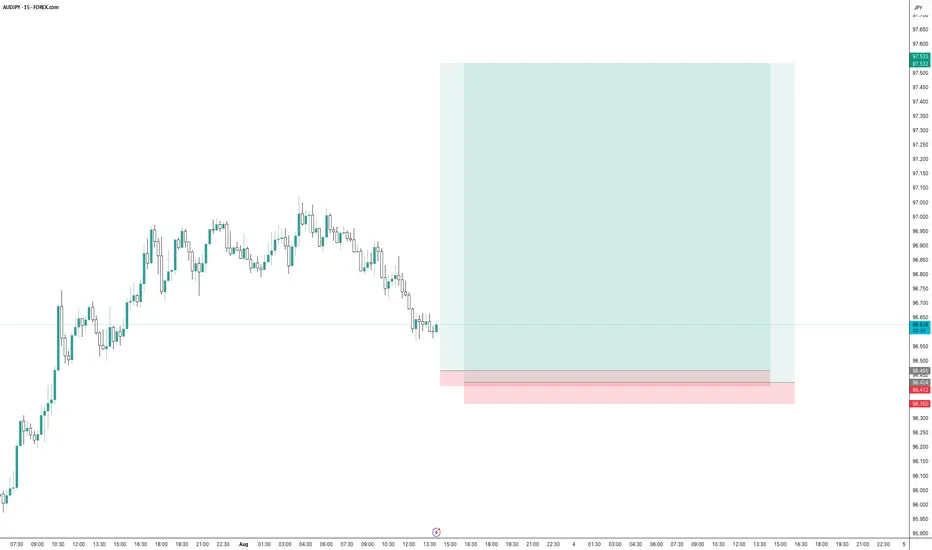
AUDJPY - Looking To Sell Pullbacks In The Short TermM15 - Strong bearish move.
No opposite signs.
Currently it looks like a pullback is happening.
Expecting bearish continuation until the two Fibonacci resistance zones hold.
If you enjoy this idea, don’t forget to LIKE 👍, FOLLOW ✅, SHARE 🙌, and COMMENT ✍! Drop your thoughts and charts below to keep the discussion going. Your support helps keep this content free and reach more people! 🚀
--------------------------------------------------------------------------------------------------------------------

AUDJPY 24.07.2025+~ RBA is relatively hawkish
+~ Political uncertainty around JPY
+~ Positive trade deals anticipation
*Swing trade; giving a room for a reasonable pullback; will potentially look to scale in at the resolve of a newly-formed structure.
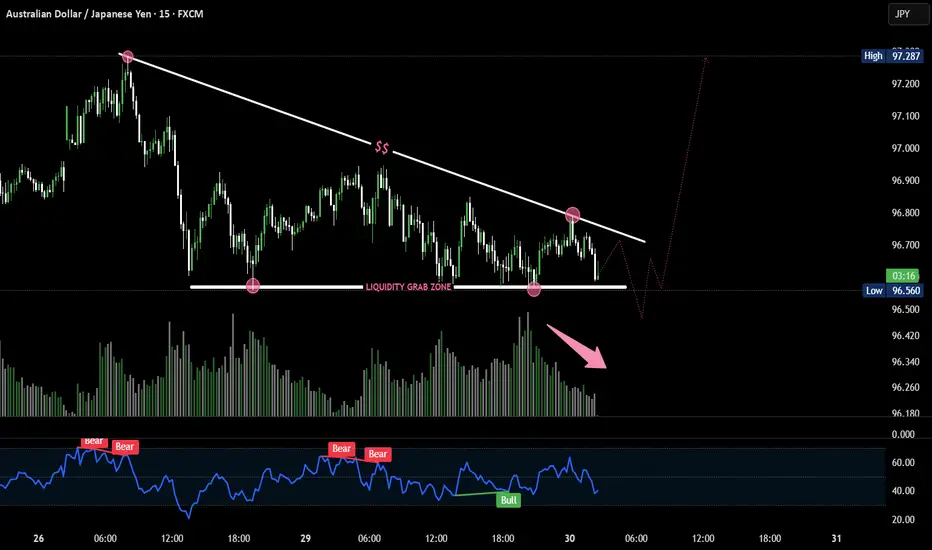
AUD/JPY Poised for Breakout After Liquidity Trap? 🔍 Key Observations:
🔻 Trendline resistance holding strong, forming lower highs.
📉 Sell-side liquidity resting just below horizontal support (marked zone).
💧 Price dipped into liquidity grab zone twice — sign of stop hunt.
🔁 Classic accumulation schematic forming — repeated sweeps before potential breakout.
📊 Volume divergence: Selling pressure weakening while liquidity is swept.
📉 RSI shows bullish divergence (price making lower lows, RSI making higher lows).
🔁 Rejection at RSI 40-level could indicate a bounce.
📈 Expectation:
One more fake breakdown below 96.500 could trigger aggressive buying — setting up a potential parabolic move toward 97.200+ if breakout occurs.
AUDJPY TRADE IDEA UPDATE AUDJPY also made a pullback to our Fibonacci level and has made a move to the upside.
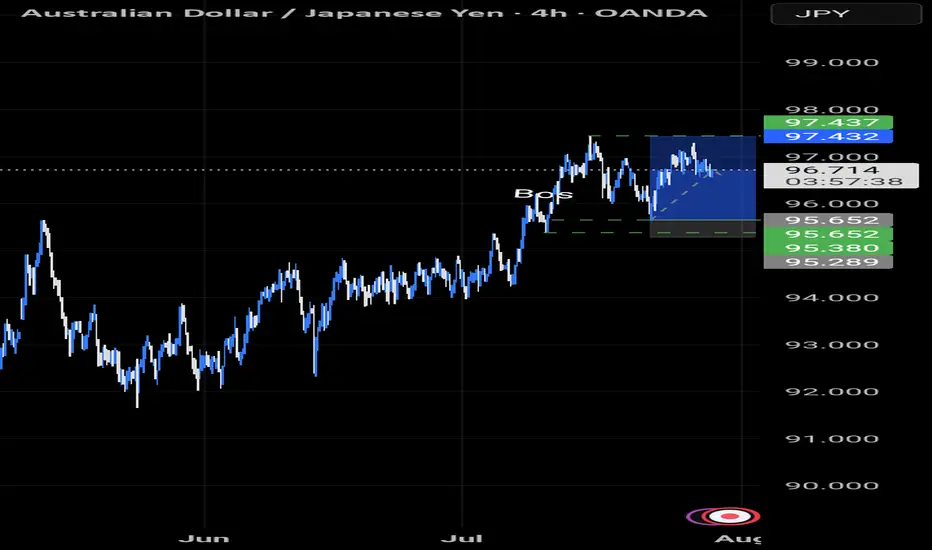
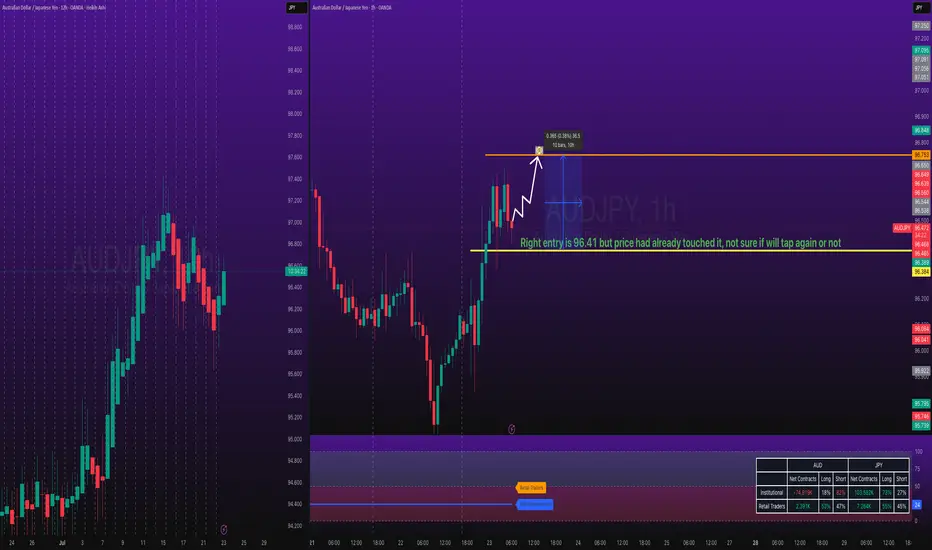
AUDJPY Long TradeOANDA:AUDJPY Long Trade.
Entry price is already tapped in, I checked chart late, TP is intact, you can take little risk if you can afford.
Note: Manage your risk yourself, its risky trade, see how much your can risk yourself on this trade.
Don't be greedy.
Use proper risk management
Looks like good trade.
Lets monitor.
Use proper risk management.
Disclaimer: only idea, not advice
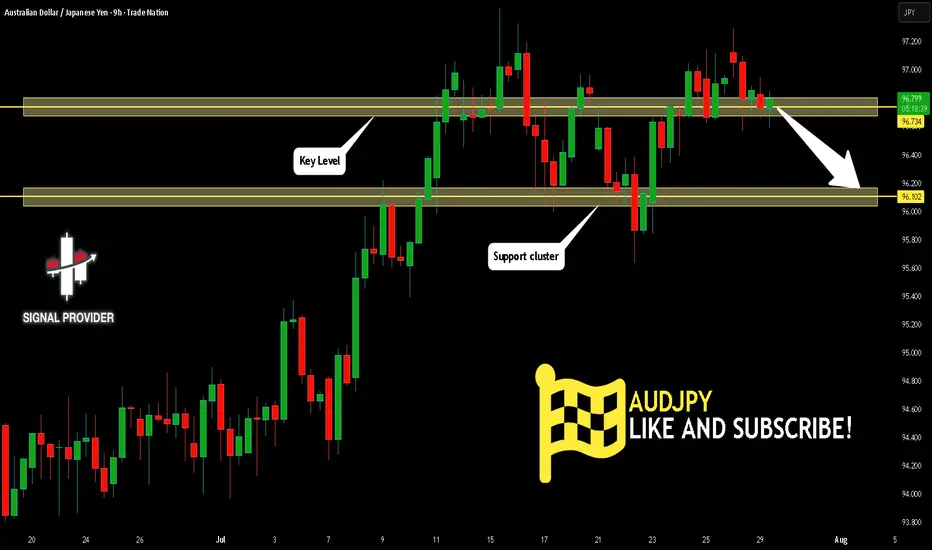
AUDJPY Will Go Lower! Sell!
Take a look at our analysis for AUDJPY.
Time Frame: 9h
Current Trend: Bearish
Sentiment: Overbought (based on 7-period RSI)
Forecast: Bearish
The price is testing a key resistance 96.734.
Taking into consideration the current market trend & overbought RSI, chances will be high to see a bearish movement to the downside at least to 96.102 level.
P.S
Overbought describes a period of time where there has been a significant and consistent upward move in price over a period of time without much pullback.
Disclosure: I am part of Trade Nation's Influencer program and receive a monthly fee for using their TradingView charts in my analysis.
Like and subscribe and comment my ideas if you enjoy them!