AUDJPY Will Go Lower! Sell!
Take a look at our analysis for AUDJPY.
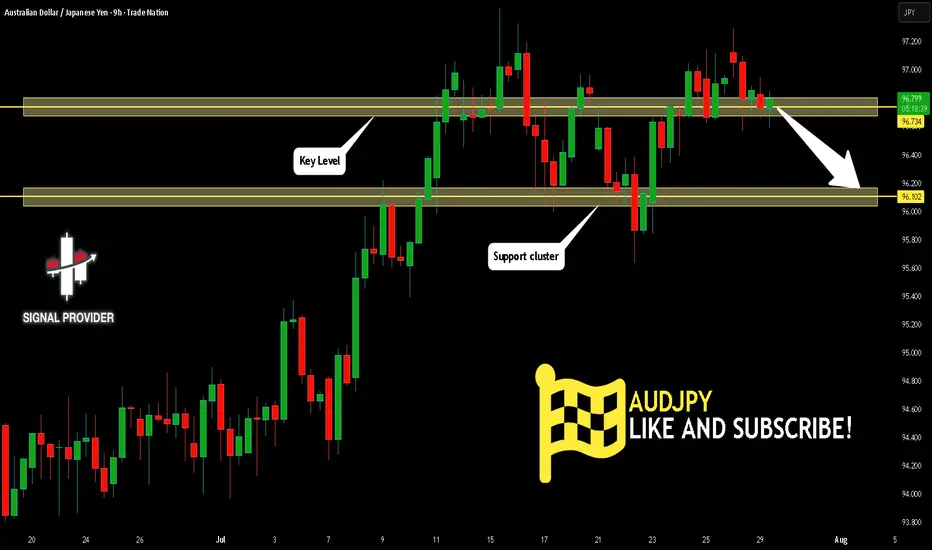
Time Frame: 9h
Current Trend: Bearish
Sentiment: Overbought (based on 7-period RSI)
Forecast: Bearish
The price is testing a key resistance 96.734.
Taking into consideration the current market trend & overbought RSI, chances will be high to see a bearish movement to the downside at least to 96.102 level.
P.S
Overbought describes a period of time where there has been a significant and consistent upward move in price over a period of time without much pullback.
Disclosure: I am part of Trade Nation's Influencer program and receive a monthly fee for using their TradingView charts in my analysis.
Like and subscribe and comment my ideas if you enjoy them!
AUDJPY trade ideas
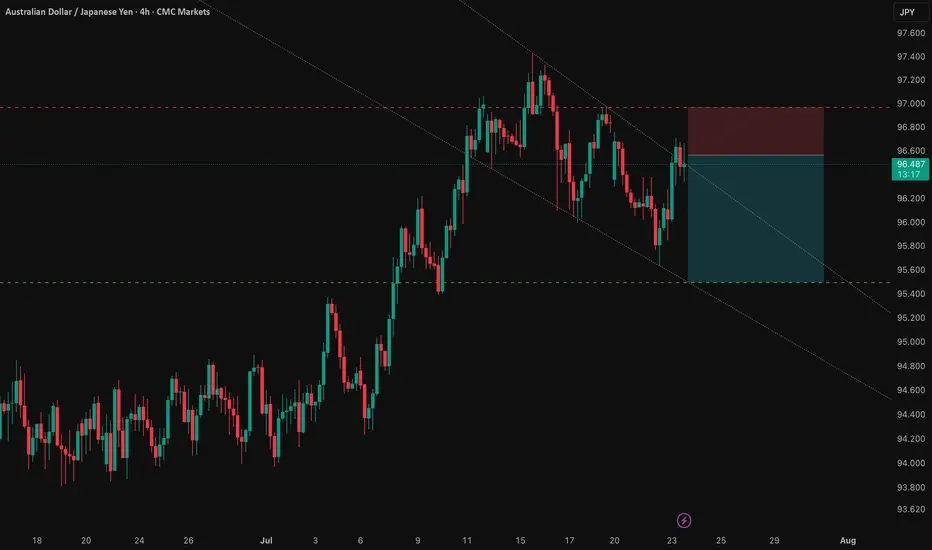
AUDJPY Retest H4 resistance The AUD/JPY currency pair appears poised to potentially extend its current bearish trajectory, particularly as the price action has recently reacted to an unmitigated order block situated around the 97.00 level. This specific price zone could act as a significant area of supply, triggering renewed selling pressure that may drive the pair lower. Should bearish momentum persist, it’s plausible that the price could descend toward the 96.00 region as an initial target. Furthermore, if sellers maintain control and market sentiment remains risk-averse, the downward movement could intensify, possibly resulting in a break below the key support area near 95.500—effectively sweeping liquidity beneath that level and opening the door for even deeper retracements.
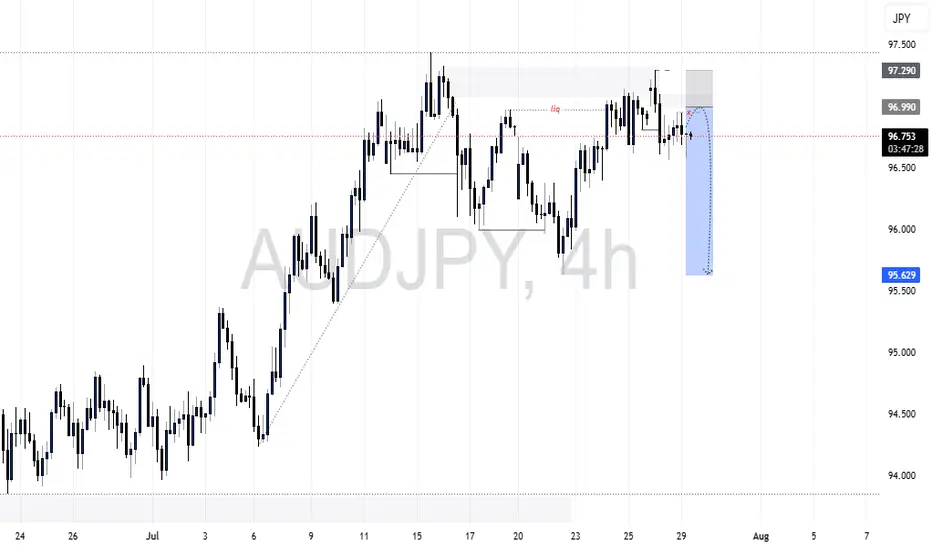
AUDJPY Double Top at Supply Zone – Bearish Move to 96.10?AUDJPY – Bearish Bias
- Pattern: Double Top + Supply Zone Rejection
- Current Price: Around 96.65
- Expected Target: 96.10
- The chart shows a double top pattern near the supply zone, signaling potential weakness.
- Price failed to break above the supply area twice, creating bearish sentiment.
- A pullback towards resistance followed by rejection could trigger a move down to 96.10.

AUDJPY RETEST SUPPORT AUDJPY sweeps liquidity and retests support hopefully it continues the uptrend towards 97.430

AUDJPY 4Hour TF - July 27th, 2025AUDJPY 7/27/2025
AUDJPY 4hour Bullish Idea
Monthly - Bullish
Weekly - Bullish
Dailly - Bullish
4hour - Bullish
We’re looking bullish again on AUDJPY for the week ahead, but will it stick? The overall higher timeframes suggest we are bullish as well but we will need to see key structure before entering any trades. Let’s take a look at two potential scenarios we would want to see happen this week.
Bullish Continuation - We ended last week in a perfect spot, right above our 96.500 zone. This leaves us in a position for a potential long opportunity where we only need to see 1 or two more forms of confirmation.
Look for our 96.500 zone to be tested and held as support. If this happens and we can confirm a higher low above 96.500 we’ll be looking to enter and target higher toward major levels of resistance like 98.650.
Bearish Reversal - For us to consider AJ bearish again we would need to see a strong break below the current zone at 96.500.
Look for signs of structure (LL, LH) to form below the current zone. If this happens we can consider targeting lower toward major levels of support like 94.500

AUD/JPY SENDS CLEAR BEARISH SIGNALS|SHORT
Hello, Friends!
AUD/JPY pair is in the uptrend because previous week’s candle is green, while the price is clearly rising on the 4H timeframe. And after the retest of the resistance line above I believe we will see a move down towards the target below at 96.380 because the pair overbought due to its proximity to the upper BB band and a bearish correction is likely.
Disclosure: I am part of Trade Nation's Influencer program and receive a monthly fee for using their TradingView charts in my analysis.
✅LIKE AND COMMENT MY IDEAS✅

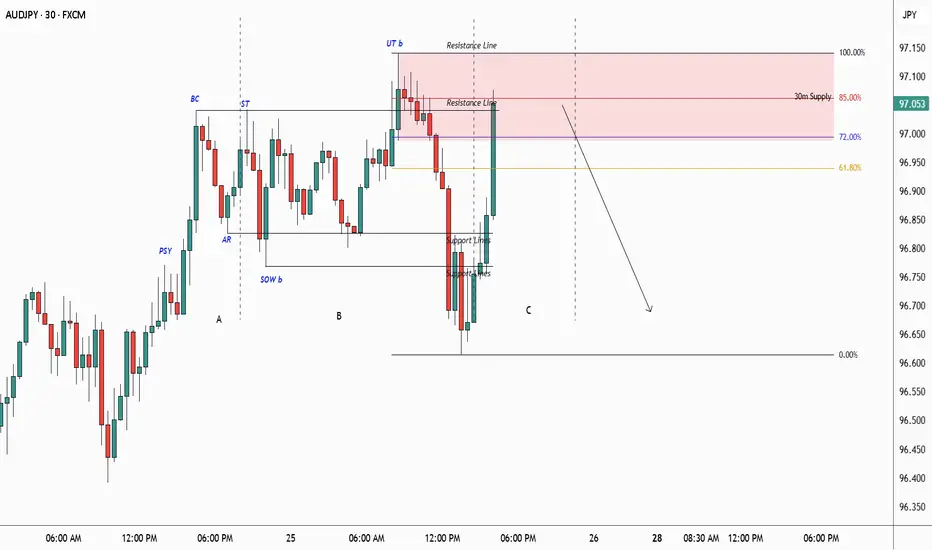
AUDJPY Possible Short set-upPrice is currently forming a possible Distribution Schematic 2 Wyckoff. Also, price may currently form the Phase C of the schematic.
Falling ChannelThe price broke out of a falling channel pattern followed by a pullback, now the price looks to go long after making a higher high
WE ONLY TRADE PULLBACKS

AUDJPY TRADE IDEA AUDJPY traded down to our Fibonacci level and has done it's thing to the upside....

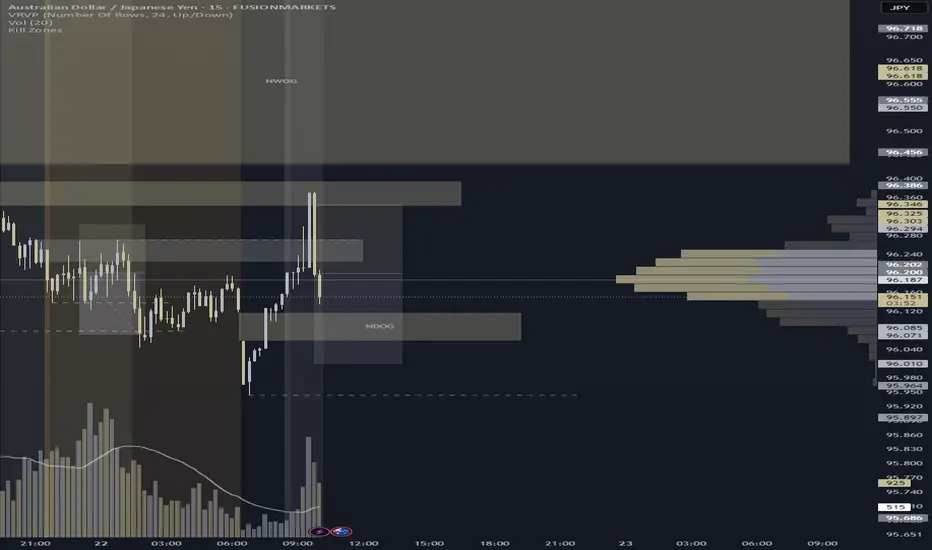
AUDJPY – NDOG & Resistance Zone Campaign
Shorted after clean reaction from NDOG (96.669–96.697) and rejection at my 96.617–96.645 resistance zone. Entered on a strong bearish shift candle with solid volume. TP locked at 96.331, past the 96.439 sellside draw, aiming toward structural liquidity near 96.301. Playbook reminder: structure validated, entry timing needs refinement—early trigger noted. SL hit after engineered volatility, but bias read and magnet zone logic held firm.

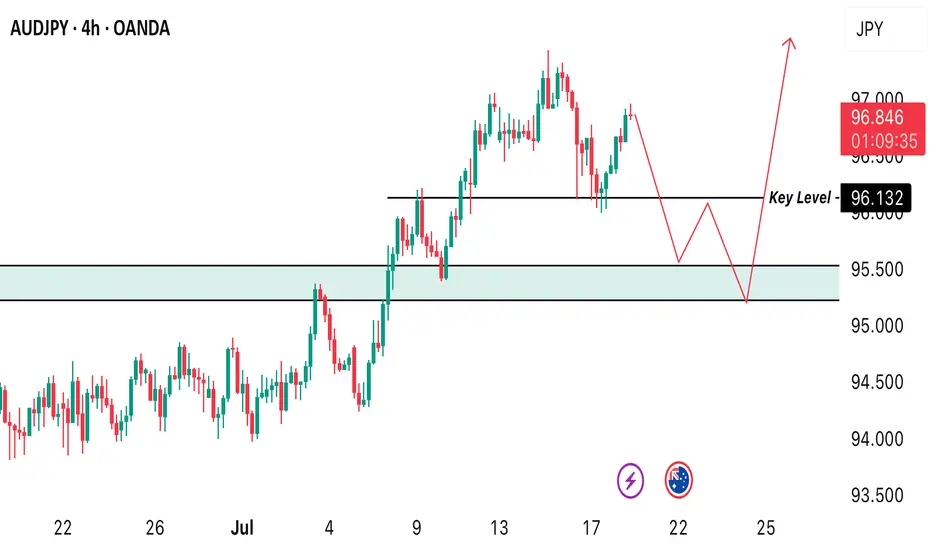
AUDJPY Bullish Order Block In SightOANDA:AUDJPY Price finds Support at the Swing Low @ 95.629 and creates a Swing High @ 96.741!
Based on the ICT Method, the Swing Low broke Sell-Side Liquidity @ 95.995 and opened up a Bullish Order Block Opportunity @ 96.217!
Price is currently working down from 96.49 at the time of publishing but once Price visits the Order Block, this could deliver Long Opportunities!!

AUD/JPY: Capitalizing on the RBA-BoJ Monetary Policy GapThis analysis outlines a compelling short opportunity in AUD/JPY, driven by a powerful confluence of fundamental and technical factors. The trade is strategically positioned ahead of a key catalyst that could unlock significant downside potential.
1️⃣ The Core Thesis: A Clear Policy Divergence
The primary driver behind this trade is the stark and widening gap in monetary policy between the Reserve Bank of Australia (RBA) and the Bank of Japan (BoJ). The RBA is signaling a clear dovish pivot amid a weakening labor market, making an interest rate cut imminent. Conversely, the BoJ is in a tightening phase, creating a fundamental headwind for the AUD relative to the JPY. This divergence underpins the strategic bearish bias.
2️⃣ The Confirmation: Technical Alignment
This fundamental view is supported by a clear technical picture. The pair is in a well-defined downtrend and is currently testing a critical support level. This alignment of fundamental and technical factors presents a clear short opportunity, with the entry positioned for a breakdown below this key juncture.
3️⃣ The Catalyst: The RBA Bulletin
The immediate catalyst for this trade is the upcoming RBA Bulletin on July 24, 2025. Any dovish language from the RBA concerning Australia's economic outlook will likely reinforce expectations for a rate cut and accelerate the downward move in AUD/JPY.
The Trade Setup ✅
Here is the recommended trade setup:
📉 Trade: SHORT AUD/JPY
👉 Entry: 96.56200
⛔️ Stop Loss: 96.96386
🎯 Take Profit: 95.49900
🧠 Risk/Reward Ratio: 2.65
This setup offers a compelling risk-reward profile, capitalizing on a clear and powerful macroeconomic theme. The trade is designed to perform should the expected catalyst confirm the underlying bearish fundamentals.

SYMMETRYHello awesome traders! 👋
Hope you’ve managed to grab some solid pips from the markets this week. As we head into the weekend, I’m wrapping things up by dropping a few clean chart setups for you to review and reflect on.
Enjoy the weekend, recharge well — and I’ll see you sharp and ready next week for more structure-led opportunities.
📌 Pattern Breakdown
We had a beautiful AB=CD symmetry setup, with a slight twist:
🔹 AB = CD structure extended slightly beyond traditional symmetry
🔹 CD stretched into the 127.2% fib projection — a known trap zone
🔹 Price tagged 95.980 and reacted with strong bullish momentum from the PCZ (95.98–95.58)
🔹 This zone also aligned with 161.8% fib extension support = strong confluence
🎯 Target Structure
Following the rejection, price is now rotating upward, moving toward:
✅ Target 1:
• 23.6% = 97.16
• 61.8% = 97.972
📍 Partial TP booked at 23.6%
🧭 Watching price behavior here before deciding whether to continue toward…
🔄 Target 2 Zone:
• 78.6% = 98.508
🧠 Key Concepts in Play
✅ AB=CD symmetry extended to 127.2%
✅ Valid PCZ rejection from confluence zone
✅ Partial profit taken at TP1
✅ Measured continuation play in motion
✅ Structure-led management with clear invalidation
🗝 Final Thoughts
AUDJPY gave us a clean extended symmetry rejection — and now we’re in the follow-through phase. The reaction off the 127% extension shows that even stretched patterns can hold when structure aligns.
We’ve locked some gains at the 23.6% zone and will let the rest play out or reassess early next week depending on price behavior around the 61.8% mark.
“Even when symmetry stretches — the reaction reveals the conviction.”

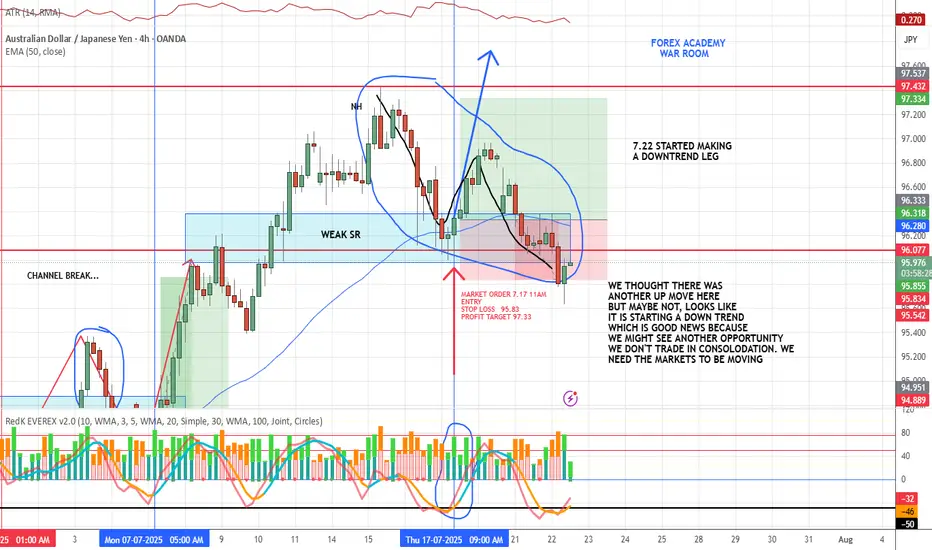
AUD/JPY LOSS❌ AUD/JPY Loss – Market Shifting
We anticipated another move up on AUD/JPY, but price had other plans.
Looks like a new downtrend may be starting—which is actually good news.
We don’t trade in consolidation.
We wait for structure, direction, and alignment.
📌 Movement = opportunity. And we might have a new one setting up soon.
Losses are part of the process. The VMS strategy keeps us focused, patient, and ready for the next valid setup.
Bullish Momentum Builds: Long Setup on AUD/JPYThe AUD/JPY pair has recently broken out of a long-term descending trendline, signaling a strong shift in market structure. This breakout was supported by multiple bullish BOS (Break of Structure) and ChoCH (Change of Character) signals, indicating institutional buying interest. Price has since retested the breakout zone and is showing signs of continuation, now consolidating just below a key supply zone. With momentum building and previous resistance flipping to support, I’ve entered a long position at 95.65, aiming for a clean push toward the next major resistance at 98.13.
This trade setup aligns with the overall bullish sentiment supported by strong volume during recent rallies and the current market structure. The stop loss is set at 94.94, just below a key demand zone, allowing room for healthy retracement without invalidating the setup. MFI remains neutral, giving the pair more upside potential, while the Stochastic suggests short-term consolidation may be nearing completion. If momentum continues to build, a breakout toward the target is highly probable.

Market analysis 7/22/2025Today we look in to AUD and JPY and discuss their fundamentals and also their relative strength. With strength and activity not matching the fundamentals outlined from this weeks and last weeks.
after review it did not appear that fundamentals were being followed currently. We have to respect this and continue to wait for our opportunity.
Bye for now.

AUDJPY – Resistance Rejection Short Into Sellside Draw
Identified a key resistance zone at 96.224–96.273, with price showing rejection and wicking behavior after sweeping buyside liquidity at 96.271. Entered short following a decisive reaction candle. Trade is structured with stop loss above the swing at 96.303 and TP set at 96.010, targeting a clean overshoot of today’s NDOG (95.944).
🔹 Setup: Resistance rejection + liquidity sweep
🔹 Bias: Short into engineered sellside draw
🔹 SL: 96.303 | TP: 96.010
🔹 Narrative: Trap-to-draw execution with structure-backed confirmation
A disciplined short campaign rooted in polarity logic and session magnet flow. Let the market walk its choreography. 🩶
AUDJPY – Resistance Rejection at 96.224–96.273
Executed a disciplined short off the 96.224–96.273 resistance zone, which aligned with bearish structure and rejection candle confirmation. Entry followed lower high formation, with stops placed above the recent swing at 96.303 to allow for volatility breathing room. Target set at 96.079, aligning with a clean sellside draw. Price showed momentum alignment and polarity flip reaction off resistance.
🔹 Strategy: Trap-to-draw execution
🔹 Entry: Post-rejection confirmation
🔹 SL: Above 96.303 swing
🔹 TP: Into 96.079 liquidity magnet
A precise, structure-backed short targeting engineered liquidity

AUD/JPY LIVE TRADE UPDATESwing Trade Update – Gap Down Open
We entered this trade last Thursday based on our VMS swing setup.
When the market opened Sunday, price gapped down against us.
Now we’re watching for:
*Price to find support at this level
*A potential bounce and continuation in trade direction
📌 The gap doesn’t break the setup—structure will tell the truth. Patience required.

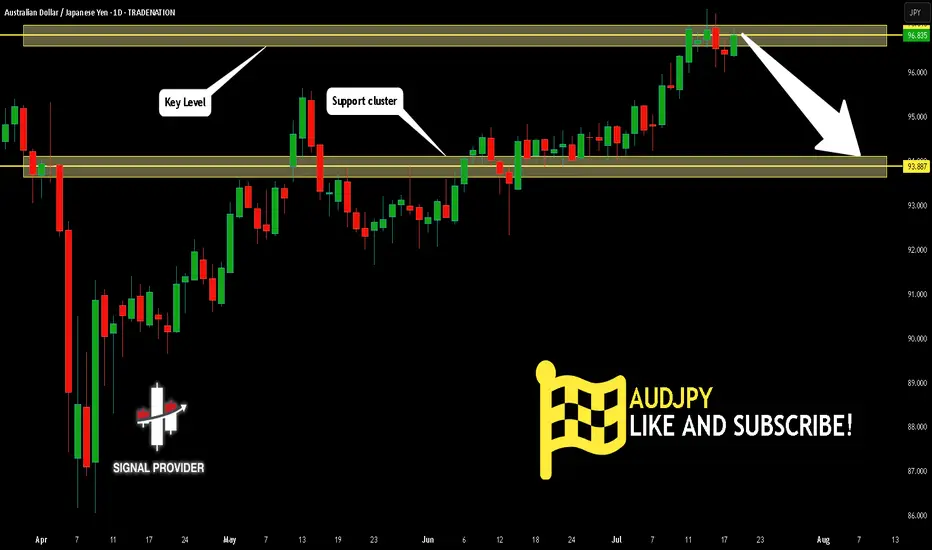
AUDJPY Will Go Lower From Resistance! Sell!
Please, check our technical outlook for AUDJPY.
Time Frame: 1D
Current Trend: Bearish
Sentiment: Overbought (based on 7-period RSI)
Forecast: Bearish
The market is approaching a significant resistance area 96.835.
Due to the fact that we see a positive bearish reaction from the underlined area, I strongly believe that sellers will manage to push the price all the way down to 93.887 level.
P.S
The term oversold refers to a condition where an asset has traded lower in price and has the potential for a price bounce.
Overbought refers to market scenarios where the instrument is traded considerably higher than its fair value. Overvaluation is caused by market sentiments when there is positive news.
Disclosure: I am part of Trade Nation's Influencer program and receive a monthly fee for using their TradingView charts in my analysis.
Like and subscribe and comment my ideas if you enjoy them!
AUD/JPY LIVE TRADE UPDATEWe took this trade yesterday based on the VMS strategy and it moved nicely in our direction for awhile, now it is reclaiming some of the previous gains...we will see if the market can push this one just a bit higher

AUDJPY H4 MARKET OUTLOOK. Looking at how price reacted this week, we’re anticipating a new buy opportunity in this market from the H4 timeframe but before then, we’re waiting for proper confirmation before we buy. We’re waiting for price to test the major support level of 95.222 so we can spot a good deal.