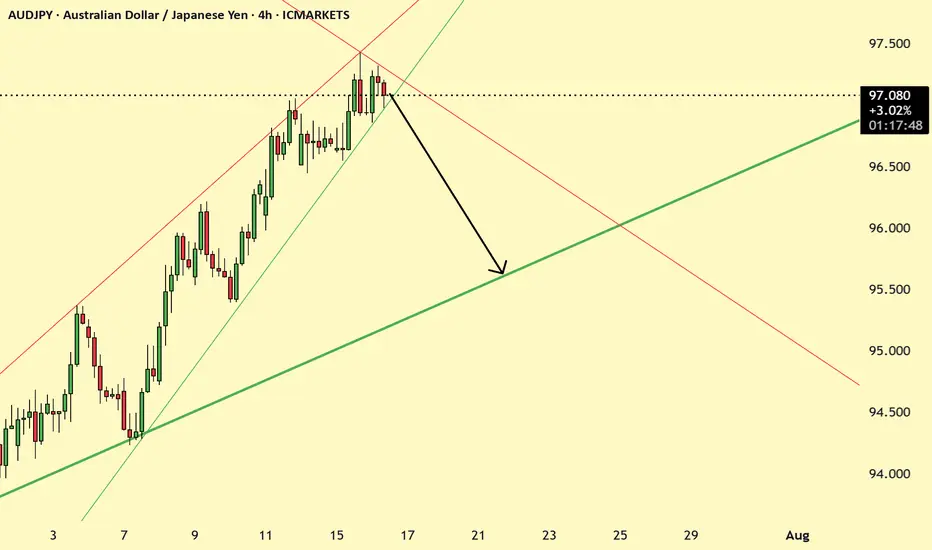
AUDJPY wait for breakdownAUDJPY in trading in the bearish wedge channel and price has been rejecting from this level and soon breakdown is possible wait for breakdown to enter the trade.
AUDJPY trade ideas
AUDJPY TRADE AUDJPY seems to be close to our Fibonacci level for a continuation trade to the upside.
Let's see how the market unfolds.

AUDJPY is BullishPrice went down for a small retracement, however it seems that the bulls have assumed control of the price action, as a double bottom reversal pattern is formed which could potentially lead to a bullish reversal as per Dow theory. Targets are mentioned on the chart.

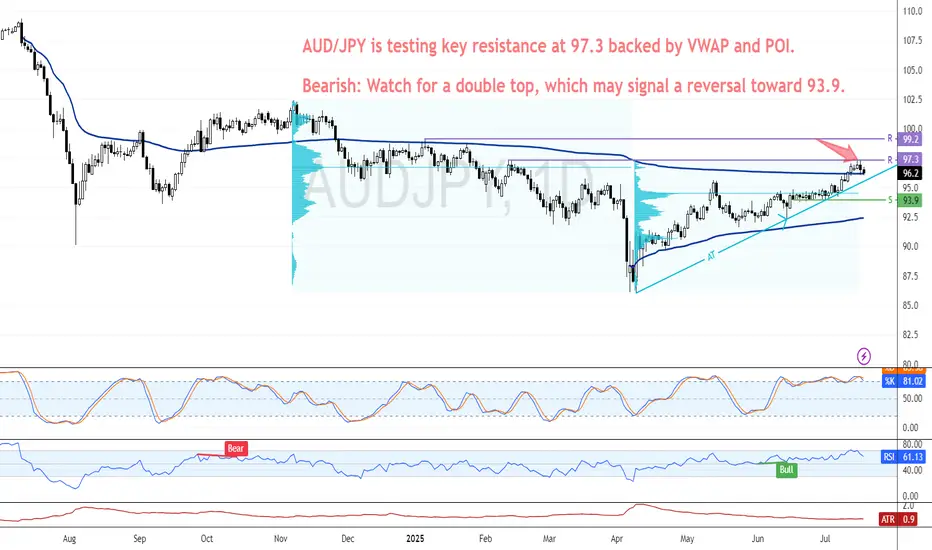
Unique Bearish Setup Emerges for AUD/JPY This QuarterFenzoFx—AUD/JPY is bullish, currently testing the critical resistance and order block at 97.3. This level coincides with the VWAP and volume profile point of interest. Bears are interested in adding short positions at the 97.3 price level.
Since this level is highly important and has the potential to change the trend, it is necessary to form a double top at this price, which has not happened before.
From a technical perspective, if a double top pattern forms at 97.3 and this level holds, a new bearish trend will likely emerge. In this scenario, the 93.9 level is likely to be targeted.
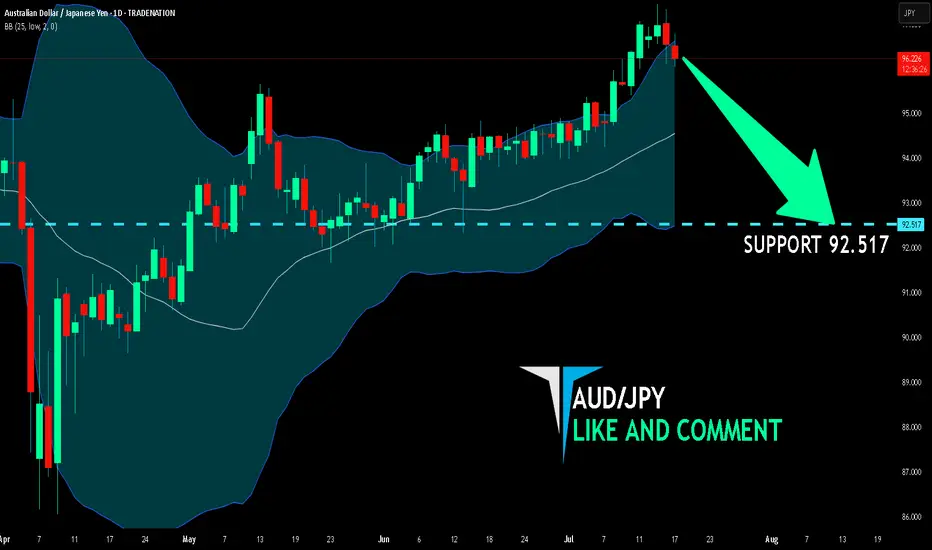
AUD/JPY SENDS CLEAR BEARISH SIGNALS|SHORT
Hello, Friends!
We are going short on the AUD/JPY with the target of 92.517 level, because the pair is overbought and will soon hit the resistance line above. We deduced the overbought condition from the price being near to the upper BB band. However, we should use low risk here because the 1W TF is green and gives us a counter-signal.
Disclosure: I am part of Trade Nation's Influencer program and receive a monthly fee for using their TradingView charts in my analysis.
✅LIKE AND COMMENT MY IDEAS✅
Trump v Powell: Round 6A day that looked like it was drifting into a 'summer lull' kind of day, suddenly had bouts of volatility when the TRUMP / POWELL SAGA re-emerged. Which is making it difficult to hold an opinion at the moment. If the president wins the battle and the FED cut rates more than expected, the USD (should) weaken. If Mr Powell (and the FED board) remain steadfast and keep the wait and see narrative, the USD (should) remain bouyed.
Yesterday's AUD JPY trade stopped out when the market ultimately decided the data didn't move the dial for potential rate cuts. It turned out that 'USD JPY long' would have been the optimal trade. And that's the risk you take when placing a trade 'post data' but 'pre US open'.
Of course, the risk to waiting for the US open is that the opportunity could have passed. It's a conundrum I don't think will ever have a clear answer.
Ultimately, I don't regret yesterday's trade given the information I had at that moment.
Inflation remains 'sticky' in the UK and a lot of emphasis is being put on Thursday's employment data. A 'soft' number will put the BOE in a bind of needing rate cuts to stimulate the economy, but unable to cut due to high inflation.
We also have upcoming AUD employment data, an improvement on last month is forecast, which should see the RBA remain hawkish. And I continue to hold my view that 'fundamentally' AUD JPY long is a good trade. It's just a case of waiting for the right moment. I have read that this week's JPY strength could be attributed to profit taking following recent weakness and ahead of elections in Japan this coming weekend.
Currently, it's a case of staying patient, maintaing a narrative. And trade when you feel like momentum backs up bias. If you only feel comfortable with a 1.2:1 risk reward, I would suggest that could be wise for the time being.
Tricky times, please feel free offervthoughtd or questions:

AUDJPY TRADE IDEA We await to see if we get a full pullback to our Fibonacci level for a trade to the upside.
Let's see how the market unfolds

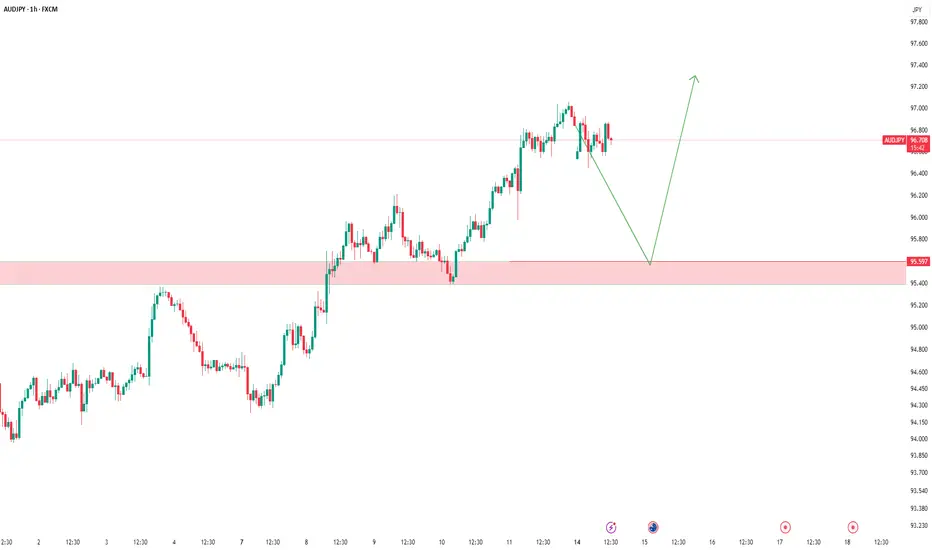
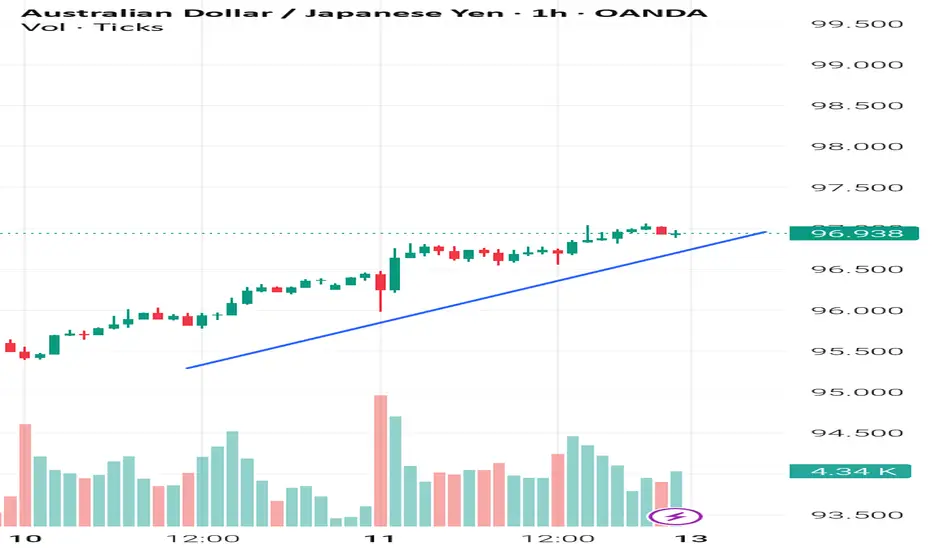
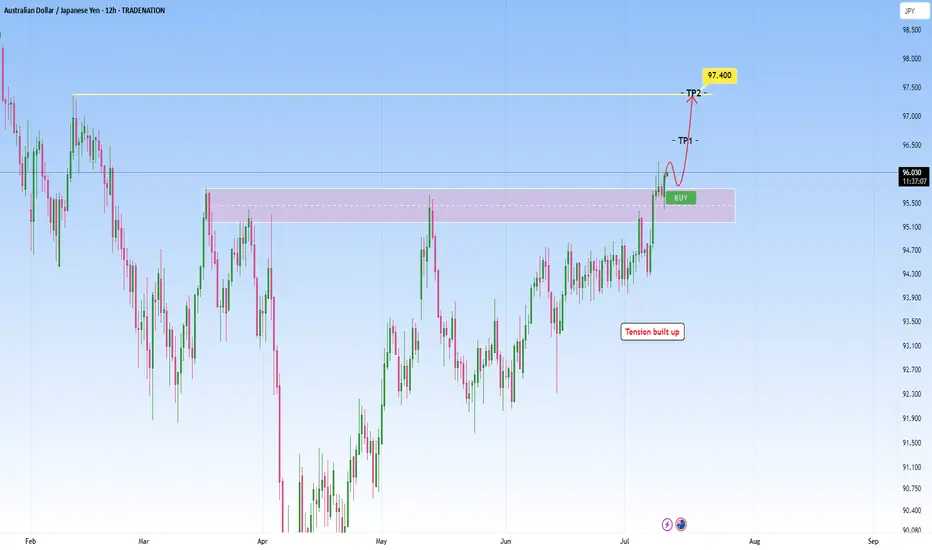
AUD/JPY Long Setup – Anticipating Continuation to Daily ResistanTimeframe: 1H
Bias: Bullish
Entry Zone: ~96.75
SL: Below PDH/POC region
TP1 (1R): 97.36
TP2 (2R): 97.93
Final Target: Daily resistance zone ~98.86
Idea Breakdown:
Price has been forming higher highs and higher lows, respecting both 50EMA and AVWAP on the hourly. After a solid breakout above recent structure and BOS confirmation, I’m looking to buy into a retracement toward the 0.382 fib level and low-volume node (96.70–96.75 region).
This zone also aligns with:
Previous breakout structure
PDH/PWH region
Value area low
EMA support
If price pulls back into this zone and holds, I expect bullish continuation targeting the next major resistance zones above.
Risk: Entry just above PDH with a stop below PDL and key structure
Reward: Clear path to 2R and higher with limited resistance overhead after breakout
Please note i am a amateur logging my own trades for reference and should not be copied

AUD JPY long. Entry: 97.13The market appears to like the month on month below forecast US CPI data.
The JPY is currently the weakest, I've therefore entered a straightforward 'risk on' AUD JPY catalyst trade.
It's a 20 pip stop loss with 30 pip profit target.
The risk to the trade is if the market changes its mind, or simply negative sentiment at the US open.
AUDJPY 14-7-2025trend : bullish
divergence : n/a
continuation : bullish flag
reversal : n/a
harmonics : n/a or AB=CD
bias : bullish
according to indices also bullish

AUDJPY is good for long bull runright now, the price action seems quite bullish and support level of 96.515 seems good as it has been tested multiple times if this support level remains intact then my order of buy stop looks good to go.

AUDJPY – Waiting for the Long SetupThe price is currently in a corrective move,
and as always, we’ve already marked our key level.
📍 We’re patiently waiting for price to reach our support zone.
If a valid buy signal appears, we’ll take the long position
according to our trading plan.
❌ What if the level breaks?
No worries.
We don’t predict — we follow the market.
We’ll wait for a clean pullback and enter short if confirmed.
🎯 Our job isn’t to predict where price will go,
our job is to manage risk and stay aligned with the market.
Price can do anything —
we’re ready for every scenario.
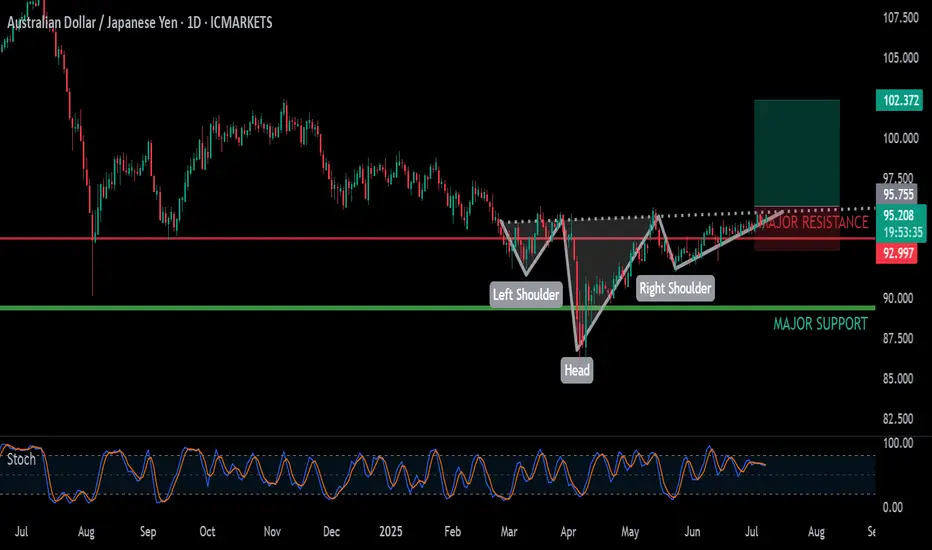
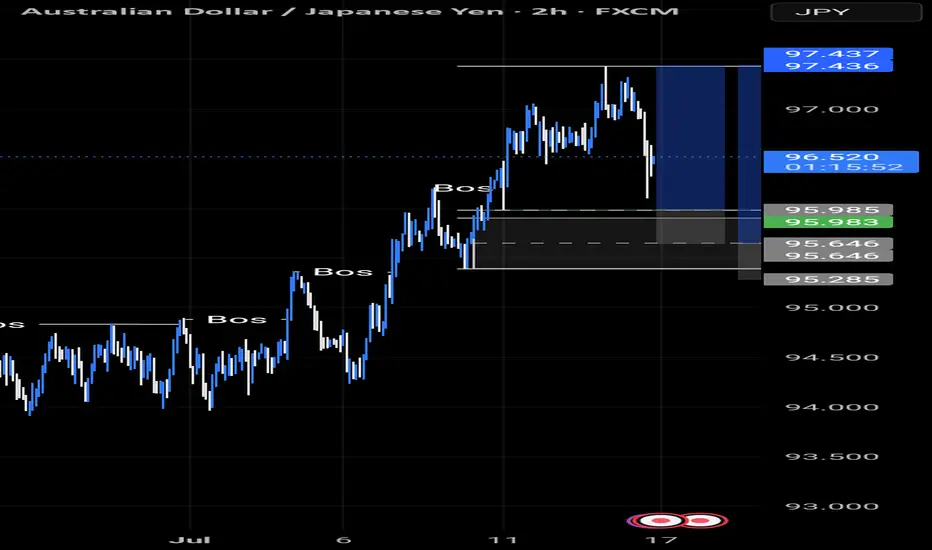
AUDJPY LONG & SHORT – WEEKLY FORECAST Q3 | W29 | Y25💼 AUDJPY LONG & SHORT – WEEKLY FORECAST
Q3 | W29 | Y25
📊 MARKET STRUCTURE SNAPSHOT
AUD JPY is currently reaching for a key higher time frame supply zone, looking for price action to show weakness at premium levels. Structure and momentum are now aligning for a short opportunity backed by multi-timeframe confluence.
🔍 Confluences to Watch 📝
✅ Daily Order Block (OB)
Looking for Strong reaction and early signs of distribution.
✅ 4H Order Block
Break of internal structure (iBoS) confirms a short-term bearish transition.
✅ 1H Order Block
📈 Risk Management Protocols
🔑 Core principles:
Max 1% risk per trade
Only execute at pre-identified levels
Use alerts, not emotion
Stick to your RR plan — minimum 1:2
🧠 You’re not paid for how many trades you take, you’re paid for how well you manage risk.
🧠 Weekly FRGNT Insight
"Trade what the market gives, not what your ego wants."
Stay mechanical. Stay focused. Let the probabilities work.
🏁 Final Thoughts from FRGNT
📌 The structure is clear.
The confluences are stacked.
Let execution follow discipline, not emotion.
FOREX: Weekly Review: The week starting Monday 7 was a fairly sanguine week. With limited US data on the agenda, all eyes were on commentary surrounding the July 9 tariff deadline. Ultimately, any tariff concerns were be brushed aside when a 'fresh deadline' of August 2 was announced. Any attempts at fresh escalation following the announcement were met with ambiguity, as the market continues to hold the view that the president's bark is worse than his bite.
It was very pleasing to see the JPY weaken so much, without reading about a particular cause for JPY weakness, I put it down to a possible re-emergence of the 'carry trade'. Which is hopefully good news moving forward.
It was also nice to see the AUD so strong. A data dependent hold, combined with the overall positive risk environment and the rising price of copper, all contributed to AUD JPY long being a very viable trade all week.
The RBNZ also held rates, but with not as hawkish a narrative as the RBA.
The GBP continues to remain under pressure, the narrative surrounding the fiscal competency of the government compounded by 'soft' GDP data. And if anyone thinks a 'relative fundamental' GBP AUD short is a good idea, I wouldn't disagree.
I'm finding it difficult to have faith in the direction of the USD, caught between the post NFP strength / higher for longer narrative. And the overall market consensus that rate cuts will be coming soon.
All in all, I'll begin the new week keeping an eye on the tariff narrative, but, barring any 'strong negativity' (I'll let the VIX decide how negative the news is), I'll continue to hold a view that 'risk on' trades are viable. And with US CPI in the limelight, 'hopefully' a 'soft number' will compound the 'risk on narrative'.
On a personal note, it was a week of two trades, both AUD JPY long. The first hit profit and the second trade stopped out, interestingly, I was a lot more confident in the stop loss of the second trade, which goes to show no matter how confident we feel, we can only ever expect a 50% win rate.
Please excuse my lack of narrative at end of the week. On Thursday I suffered a strong migraine, which wiped me out for 48 hours. And is a reminder to myself to get my eyes tested, and perhaps to drink more water in this unusually hot UK weather. But if anyone did continue to short the JPY on Thursday and Friday, I would suggest it was a very valid trade idea.
Results:
Trade 1: AUD JPY +1.2
Trade 2: AUD JPY -1
Total = +0.2%
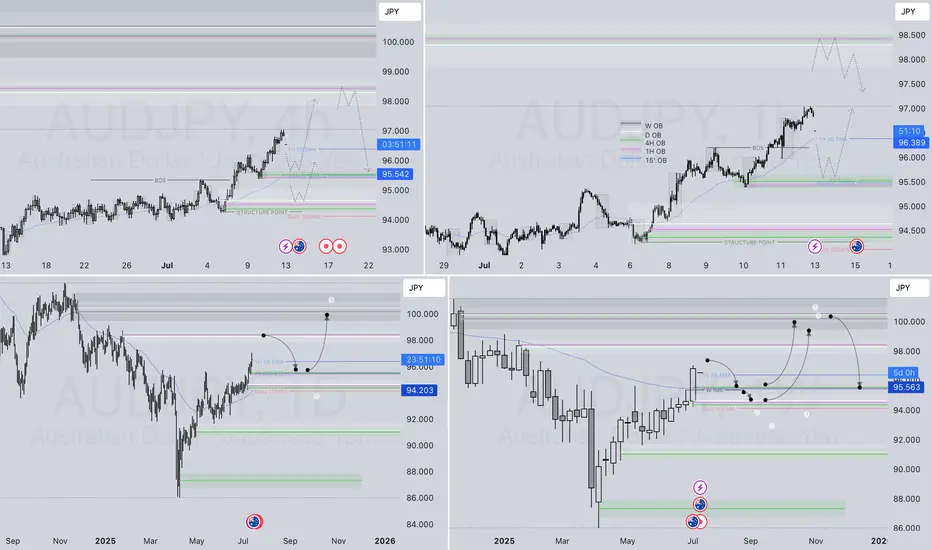
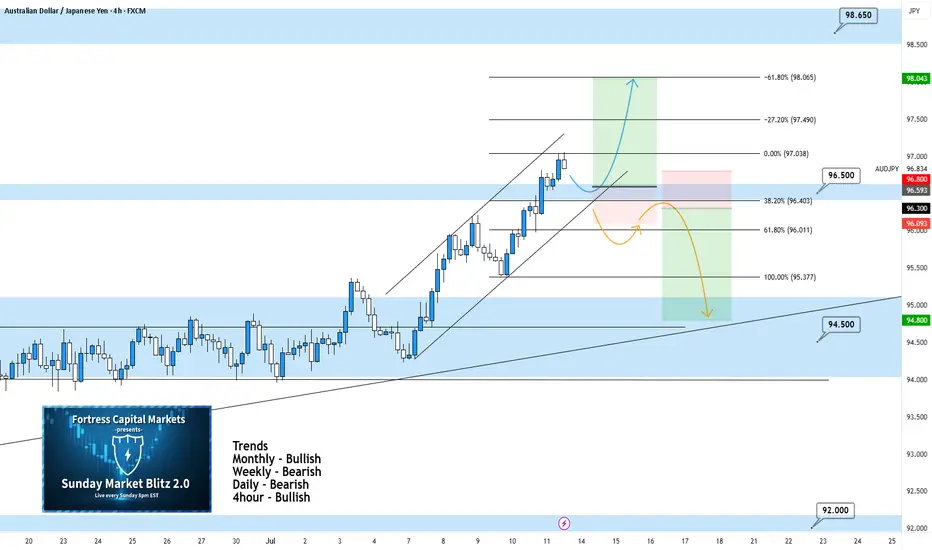
AUDJPY 4Hour TF - July 13th, 2025AUDJPY 7/13/2025
AUDJPY 4hour Bullish Idea
Monthly - Bullish
Weekly - Bearish
Dailly - Bearish
4hour - Bullish
Looking good on AJ! Last week’s analysis played out perfectly and we can see going into this week we have a similar scenario.
Here are the two potential trade paths for the week ahead:
Bullish Continuation - This is the most likely scenario going into this week as we just broke our 96.500 resistance and are now testing it as support. If we can confirm a higher low with strong bullish conviction we can look to enter long and target higher toward major resistance levels.
Bearish Reversal - For us to consider AJ bearish we would first need to see a break back below 96.500. If we can spot a clear trend change and some lower highs below 96.500 we can begin looking short. Target lower toward major support levels if this happens.
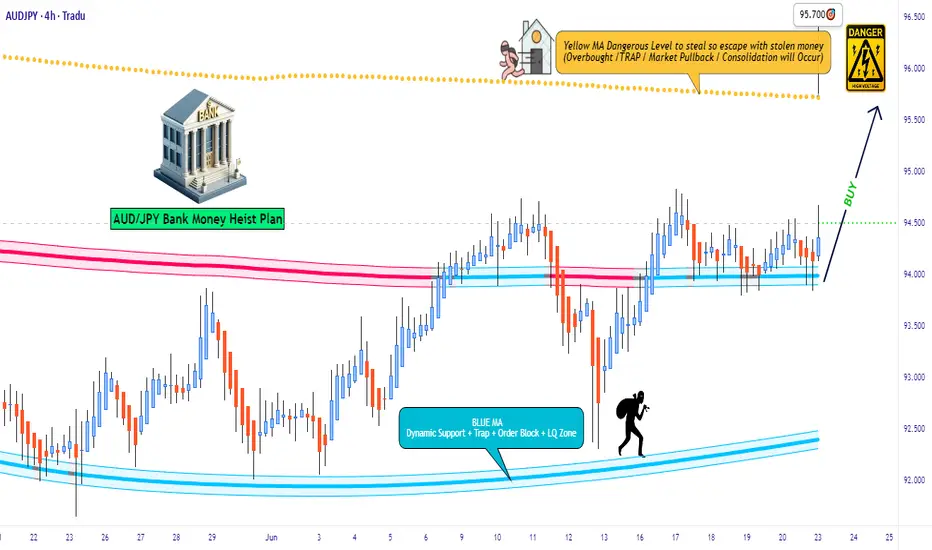
"AUD/JPY: Bulls About to Raid Tokyo? (Long Plan)"🎯 AUD/JPY BULLISH BANK HEIST! (Long Setup Inside) - Thief Trading Strategy
🚨 Yen Carry Trade Alert: Aussie Loot Up For Grabs! 💰
🦹♂️ ATTENTION ALL MARKET PIRATES!
To the Profit Raiders & Risk-Takers! 🌏💣
Using our 🔥Thief Trading Tactics🔥 (a deadly combo of carry trade flows + risk sentiment + institutional traps), we're executing a bullish raid on AUD/JPY—this is not advice, just a strategic heist plan for traders who play by their own rules.
📈 THE LOOTING BLUEPRINT (LONG ENTRY PLAN)
🎯 Treasure Zone: 92.700 (or escape earlier if bears attack)
💎 High-Reward Play: Neutral turning bullish - trap for yen bulls
👮♂️ Cop Trap: Where bears get squeezed at support
🔑 ENTRY RULES:
"Vault Unlocked!" – Grab bullish loot on pullbacks (15-30min TF)
Buy Limit Orders near swing lows OR Market Orders with tight stops
Aggressive? Enter at market but watch JPY news
🚨 STOP LOSS (Escape Plan):
Thief SL at nearest swing low (4H chart)
⚠️ Warning: "Skip this SL? Enjoy donating to yen bulls."
🎯 TARGETS:
Main Take-Profit: 92.700
Scalpers: Ride the Asian session momentum
🔍 FUNDAMENTAL BACKUP (Why This Heist Works)
Before raiding, check:
✅ BOJ Policy (Yen weakness continuing?)
✅ Commodity Prices (Iron ore/coal supporting AUD?)
✅ Risk Sentiment (Stocks rally = carry trade fuel)
✅ Interest Spreads (AUD-JPY yield advantage)
🚨 RISK WARNING
Avoid BOJ/RBA speeches (unless you like volatility torture)
Trailing stops = your golden parachute
💎 BOOST THIS HEIST!
👍 Smash Like to fund our next raid!
🔁 Share to recruit more trading pirates!
🤑 See you at the target, rebels!
⚖️ DISCLAIMER: Hypothetical scenario. Trade at your own risk.
#AUDJPY #CarryTrade #TradingView #RiskOn #ThiefTrading
💬 COMMENT: "Long already—or waiting for better entry?" 👇🔥
P.S. Next heist target already being scouted... stay tuned! 🏴☠️

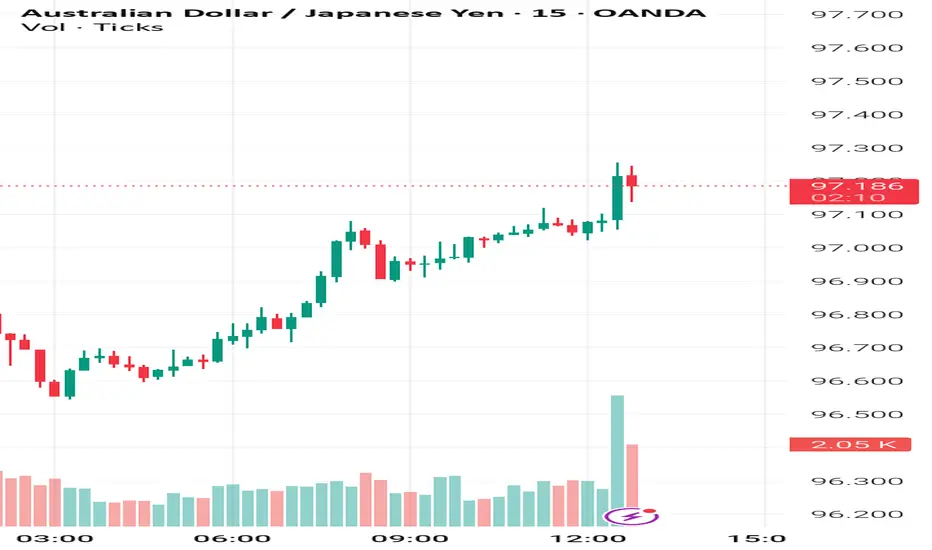
AUD_JPY IS OVERBOUGHT|SHORT|
✅AUD_JPY is trading in a strong
Uptrend but the pair is now
Locally overbought so after the
Pair hits the horizontal resistance
Level of 97.350 we will be expecting
A pullback and a bearish correction
On Monday!
SHORT🔥
✅Like and subscribe to never miss a new idea!✅
Disclosure: I am part of Trade Nation's Influencer program and receive a monthly fee for using their TradingView charts in my analysis.
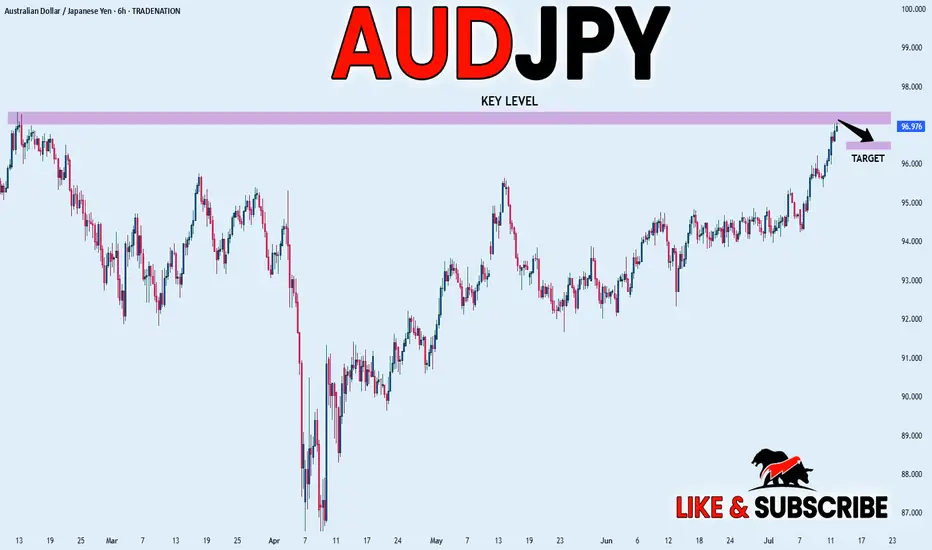
AUDJPY Technical Breakout - Targeting 97.400 Next?TRADENATION:AUDJPY has recently broken decisively above a key resistance zone that had previously capped price for several months. This breakout was preceded by a period of compression and range-bound price action, where bullish momentum steadily built up, indicated by higher lows pressing against the resistance level. This type of structure typically leads to an explosive breakout, which we are now seeing unfold.
After the breakout, price came back for a clean retest of the broken resistance zone, which has now flipped into support. The retest held firmly, suggesting strong buyer interest at this level and confirming the validity of the breakout.
With this structure in place, the bullish momentum is likely to extend further toward the next target zone around 97.400, provided price remains above the current support.
As long as the price holds above the retested zone, the bullish outlook remains intact. A breakdown back below this area, however, would be a warning sign and could open the door to a deeper pullback.
Remember, always wait for confirmation before entering trades, and maintain disciplined risk management.
AUDUSD Technical Analysis: Bullish BreakoutAUDUSD has recently broken decisively above a key resistance zone that had previously cape price for several months. This bullish breakout followed a period of compression and range-bound price action, signalling strong accumulation and building momentum.
As long as price holds above the retested resistance zone, the bullish outlook remains intact. With the current structure and upward momentum, AUDUSD is likely to extend higher towards the next major target near 0.97006.
You can see more details in the chart Ps Support with like and comments for more analysis.

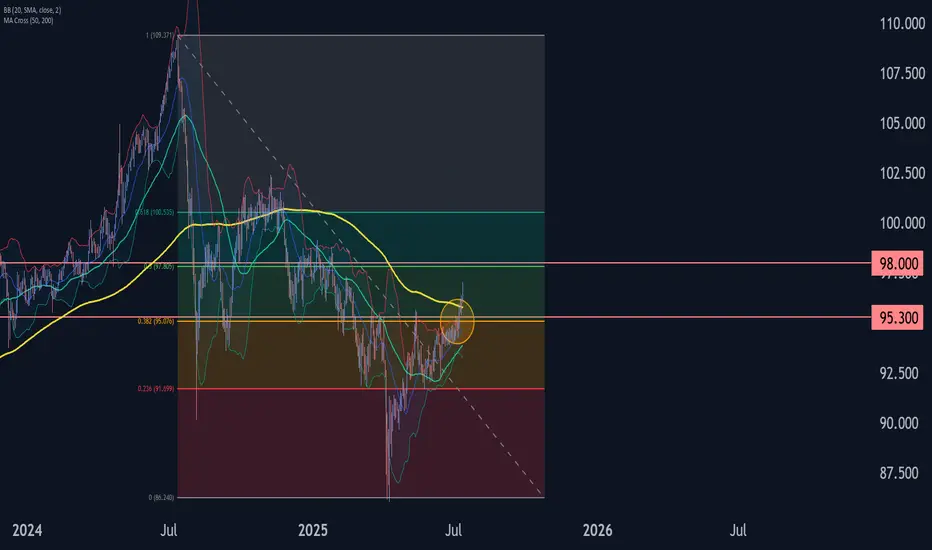
AUDJPY Wave Analysis – 11 July 2025
- AUDJPY broke resistance zone
- Likely to rise to resistance level 98.00
AUDJPY currency pair recently broke the resistance zone between the resistance level 95.30 (which has been reversing the price from March) and the 38.2% Fibonacci correction of the downward impulse from July.
The breakout of this resistance zone continues the active impulse wave 3, which belongs to the intermediate impulse wave (C) from May.
Given the strongly bearish yen sentiment seen across the FX markets today, AUDJPY currency pair can be expected to rise to the next resistance level 98.00 (target price for the completion of wave 5).