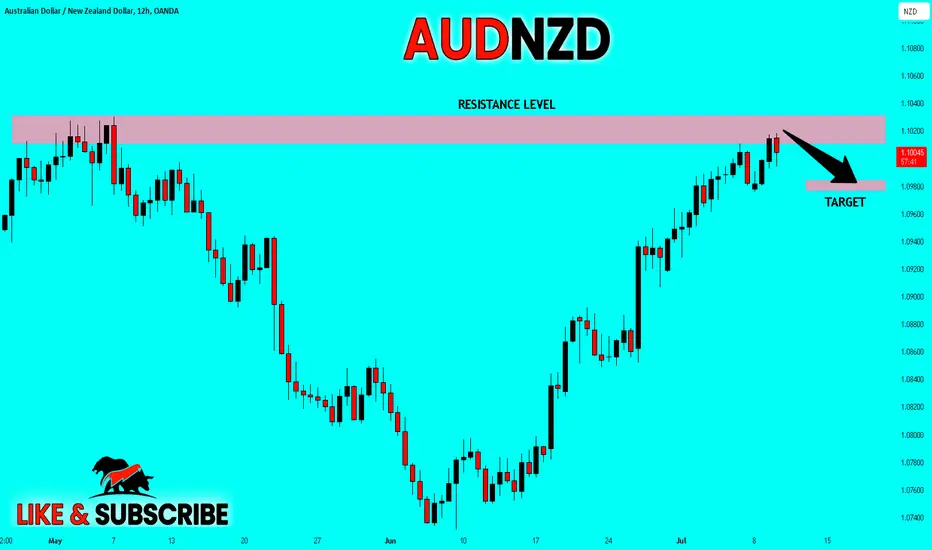
RANGING MARKETAUDNZD is on our RESISTSNCE ZONE and we can see that this pairs has been a ranging and is on a RESISTANCE zone now, let see what patterns are gonna form. REMEMBER when market is on a SUPPORT OR RESISTANCE THERE ARE TWO THINGS THAT MIGHT HAPPEN ,REVERSE OR BREAK, SO YOUR JOB AS TRADER IS TO WAIT FOR ONE OF THE TWO, THEN BUY OR SELL AFTER CONFIRM.
NB:NO REVERSALS NO ENTRY.
AUDNZD trade ideas
AUDNZD climbs to the 1.1050's following the RBNZAsian Session Update: AUDNZD hits the May 2023 highs following the RBNZ at 1.1050's which is key resistance as noted on the end of day update.
AUD_NZD SHORT FROM RESISTANCE|
✅AUD_NZD surged again to retest the resistance of 1.1030
But it is a strong key level
So I think that there is a high chance
That we will see a bearish pullback and a move down
SHORT🔥
✅Like and subscribe to never miss a new idea!✅
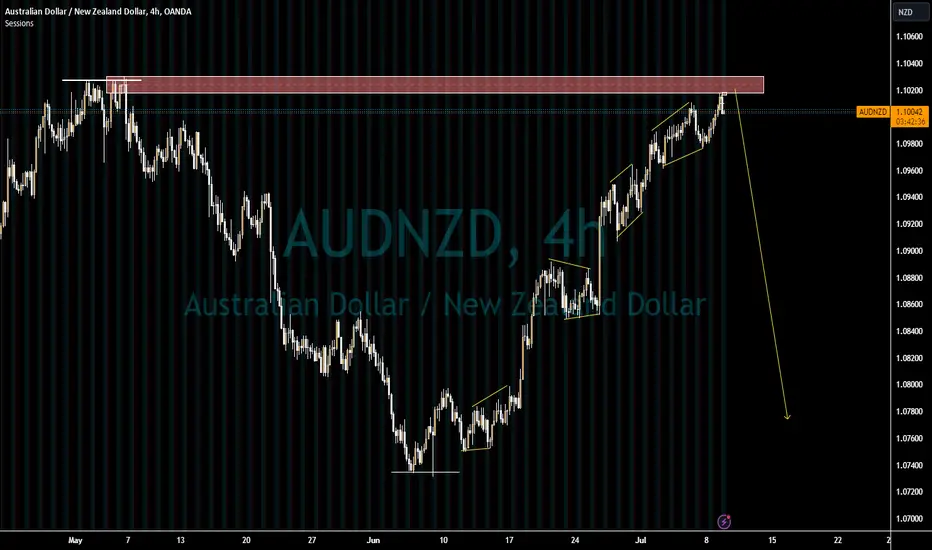
AUDNZD OUTLOOK: CONTINUATION The previous posts on AUDNZD shows the ideal entry (although in hindsight).
This is my expectation for price to continue lower.
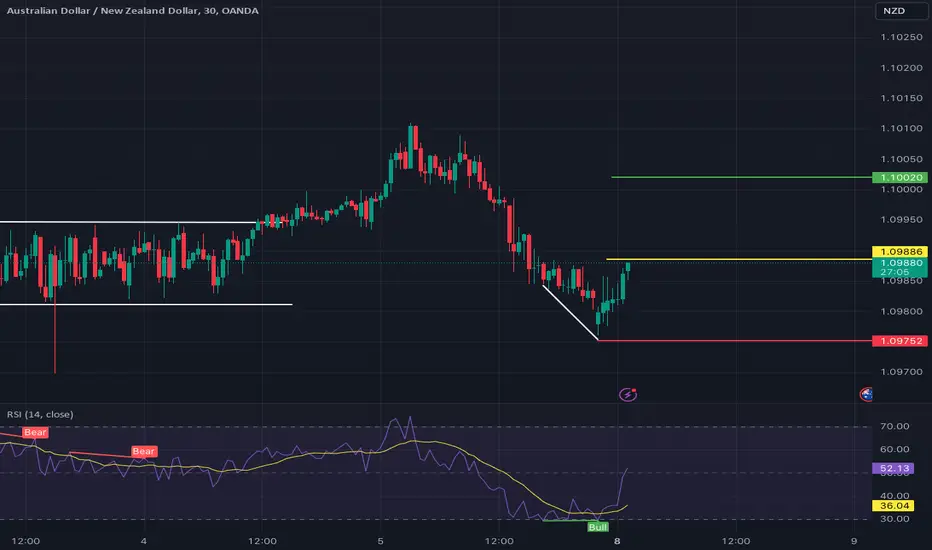
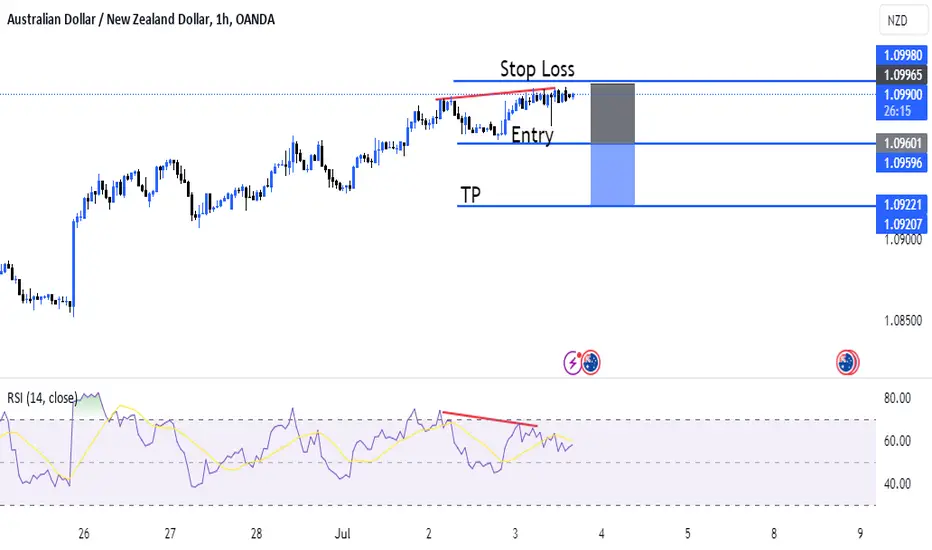
AUDNZD - Entering in Bullish TrendAUDNZD had made a bullish divergence in 30m time frame. The chart is expected to enter into an upward trend. Hence a pending order of Buy Stop is placed just above the previous higher candle (as there is no noticeable LH.
The Signal is:
EP: 1.09886
SL: 1.09752
TP: 1.10020
RR: 0.5%
Lots: 0.61
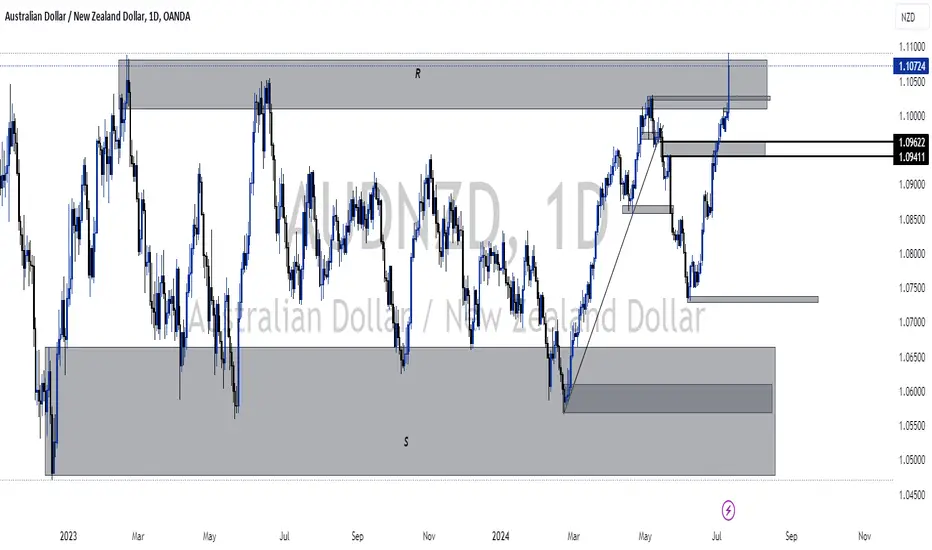
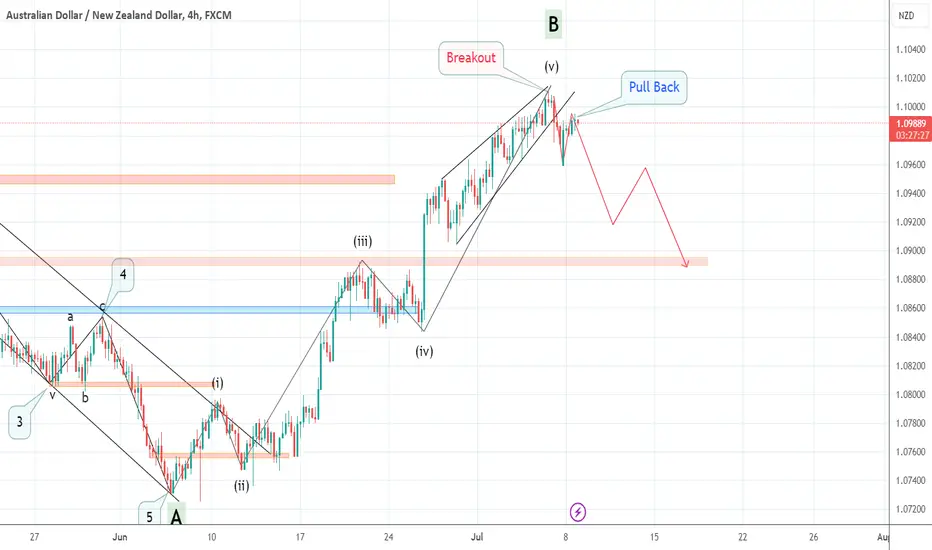
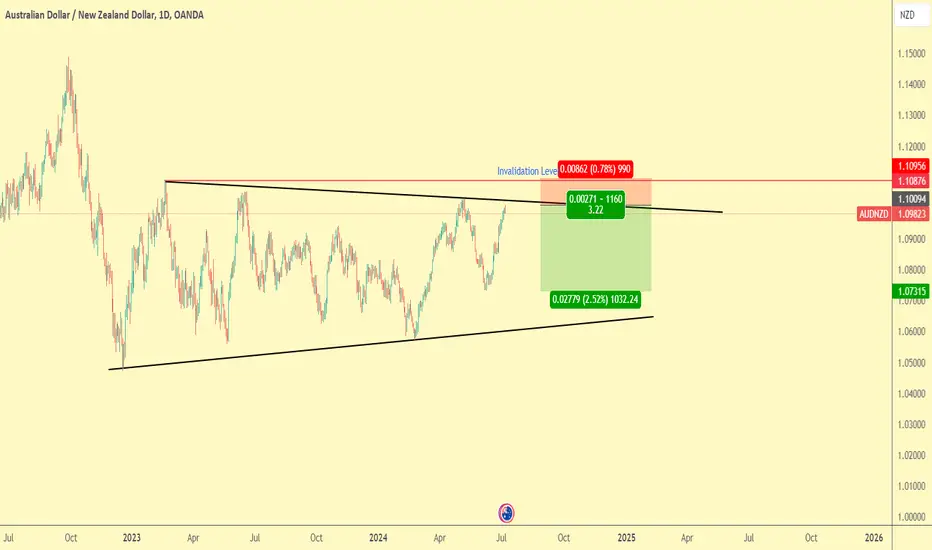
AUDNZD Elliott WaveHello friends
In the AUDNZD currency pair, we see the formation of a 5-wave impulse pattern that has been completed.
Now, with the breaking of the trend line drawn at the bottom of wave 5 and the pullback to it, we expect the price to drop to the range of 1.0900.
This decrease can happen in the dominance of a zigzag or any corrective pattern.
Stop loss can also be considered in the range of 1.1015.
Be successful and profitable.
To support me, I recommend you install Trading View software on your phone and see my analysis and support me with your comments and Boost. Be successful and profitable.
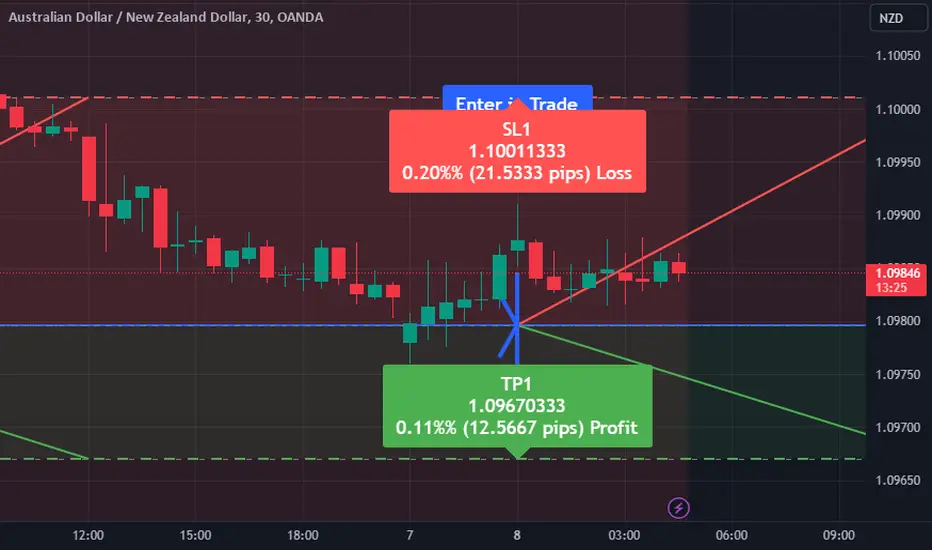
Trading Signal: AUDNZD Sell OpportunityTraders, we have identified a potential sell opportunity for the AUDNZD currency pair based on our analysis. Here are the details of the trade:
Direction: Sell
Enter Price: 1.09796
Take Profit: 1.09670333
Stop Loss: 1.10011333
This recommendation is derived using the EASY Quantum Ai strategy, which uses advanced algorithms and market analysis to predict currency movements. Several factors support this selling opportunity:
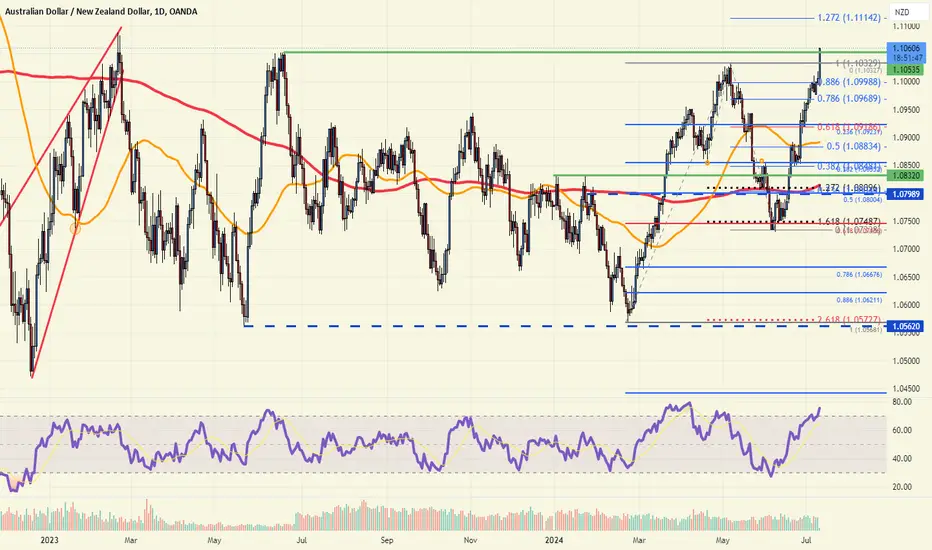
1. Technical Analysis: Recent chart patterns indicate a bearish trend, with the 50-day moving average crossing below the 200-day moving average. Additionally, the Relative Strength Index (RSI) is showing signs of overbought conditions, suggesting potential downward movement.
2. Macroeconomic Indicators: Current economic data from Australia indicates weaker-than-expected GDP growth and rising unemployment rates, which could negatively affect the Australian dollar. Meanwhile, New Zealand's economy is showing signs of moderate growth, providing a relative strength to the NZD.
3. Market Sentiment: Recent market sentiment analysis reveals a stronger bearish outlook among traders towards AUD, driven by geopolitical instability and recent central bank policy announcements.
Monitor market conditions closely and adjust your trade parameters as necessary. Trade wisely and always manage your risk.
Happy trading!
Note: Trading foreign currencies can be risky, and it is essential to perform your own research and analysis before making any financial decisions.
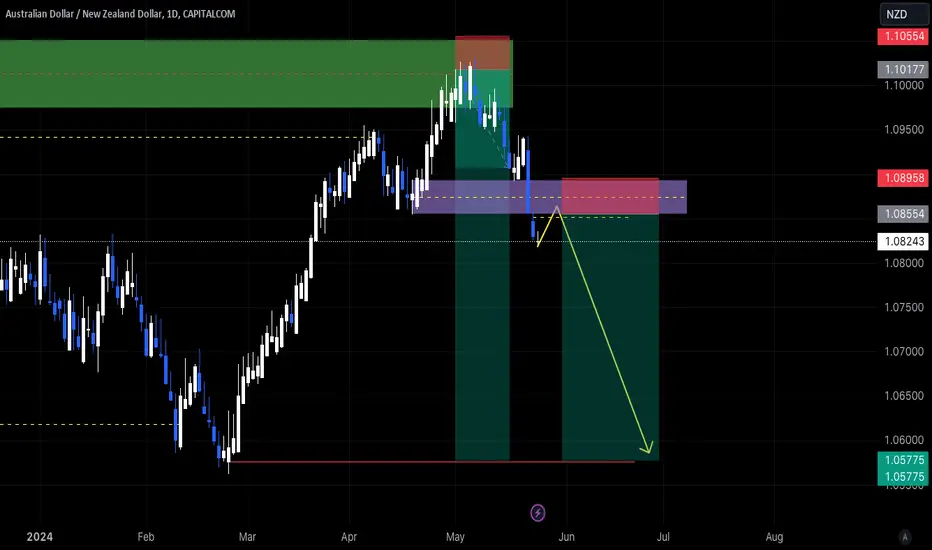
AUDNZD -200 Pips Down !!!Dear Traders,
AUDNZD now in Daily Triangle , and almost reached top of Line ,
For the Next week :
i expect price will start Downward movement at least 150-200 Pips !
Dont Forget like&Comment please !
Regards,
Alireza!!
AUDNZDRSI indicates Bearish Divergence. Which means that at any time the market trend can change to LL and LH.
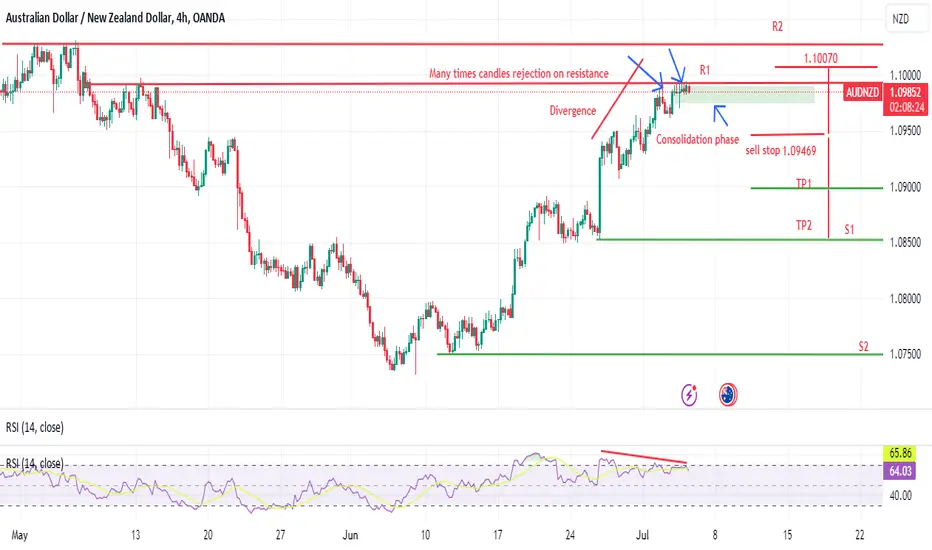
AUDNZD PRINTING BEARISH DIVERGENCEAUDNZD is printing bearish divergence if it break last higher low then it start printing lower high and lower low it mean trend reversal
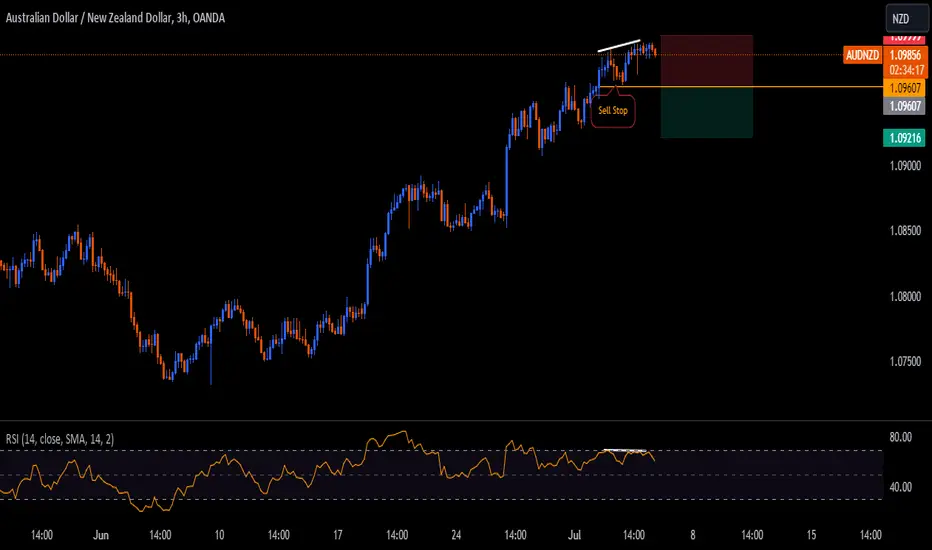
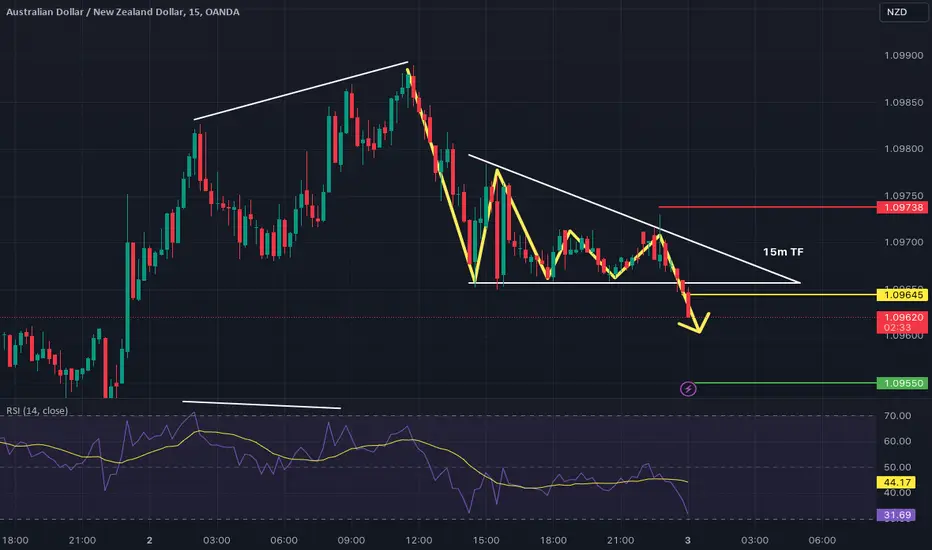
AUDNZD - In Bearish TrendThis pair has showed divergence on 1H, 30m and 15m time frames. I selected 15m time frame for analysis. The trend was in bullish trend before the divergence and then entered into a bearish pattern. Also when in bearish pattern it entered into a descending triangle which is continuous pattern, endorsing the downward trend after divergence. I entered into the trade by placing an instant sell order (Market Execution).
The Signal is:
EP: 1.09645
SL: 1.09738
TP: 1.09628
RR: 0.25%
Lots: 0.44
AUDNZDRSI indicates Bearish Divergence. Which means that at any time the market trend can change to LL and LH.

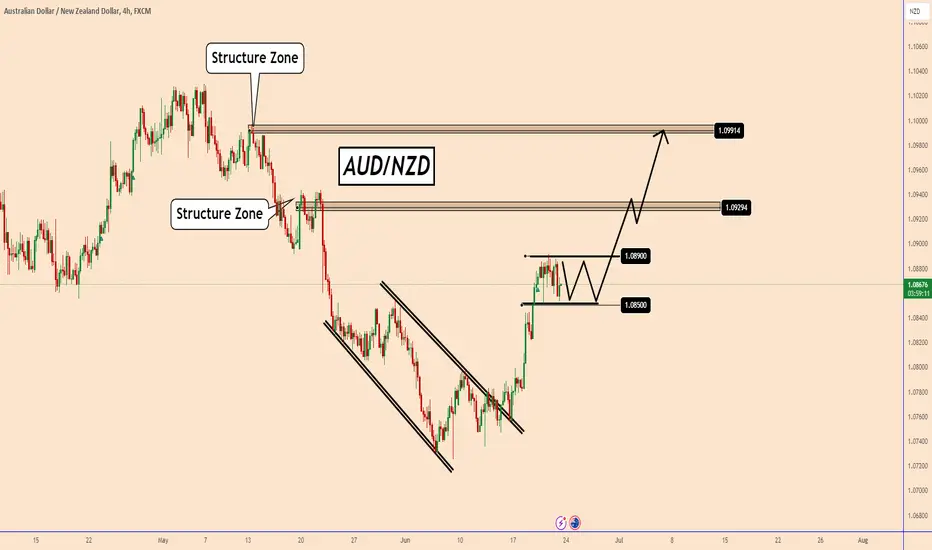
AUDNZD: Waiting for the price to start the bullish moveAUDNZD: Waiting for the price to start the bullish move
In mid-June, the price started a bullish wave which increased by nearly 130 points in a period of 5 days.
So far the price is in correction thus increasing the chances that we may see the AUDNZD rise more from a technical perspective.
So far the price is still accumulating and moving between 1.0850 and 1.0890. Waiting for the price to start the bullish move.
You may find more details in the chart!
Thank you and Good Luck!
❤️PS: Please support with a like or comment if you find this analysis useful for your trading day❤️
Simple 1:2 Short Sell SetupTaking a look at the daily timeframe, this pair seems to be losing bullish momentum. Oscillators are also confirming.
With that said, I plotted out a 1:2 Risk to Reward Setup with Stop Loss above the most recent high back in last May.
That's it - That's all
Trade Safe
