AUDUSD Breakout and Potential RetraceHey Traders, in today's trading session we are monitoring AUDUSD for a buying opportunity around 0.64700 zone, AUDUSD was trading in a downtrend and successfully managed to break it out. Currently is in a correction phase in which it is approaching the retrace area at 0.64700 support and resistance zone.
Trade safe, Joe.
AUDUSD trade ideas

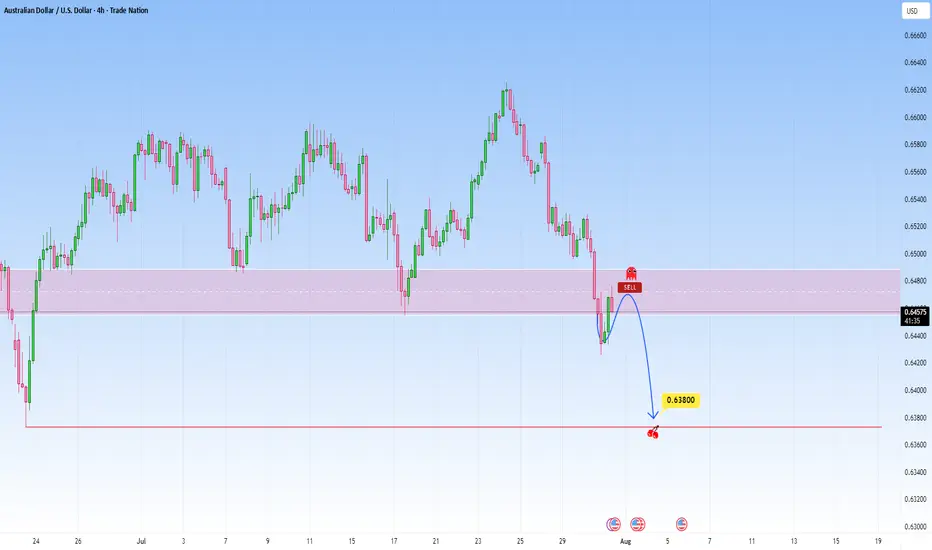
AUDUSD: Bearish Continuation from broken supportThe current setup is a clean example of a trend continuation play. Price recently broke decisively below a structure zone, this break and retest now flips the narrative, what once was a buy zone is now an opportunity for short entries.
Following the aggressive move down, price now began pulling back into that broken zone. The move appears corrective rather than impulsive, characterized by a slower, more rounded structure typical of pullback leg. This is classic behavior in continuation setups: fast drop, slow retrace, and then potential for the next leg lower.
The projected move targets a retest of the swing low at 0.63800. That level is significant, it's a level where prior demand reacted strongly and now it serves as the next probable magnet for price.
What makes this continuation trade high probability is the sharpness of the prior bearish impulse as it signals intent. The market seems to be in a controlled bearish sequence, where sellers dominate momentum and retracements offer fresh entries for trend followers.
The structure and zone alignment all point in the same direction continuation lower, not reversal.
Let me know in the comments what you think
Disclosure: I am part of Trade Nation's Influencer program and receive a monthly fee for using their TradingView charts in my analysis.
AUDUSD Breakout Setup: Ready for Lift-Off!Hey Guys,
I’ve analyzed the AUDUSD pair for you. If the 0.65245 level breaks to the upside, my target will be 0.65416.
If it doesn’t break, I’ll be looking to buy around 0.65047 or 0.64954.
Either way, my final target remains 0.65416.
In this analysis, I’ve highlighted two key levels and shared my target. I’m planning to buy from these zones.
Every single like from you is my biggest source of motivation to keep sharing these analyses. Huge thanks to everyone who supports by liking!

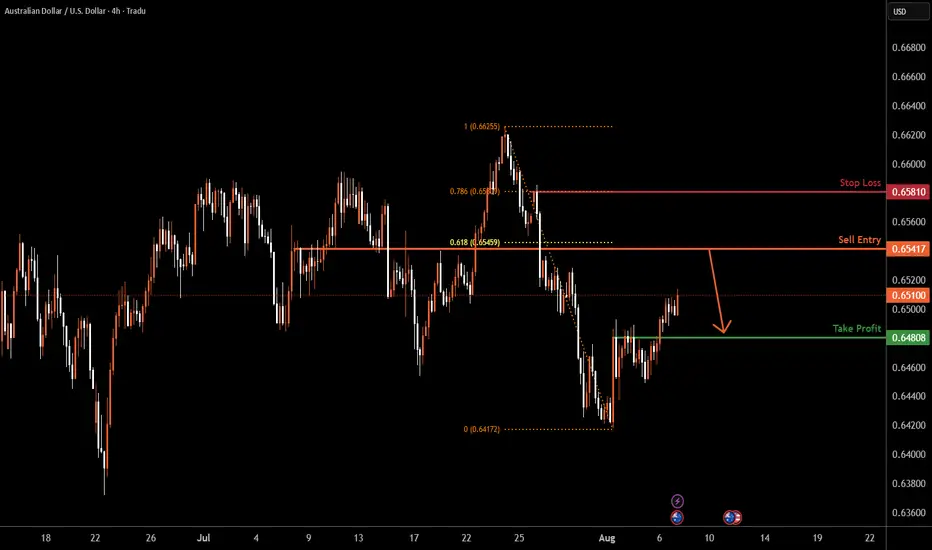
AUDUSD H4 | Bearish reversal off overlap resistanceThe Aussie (AUD/USD) is rising towards the sell entry which acts as an overlap resistance that aligns with the 61.8% Fibonacci retracement and could drop from this level to the take profit.
Sell entry is at 0.6541, which is an overlap resistance that lines up with the 61.8% Fibonacci retracement.
Stop loss is at 0.6581, which is a pullback resistance that lines up with the 78.6% Fibonacci retracement.
Take profit is at 0.6480, which is a pullback support.
High Risk Investment Warning
Trading Forex/CFDs on margin carries a high level of risk and may not be suitable for all investors. Leverage can work against you.
Stratos Markets Limited (tradu.com ):
CFDs are complex instruments and come with a high risk of losing money rapidly due to leverage. 65% of retail investor accounts lose money when trading CFDs with this provider. You should consider whether you understand how CFDs work and whether you can afford to take the high risk of losing your money.
Stratos Europe Ltd (tradu.com ):
CFDs are complex instruments and come with a high risk of losing money rapidly due to leverage. 66% of retail investor accounts lose money when trading CFDs with this provider. You should consider whether you understand how CFDs work and whether you can afford to take the high risk of losing your money.
Stratos Global LLC (tradu.com ):
Losses can exceed deposits.
Please be advised that the information presented on TradingView is provided to Tradu (‘Company’, ‘we’) by a third-party provider (‘TFA Global Pte Ltd’). Please be reminded that you are solely responsible for the trading decisions on your account. There is a very high degree of risk involved in trading. Any information and/or content is intended entirely for research, educational and informational purposes only and does not constitute investment or consultation advice or investment strategy. The information is not tailored to the investment needs of any specific person and therefore does not involve a consideration of any of the investment objectives, financial situation or needs of any viewer that may receive it. Kindly also note that past performance is not a reliable indicator of future results. Actual results may differ materially from those anticipated in forward-looking or past performance statements. We assume no liability as to the accuracy or completeness of any of the information and/or content provided herein and the Company cannot be held responsible for any omission, mistake nor for any loss or damage including without limitation to any loss of profit which may arise from reliance on any information supplied by TFA Global Pte Ltd.
The speaker(s) is neither an employee, agent nor representative of Tradu and is therefore acting independently. The opinions given are their own, constitute general market commentary, and do not constitute the opinion or advice of Tradu or any form of personal or investment advice. Tradu neither endorses nor guarantees offerings of third-party speakers, nor is Tradu responsible for the content, veracity or opinions of third-party speakers, presenters or participants.
Supply in Sight: AUDUSD Gearing Up for a Reversal?Hello TradingView Family / Fellow Traders. This is Richard, also known as theSignalyst.
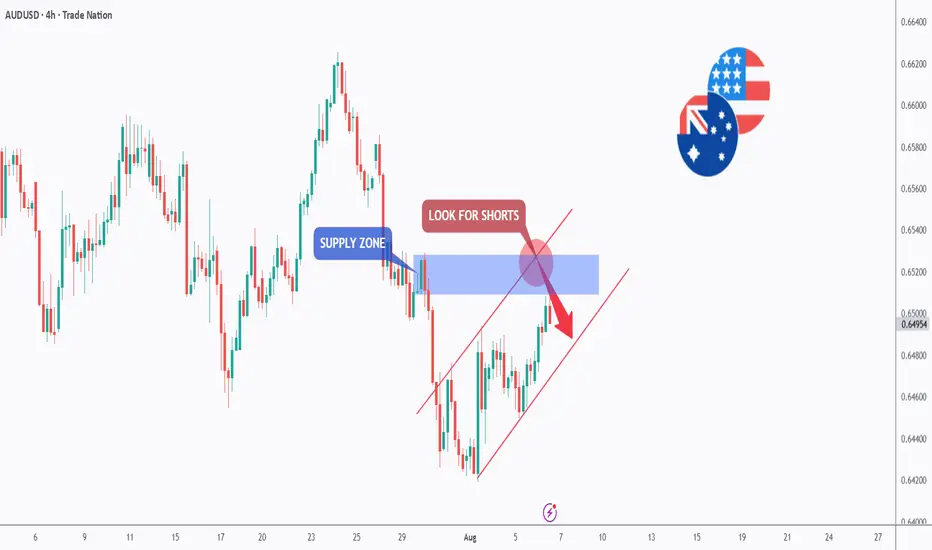
📈AUDUSD has been overall bullish trading within the rising channel marked in red and it is currently retesting the upper bound of the channel acting as an over-bought zone.
Moreover, the blue zone is a strong supply.
📚 As per my trading style:
As #AUDUSD approaches the red circle zone, I will be looking for bearish reversal setups (like a double top pattern, trendline break , and so on...)
📚 Always follow your trading plan regarding entry, risk management, and trade management.
Good luck!
All Strategies Are Good; If Managed Properly!
~Rich
Disclosure: I am part of Trade Nation's Influencer program and receive a monthly fee for using their TradingView charts in my analysis.
AUDUSD will be on shorting by next week market. There is a break of structure and market structure shift to the upside whereby by next week an inducement will be formed, thus, leading to shorting of the market.

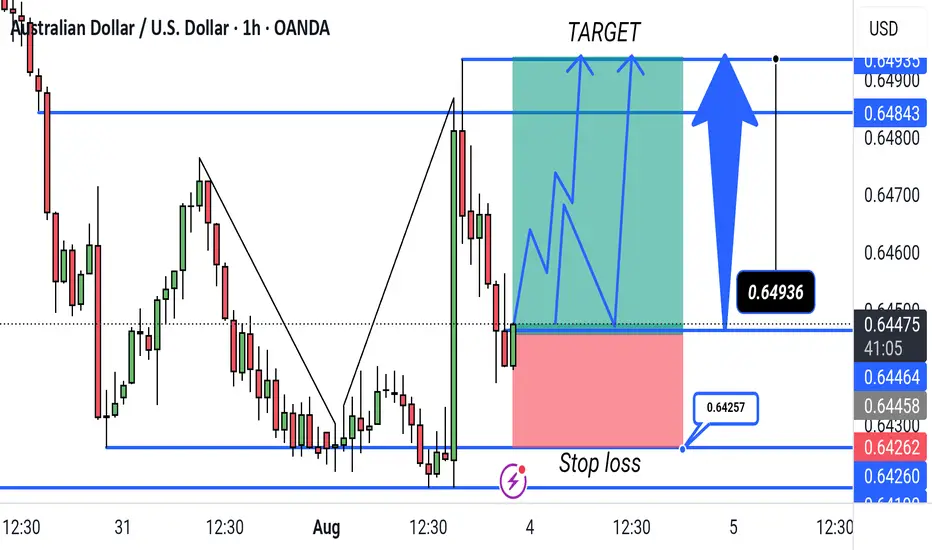
"AUD/USD Bullish Breakout Setup – 1H Timeframe. This chart shows a bullish trade setup for AUD/USD on the 1-hour timeframe. The entry is near 0.64464, with a target at 0.64843 and a stop loss at 0.64257. The trade aims to capitalize on a potential upward breakout following a support bounce.
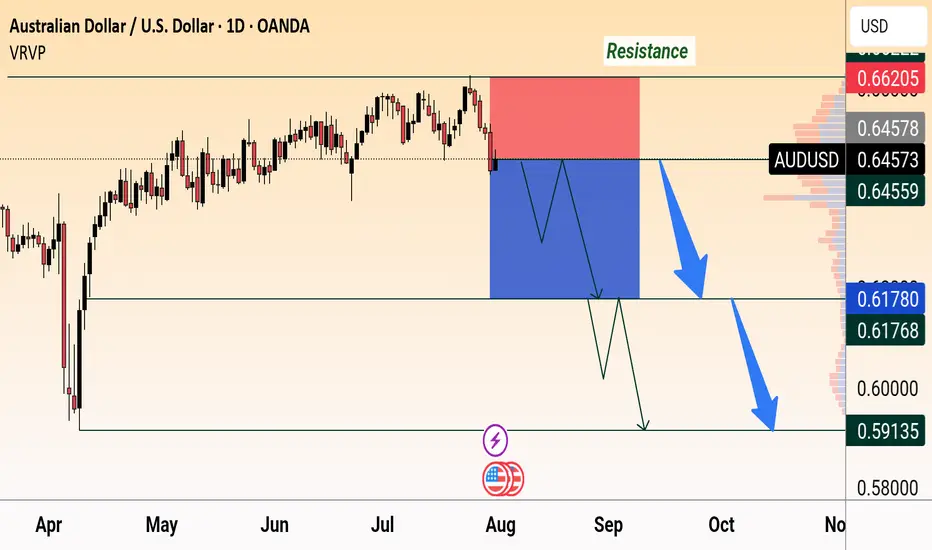
AUD/USD Bearish OutlookAUD/USD faces strong resistance at 0.6620 and is showing bearish momentum. Price is expected to drop below 0.6450 with targets near 0.6178 and 0.5913, following a possible consolidation.
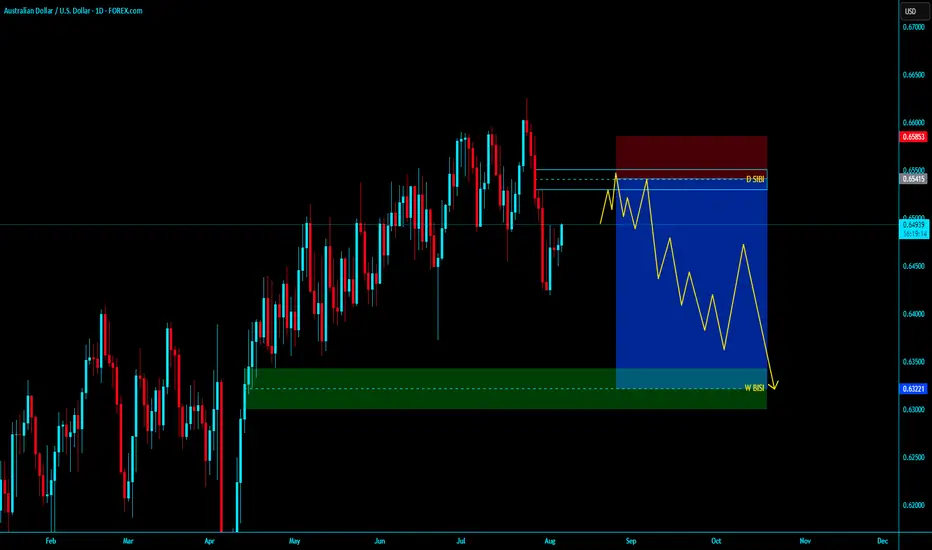
AUDUSD DAILY TF SELL SHORTAUDUSD DAILY TF SELL SHORT
- In Daily TF Market Is Now Bearish our entry in Daily SIBI
- In LTF After Valid Mss Then Our entry in Valid OBI
- I Think this trade is Over Night Holding , Hold and enjoYYYYYYYYYYYY
~~KGB Priyabrat Behera~~
_ICT TRADER & ADVANCE MAPPING SMC TRADER_
AUD/USD) Bearish Trend Read The captionSMC Trading point update
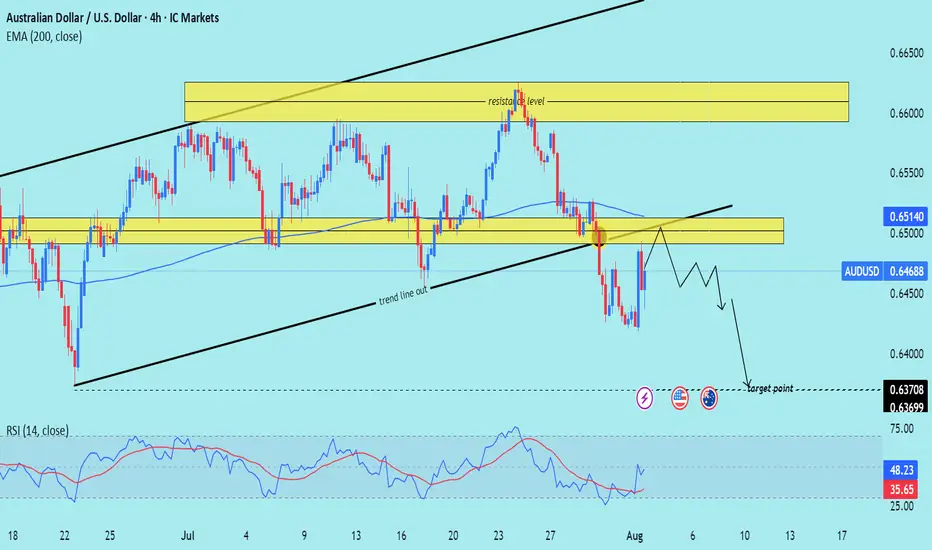
Technical analysis of AUD/USD (Australian Dollar / U.S. Dollar) on the 4-hour timeframe, with a likely setup for further downside. Here's a breakdown of the idea:
---
Technical Summary
Pair: AUD/USD
Timeframe: 4H
Current Price: 0.64688
EMA 200: 0.65140 (price is below = bearish bias)
RSI (14): 48.23 (neutral to slightly bearish)
--
Key Observations
1. Break of Trendline:
The previous ascending trendline (black) was broken to the downside.
This indicates a shift in market structure from bullish to bearish.
2. Resistance Rejection Zone:
Price recently retested a strong supply/resistance zone (yellow box near 0.65140) and was rejected.
This aligns with the 200 EMA → strong confluence for a sell setup.
3. Market Structure:
Price is forming lower highs, indicating sellers are gaining control.
The chart shows a projection of a bearish continuation pattern (zig-zag decline).
4. Target Zone:
Final target marked near 0.63700–0.63699, a previous support level.
This gives the setup a decent risk-reward ratio if the rejection holds.
5. RSI:
RSI is below 50, suggesting bearish momentum, but not oversold—still room to move down.
Mr SMC Trading point
---
Conclusion & Trade Idea
Bias: Bearish
Sell Zone: Near the resistance area (0.65000–0.65150)
Target: 0.63700 zone
Stop Loss: Likely above 0.65200 (above resistance and EMA 200)
Confirmation: Price action forming lower highs and staying below EMA 200
Please support boost 🚀 this analysis)
AUD/USD Bearish Setup-Trendline Breakout Signals Potential Drop📉 AUD/USD Bearish Setup – Trendline Breakout Signals Potential Drop!
The AUD/USD pair has broken below a key ascending trendline, signaling a shift in momentum from bullish to bearish.
🔍 Key Highlights:
Price was previously trading within an ascending channel.
Strong resistance was confirmed around the 0.6619 level.
A decisive break of the trendline and the key support zone (0.6500) now points to increased bearish pressure.
Market is currently retesting the broken support zone, which may act as new resistance before the next leg down.
🎯 Target Point: 0.6371
If bearish momentum continues, we anticipate price to move toward the target support zone near 0.6371, offering a solid risk-reward setup.
📌 Watch For: Bearish confirmation on retest + momentum indicators aligning to the downside.

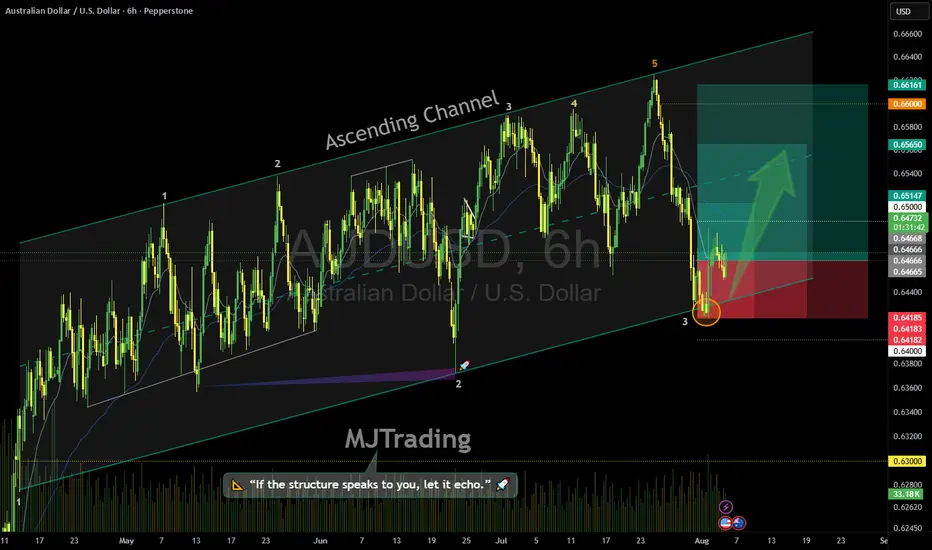
AUD/USD Long Trade Setup – Buying at the Channel LowOANDA:AUDUSD
🔍 Technical Overview:
The pair is trading within a well-defined ascending channel.
A potential bullish reversal is forming at the confluence of:
Channel support
Local structural support (highlighted in orange circle)
Bullish wick rejections and slowing downside momentum
📈 Trade Idea: BUY AUD/USD
Entry: Market buy or buy near 0.6450 – 0.6465
Stop-Loss: Below the swing low and channel support at 0.64160
Target 1: 0.65150
Target 2: 0.6566
Target 3: 0.66160
Risk-to-Reward: ~1:3 R:R ratio
Monitor price action near mid-channel resistance
🧠 “If the structure speaks to you, let it echo.” – Let the price action confirm your bias before committing fully.
Previous Sell Setup at the top of channel:
Psychology Always Matters:
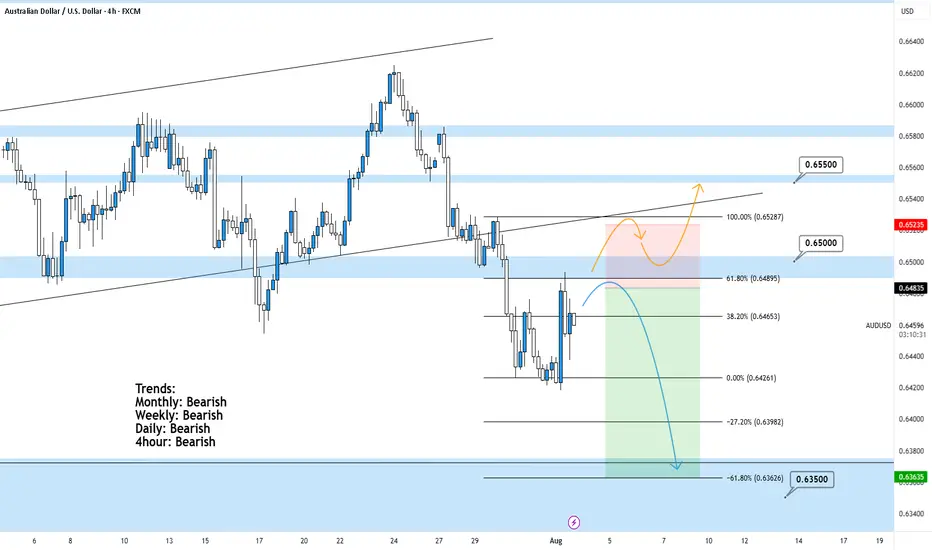
AUDUSD 4Hour TF - August 3rd,2025🟦 AUDUSD 4H Analysis Bearish Idea
📅 August 3, 2025
🔹 Top-Down Trend Bias:
• Monthly – Bearish
• Weekly – Bearish
• Daily – Bearish
• 4H – Bearish
AUDUSD remains in a clear downtrend across all major timeframes. Current price action shows a corrective move off recent lows but all signs point to this being a temporary pullback, not a reversal.
🔍 Key Zone: 0.6485 – 0.6528
This zone aligns with the 61.8% fib retracement, and previous structure making it a high probability rejection area.
✅ Scenario A: Bearish Continuation (Blue Path)
1.If price taps into 0.6485–0.6525 and rejects
2.Look for bearish confirmation (engulfing, lower high, break of structure)
Target 1: 0.6426 (previous low)
Target 2: 0.6398
Extended Target: 0.6350
This is the trend following setup, most probable given full HTF alignment.
⚠️ Scenario B: Bullish Breakout (Orange Path)
If price breaks and closes above 0.65000
1.Could signal short term shift with upside potential toward 0.6550
2.However, this is a counter-trend idea and lower probability unless higher timeframes begin shifting
🧠 Final Notes
• Bias remains bearish until proven otherwise
• Watch for confirmation at the fib/trendline confluence zone
• Patience > prediction
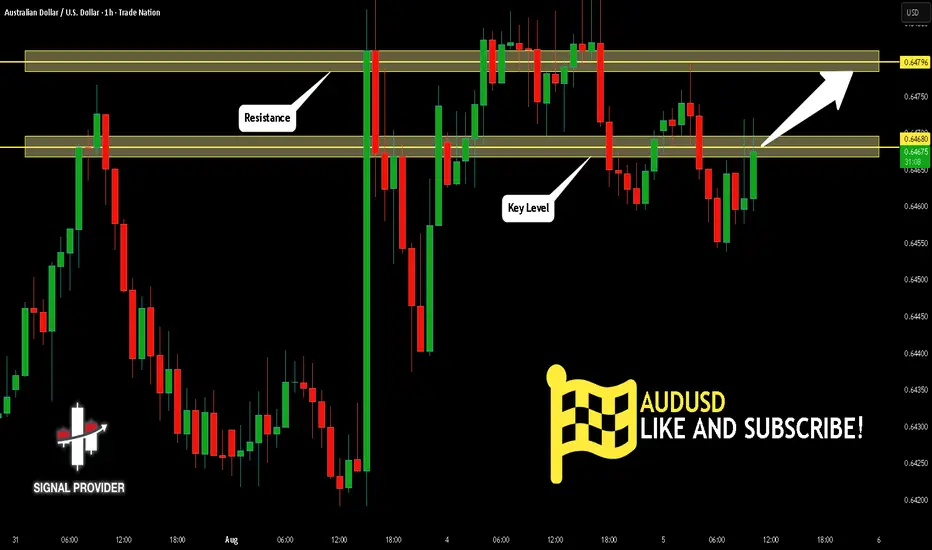
AUDUSD Is Bullish! Long!
Here is our detailed technical review for AUDUSD.
Time Frame: 1h
Current Trend: Bullish
Sentiment: Oversold (based on 7-period RSI)
Forecast: Bullish
The market is on a crucial zone of demand 0.646.
The oversold market condition in a combination with key structure gives us a relatively strong bullish signal with goal 0.647 level.
P.S
We determine oversold/overbought condition with RSI indicator.
When it drops below 30 - the market is considered to be oversold.
When it bounces above 70 - the market is considered to be overbought.
Disclosure: I am part of Trade Nation's Influencer program and receive a monthly fee for using their TradingView charts in my analysis.
Like and subscribe and comment my ideas if you enjoy them!
Possibility of uptrend It is expected that a trend change will take place within the current support area and we will witness the start of an uptrend. Otherwise, a continuation of the downtrend with a break of the support area is likely.

AUDUSD – Sell Into Resistance at 0.6510Trade Idea
Type: Sell Limit
Entry: 0.6510
Target: 0.6430
Stop Loss: 0.6530
Duration: Intraday
Expires: 05/08/2025 06:00
Technical Overview
Medium-term bias remains bearish despite recent intraday volatility.
A temporary move higher is anticipated, offering a setup to sell into strength.
Bespoke resistance at 0.6510 provides a strategic entry level for short positions.
The trade targets a move toward 0.6430, with potential support seen just below.
Key Technical Levels
Resistance: 0.6500 / 0.6530 / 0.6560
Support: 0.6440 / 0.6420 / 0.6400
Disclosure: I am part of Trade Nation's Influencer program and receive a monthly fee for using their TradingView charts in my analysis.

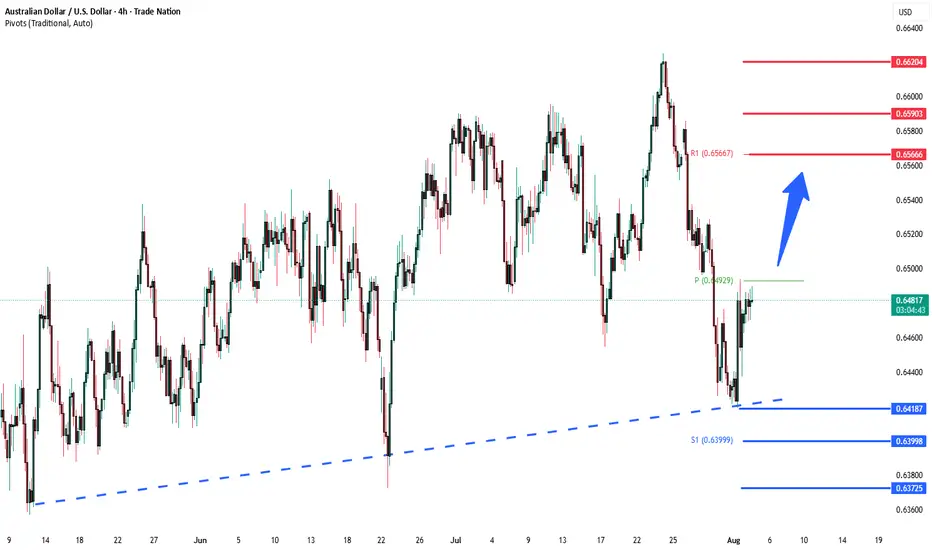
AUDUSD key support at 0.6420Trend Overview:
The AUDUSD currency price remains in a bullish trend, characterised by higher highs and higher lows. The recent intraday price action is forming a continuation consolidation pattern, suggesting a potential pause before a renewed move higher.
Key Technical Levels:
Support: 0.6420 (primary pivot), followed by 0.6400 and 0.6370
Resistance: 0.6560 (initial), then 0.6590 and 0.6620
Technical Outlook:
A pullback to the 0.6420 level, which aligns with the previous consolidation zone, could act as a platform for renewed buying interest. A confirmed bounce from this support may trigger a continuation toward the next resistance levels at 0.6560, 0.6590, and ultimately 0.6620.
Conversely, a daily close below 0.6420 would suggest weakening bullish momentum. This scenario would shift the bias to bearish in the short term, potentially targeting 0.6400 and 0.6370 as downside levels.
Conclusion:
AUDUSD maintains a bullish structure while trading above the 0.6420 support. A bounce from this level would validate the consolidation as a continuation pattern. The loss of this level and a daily close below would suggest deeper corrective risk.
This communication is for informational purposes only and should not be viewed as any form of recommendation as to a particular course of action or as investment advice. It is not intended as an offer or solicitation for the purchase or sale of any financial instrument or as an official confirmation of any transaction. Opinions, estimates and assumptions expressed herein are made as of the date of this communication and are subject to change without notice. This communication has been prepared based upon information, including market prices, data and other information, believed to be reliable; however, Trade Nation does not warrant its completeness or accuracy. All market prices and market data contained in or attached to this communication are indicative and subject to change without notice.
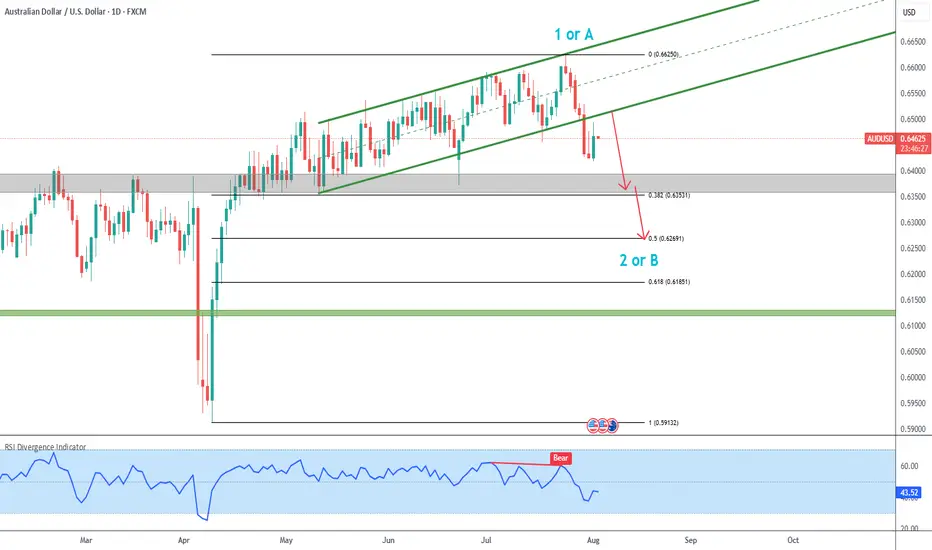
AUDUSD Correction in progress
▶️ AUDUSD has broken the green ascending channel that had been in progress since late April.
▶️ This break suggests wave 1/A likely concluded at 0.66250, supported by bearish RSI divergence on the high.
▶️ Retests of the bottom of the broken channel could offer short trade opportunities.
▶️ The initial high-probability target is the 38.2% Fibonacci retracement at 0.63531, which aligns with the start of the ascending channel.
▶️ A secondary target is the 50% retracement level at 0.62691.
Bullish bounce off pullback support?The Aussie (AUD/USD) is falling towards the pivot which is a pullback support and could bounce to the 1st resistance.
Pivot:0.6484
1st Support: 0.6452
1st Resistance: 0.6538
Risk Warning:
Trading Forex and CFDs carries a high level of risk to your capital and you should only trade with money you can afford to lose. Trading Forex and CFDs may not be suitable for all investors, so please ensure that you fully understand the risks involved and seek independent advice if necessary.
Disclaimer:
The above opinions given constitute general market commentary, and do not constitute the opinion or advice of IC Markets or any form of personal or investment advice.
Any opinions, news, research, analyses, prices, other information, or links to third-party sites contained on this website are provided on an "as-is" basis, are intended only to be informative, is not an advice nor a recommendation, nor research, or a record of our trading prices, or an offer of, or solicitation for a transaction in any financial instrument and thus should not be treated as such. The information provided does not involve any specific investment objectives, financial situation and needs of any specific person who may receive it. Please be aware, that past performance is not a reliable indicator of future performance and/or results. Past Performance or Forward-looking scenarios based upon the reasonable beliefs of the third-party provider are not a guarantee of future performance. Actual results may differ materially from those anticipated in forward-looking or past performance statements. IC Markets makes no representation or warranty and assumes no liability as to the accuracy or completeness of the information provided, nor any loss arising from any investment based on a recommendation, forecast or any information supplied by any third-party.

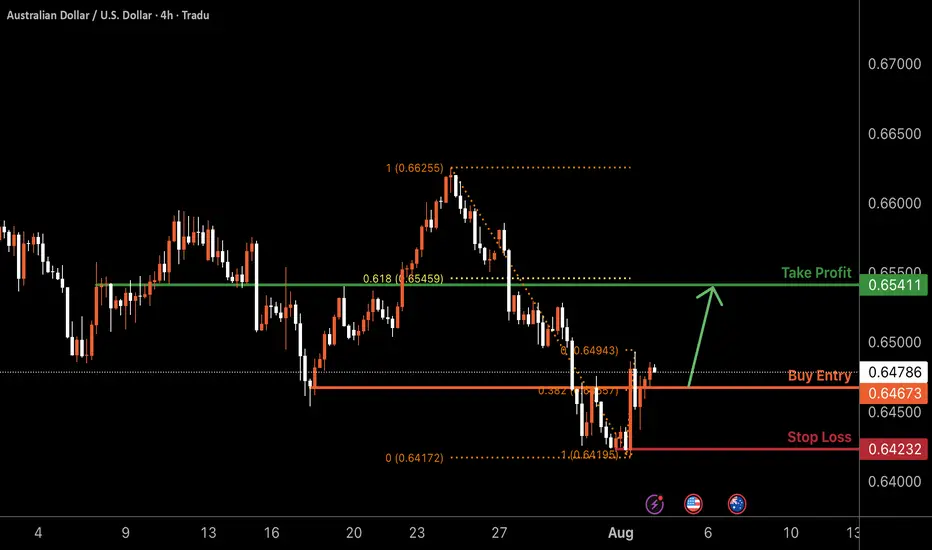
AUSSIE H4 | Bullish riseAUD/USD has bounced off the buy entry at 0.6467, which is an overlap support, and could rise to the take-profit level.
Stop is at 0.6423, which is a swing low support.
Take profit is at 0.6541, which is a pullback resistance that aligns with the 61.8% Fibonacci retracement.
High Risk Investment Warning
Trading Forex/CFDs on margin carries a high level of risk and may not be suitable for all investors. Leverage can work against you.
Stratos Markets Limited (tradu.com ):
CFDs are complex instruments and come with a high risk of losing money rapidly due to leverage. 65% of retail investor accounts lose money when trading CFDs with this provider. You should consider whether you understand how CFDs work and whether you can afford to take the high risk of losing your money.
Stratos Europe Ltd (tradu.com ):
CFDs are complex instruments and come with a high risk of losing money rapidly due to leverage. 66% of retail investor accounts lose money when trading CFDs with this provider. You should consider whether you understand how CFDs work and whether you can afford to take the high risk of losing your money.
Stratos Global LLC (tradu.com ):
Losses can exceed deposits.
Please be advised that the information presented on TradingView is provided to Tradu (‘Company’, ‘we’) by a third-party provider (‘TFA Global Pte Ltd’). Please be reminded that you are solely responsible for the trading decisions on your account. There is a very high degree of risk involved in trading. Any information and/or content is intended entirely for research, educational and informational purposes only and does not constitute investment or consultation advice or investment strategy. The information is not tailored to the investment needs of any specific person and therefore does not involve a consideration of any of the investment objectives, financial situation or needs of any viewer that may receive it. Kindly also note that past performance is not a reliable indicator of future results. Actual results may differ materially from those anticipated in forward-looking or past performance statements. We assume no liability as to the accuracy or completeness of any of the information and/or content provided herein and the Company cannot be held responsible for any omission, mistake nor for any loss or damage including without limitation to any loss of profit which may arise from reliance on any information supplied by TFA Global Pte Ltd.
The speaker(s) is neither an employee, agent nor representative of Tradu and is therefore acting independently. The opinions given are their own, constitute general market commentary, and do not constitute the opinion or advice of Tradu or any form of personal or investment advice. Tradu neither endorses nor guarantees offerings of third-party speakers, nor is Tradu responsible for the content, veracity or opinions of third-party speakers, presenters or participants.
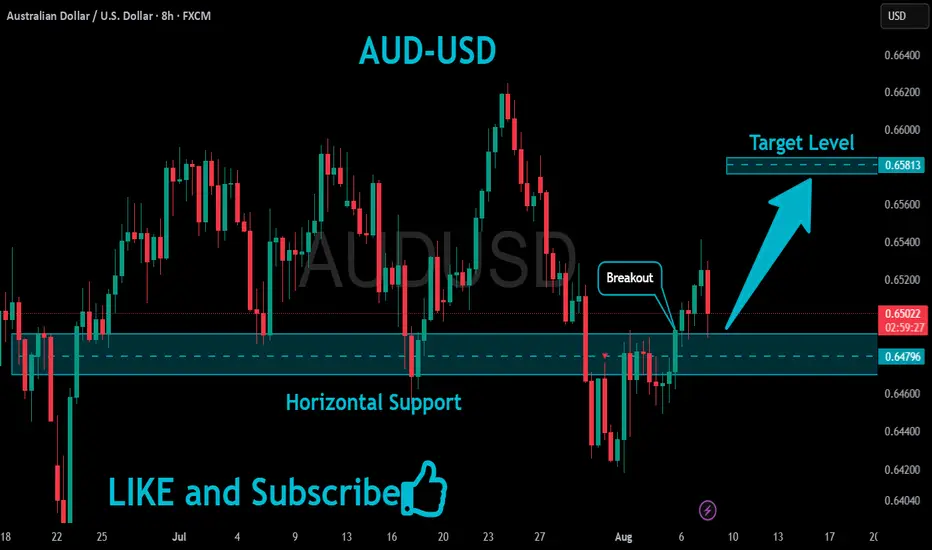
AUDUSD Bullish Bias!
HI,Traders !
#AUDUSD is trading in a
Local uptrend and the
Pair made a retest of the
Horizontal support of 0.64796
And we are already seeing
A bullish rebound so we
Will be expecting a further
Bullish move up !
Comment and subscribe to help us grow !
AUD/USD Bearish Breakout – Retest & Sell Continuation SetupAUD/USD (Australian Dollar vs. US Dollar)
Likely a 4H (4-hour) timeframe based on candlestick density and scale.
---
2. Structure & Patterns:
Rising wedge/ascending channel: Already broken to the downside.
Breakout zone: Around 0.6480–0.6500, clearly marked and now acting as resistance.
Retest confirmed: Price returned to the broken zone, touched resistance, and dropped.
Ichimoku Cloud: Price is below the cloud → strong bearish signal.
Downward projection: You’ve drawn a possible bearish path with lower highs and lower lows.
---
3. Key Support & Target Levels:
✅ Current Price (as per chart):
Around 0.6468
🎯 Target Points (as per your drawing):
1. First Target Point → 0.6400
This aligns with previous minor support.
2. Second Target Point → 0.6370
Likely based on a Fibonacci or historical support level.
---
✅ Clear Trade Setup Summary:
Component Value
Direction Sell (Short)
Entry 0.6475–0.6485
Stop-Loss 0.6520
TP1 0.6400
TP2 0.6370
---
📌 Conclusion:
You are currently in a bearish setup after a breakdown from a rising structure. The market structure favors lower prices with clearly marked TP1 at 0.6400 and TP2 at 0.6370. Your entry zone (0.6475–0.6485) is technically sound, especially if there's a minor retracement.
Let me know if you want:
A Fibonacci analysis
RSI/MACD confirmation

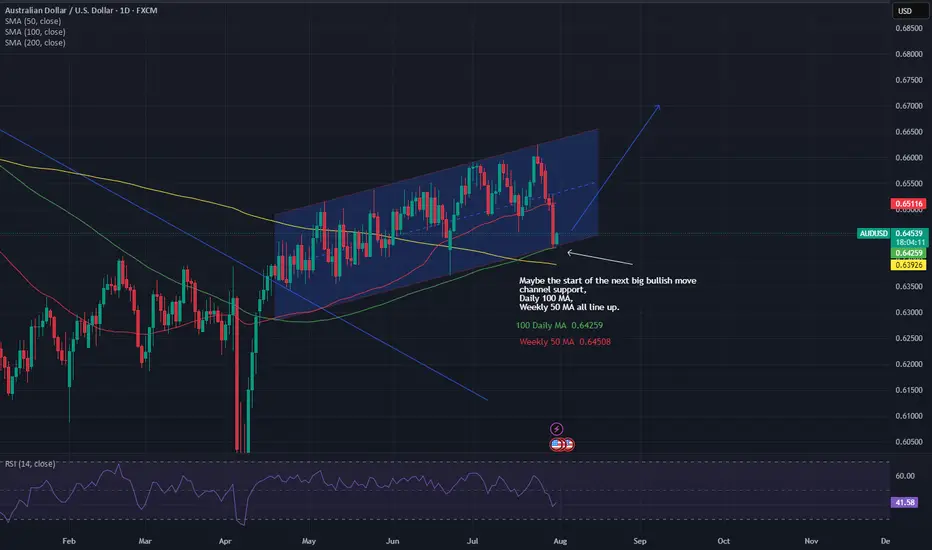
Could the next big AUD/USD Bullish up leg be readySimilar to NZD/USD look for the next big bullish up leg to start with channel support, Weekly 50 MA, Daily 100 Ma all lining up.