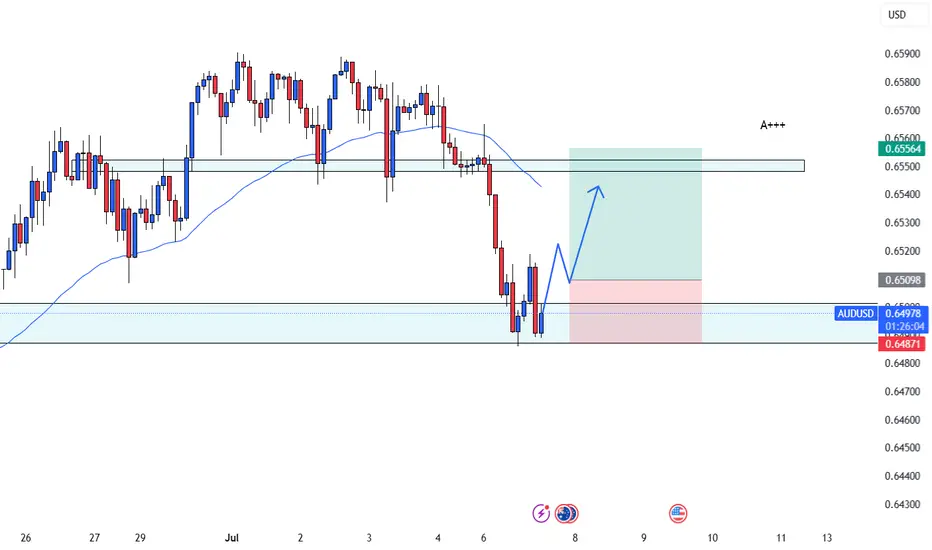
#AUDUSD: +1100 Pips Possible Swing Bullish Move! AUDUSD a strong sign of bullish behaviour has appeared alongside bullish momentum. As we have NFP tomorrow, we expect market to remain volatile; what we think now is to have market settled down before we can have any confirmation. We recommend to remain extra cautious tomorrow, once market get settled we can then enter with accurate risk management.
Like, comment and Share for more!
Team Setupsfx_
AUDUSD trade ideas
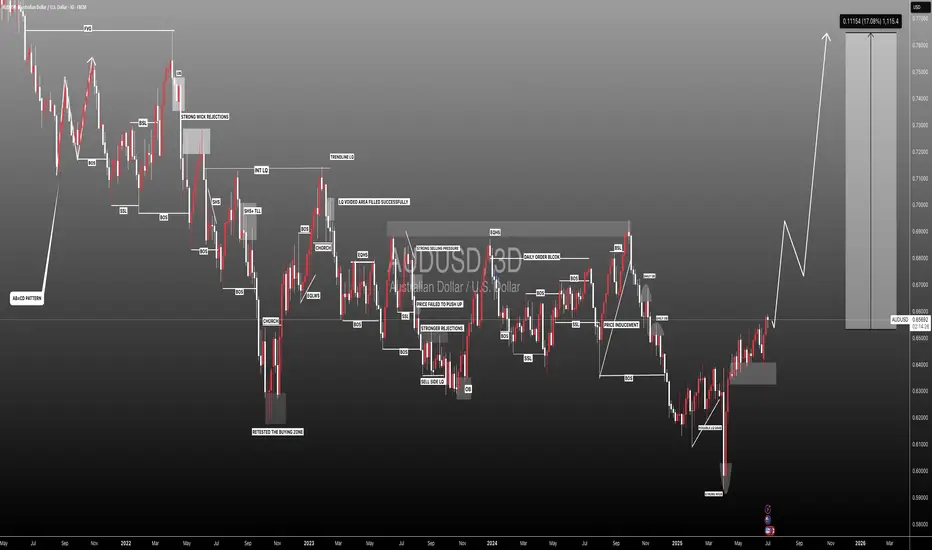
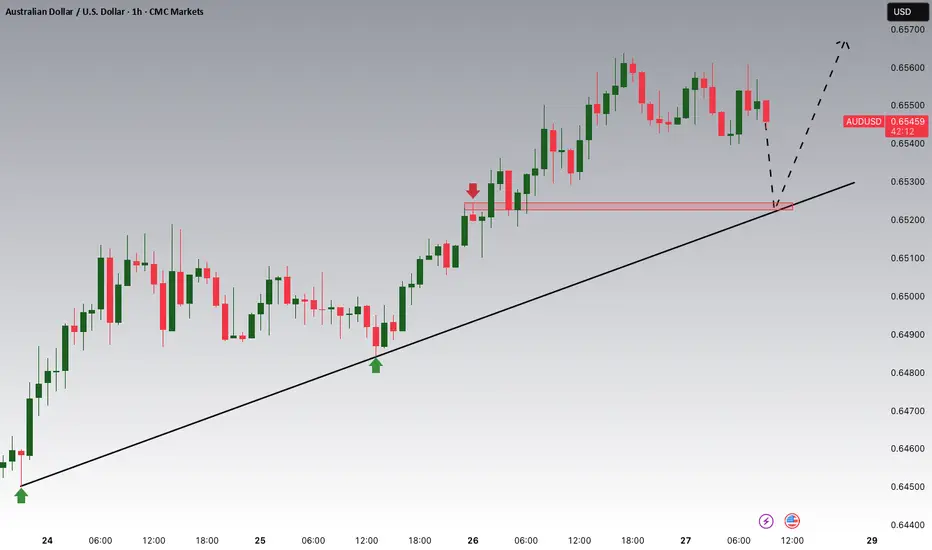
AUDUSD → Pre-breakout consolidation for trend continuationFX:AUDUSD may continue its upward trend. After another local distribution, the currency pair is consolidating and may repeat the cycle
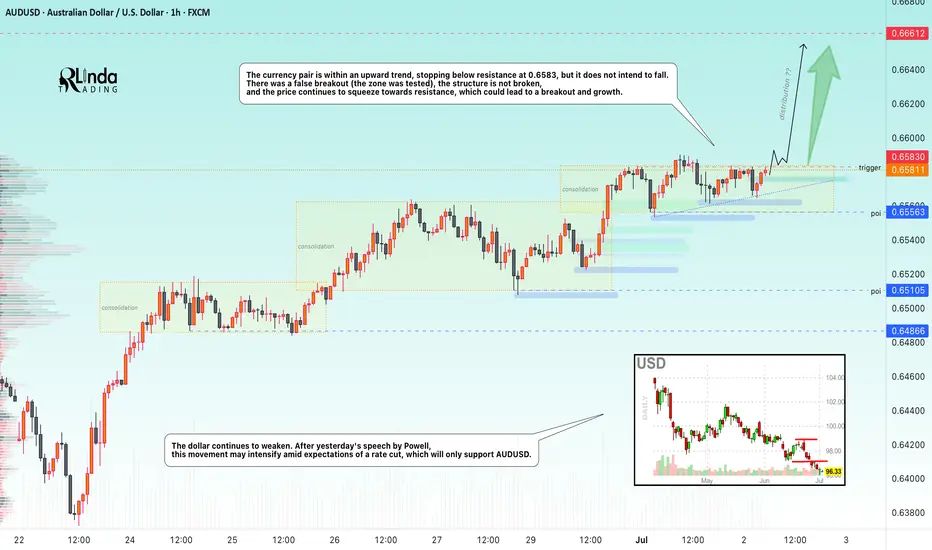
The dollar index continues to fall, the global trend is clear, and the price is testing multi-year lows. After yesterday's speech by Powell, the decline may intensify amid expectations of a rate cut, which will only support AUDUSD.
AUDUSD is moving within an uptrend, stopping below resistance at 0.6583, but is not going to fall.
There was a false breakout (the zone was tested), the structure is not broken, and the price continues to squeeze towards resistance, which could lead to a breakout and growth
Resistance levels: 0.6583
Support levels: 0.6566, 0.6556
There is potential accumulation in the market, and the market is choosing growth against the backdrop of a falling dollar as its direction. Accordingly, the currency pair is one step away from a possible realization phase. Thus, if the price breaks 0.6583 and consolidates above this zone, it may continue to grow in the short and medium term.
Best regards, R. Linda!
AUDUSD Potential UpsidesHey Traders, in today's trading session we are monitoring AUDUSD for a buying opportunity around 0.65500 zone, AUDUSD is trading in an uptrend and currently is in a correction phase in which it is approaching the trend at 0.65500 support and resistance area.
Trade safe, Joe.
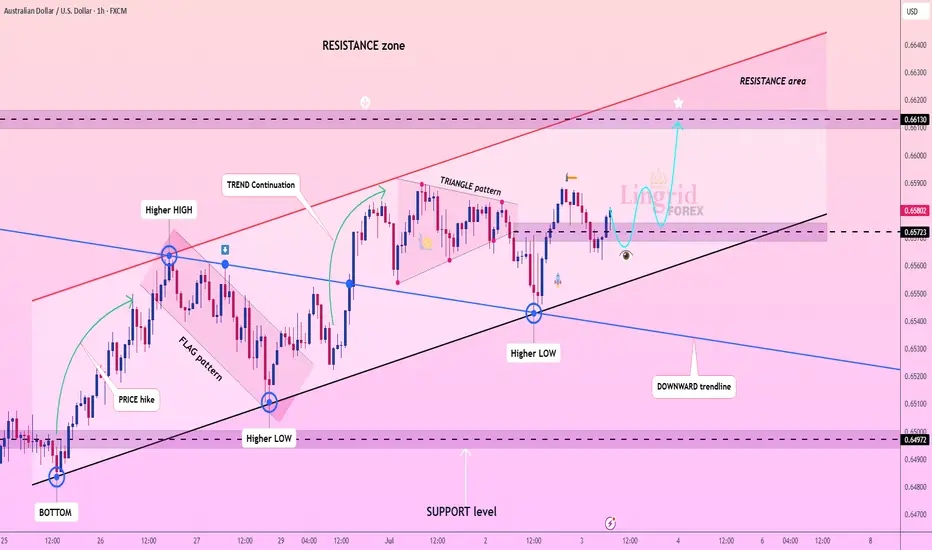
Lingrid | AUDUSD capitalizing on the BULLISH ContinuationOANDA:AUDUSD is forming higher lows above the key ascending trendline, showing clear signs of bullish structure continuation. After breaking out of the flag pattern and triangle, price is now consolidating just above the 0.6572 support zone. If buyers hold this level, a breakout toward the 0.6613 resistance area becomes increasingly likely.
📈 Key Levels
Buy zone: 0.6572–0.6580 (above trendline)
Sell trigger: break below 0.6572 trendline support
Target: 0.6613 resistance area
Buy trigger: bounce from trendline and continuation above minor resistance
💡 Risks
Failure to hold the ascending trendline may trigger deeper correction
Low volume during breakout attempts could invalidate the move
Strong resistance at 0.6613 may cause short-term rejection
If this idea resonates with you or you have your own opinion, traders, hit the comments. I’m excited to read your thoughts!
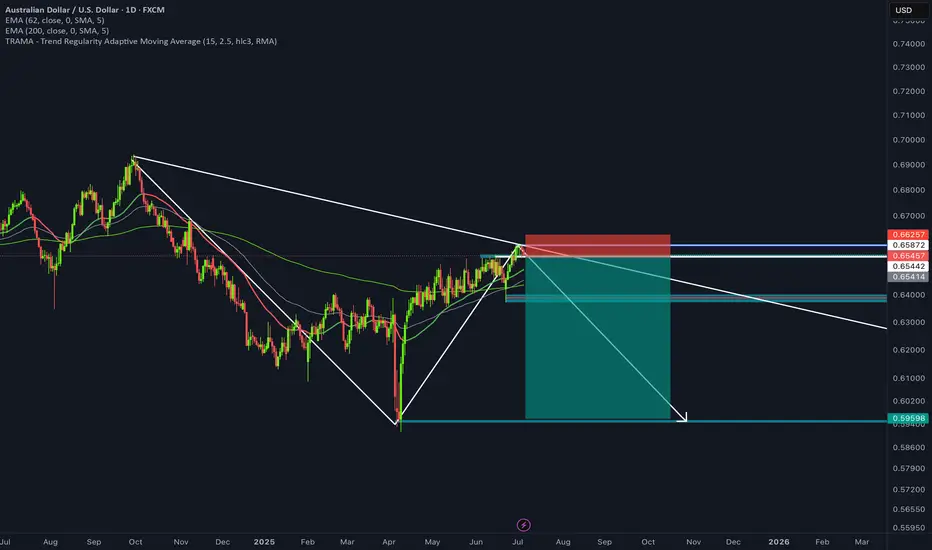
AUDUSDPotential swing trade SHORT!
- Within the daily time frame, we can see it respecting the bearish trendline. is this the retracement towards the downside?
- Bearish engulfing candles on all 3 time frames ( Daily, 4HR, 15M )
- overall bearish market structure in the higher time frame
- USD is starting to pick up some momentum after a rocky past few weeks
- high wicks on our supply zone giving us confirmation of sellers stepping
If you want more trades, or wantimng to get to learn how to trade drop me a message and we can get started
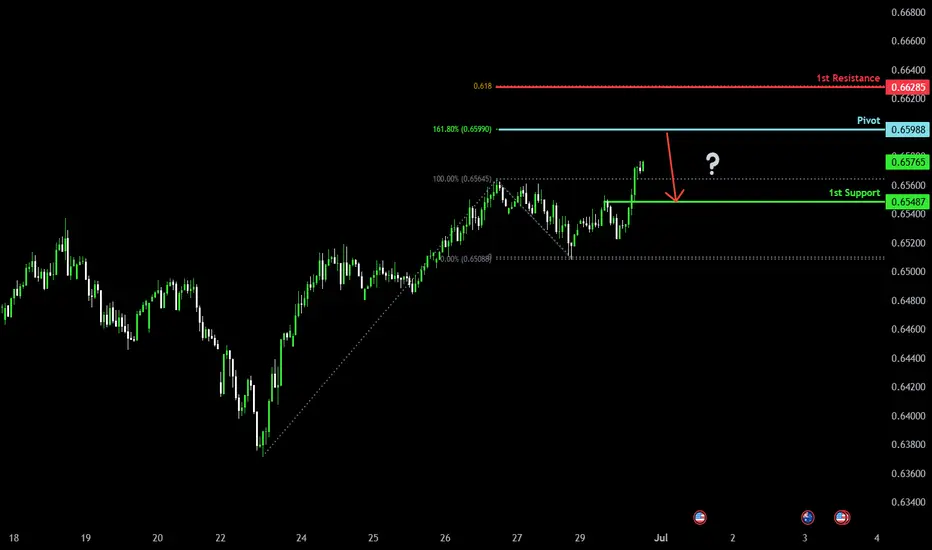
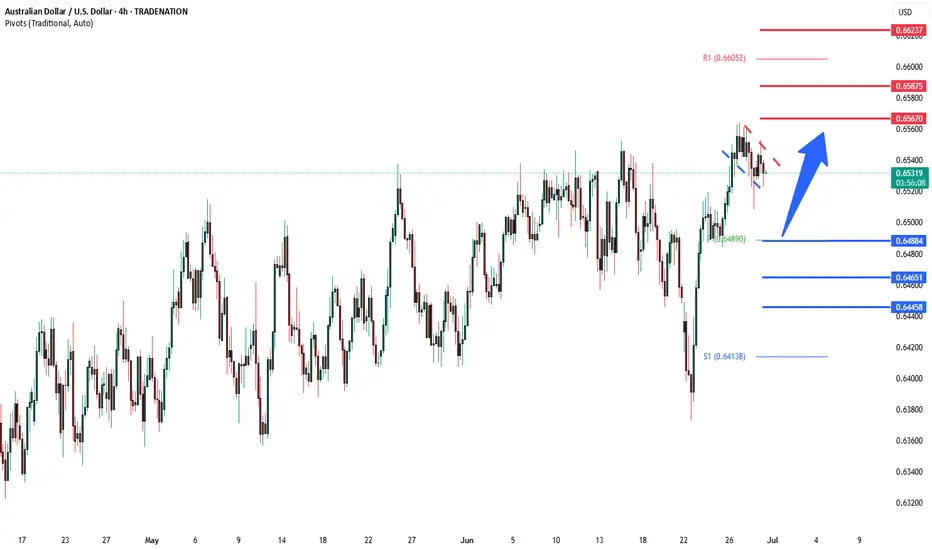
Could the Aussie reverse from here?The price is rising towards the pivot and could drop to the 1st support.
Pivot: 0.6598
1st Support: 0.6548
1st Resistance: 0.6628
Risk Warning:
Trading Forex and CFDs carries a high level of risk to your capital and you should only trade with money you can afford to lose. Trading Forex and CFDs may not be suitable for all investors, so please ensure that you fully understand the risks involved and seek independent advice if necessary.
Disclaimer:
The above opinions given constitute general market commentary, and do not constitute the opinion or advice of IC Markets or any form of personal or investment advice.
Any opinions, news, research, analyses, prices, other information, or links to third-party sites contained on this website are provided on an "as-is" basis, are intended only to be informative, is not an advice nor a recommendation, nor research, or a record of our trading prices, or an offer of, or solicitation for a transaction in any financial instrument and thus should not be treated as such. The information provided does not involve any specific investment objectives, financial situation and needs of any specific person who may receive it. Please be aware, that past performance is not a reliable indicator of future performance and/or results. Past Performance or Forward-looking scenarios based upon the reasonable beliefs of the third-party provider are not a guarantee of future performance. Actual results may differ materially from those anticipated in forward-looking or past performance statements. IC Markets makes no representation or warranty and assumes no liability as to the accuracy or completeness of the information provided, nor any loss arising from any investment based on a recommendation, forecast or any information supplied by any third-party.
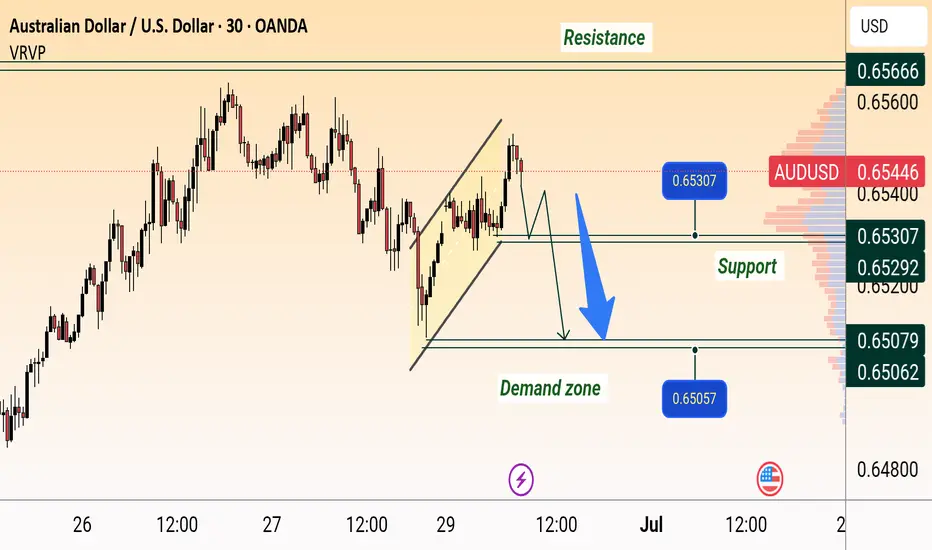
AUD/USD Bearish Reversal SetupAUD/USD Bearish Setup:
Price is showing rejection near resistance around 0.65600 and has broken below the rising channel. A retest of the broken trendline may lead to a drop towards the support zone at 0.65307, and potentially further to the demand zone around 0.65057–0.65000.
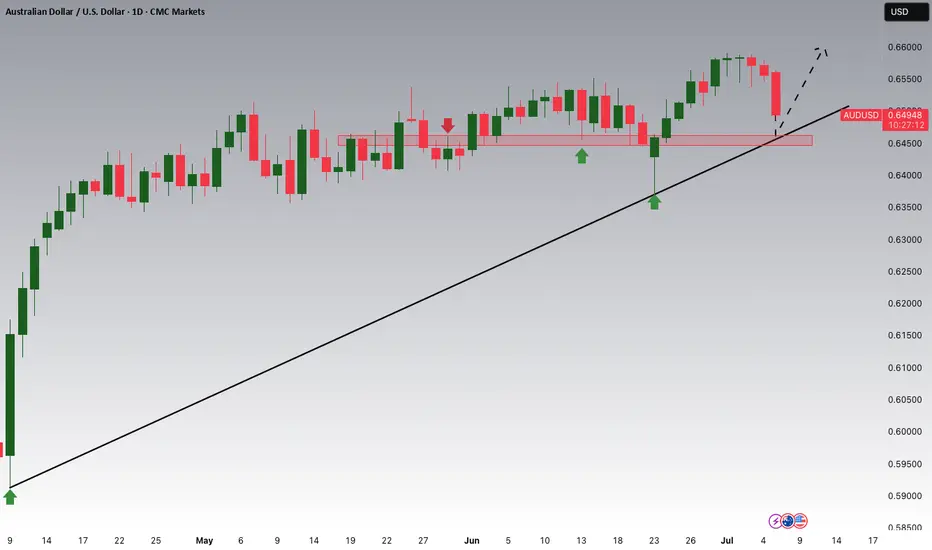
AUDUSD Bull Flag developing Trend Overview:
The AUDUSD currency price remains in a bullish trend, characterised by higher highs and higher lows. The recent intraday price action is forming a continuation consolidation pattern, suggesting a potential pause before a renewed move higher.
Key Technical Levels:
Support: 0.6465 (primary pivot), followed by 0.6445 and 0.6400
Resistance: 0.6570 (initial), then 0.6590 and 0.6625
Technical Outlook:
A pullback to the 0.6465 level, which aligns with the previous consolidation zone, could act as a platform for renewed buying interest. A confirmed bounce from this support may trigger a continuation toward the next resistance levels at 0.6570, 0.6590, and ultimately 0.6625.
Conversely, a daily close below 0.6465 would suggest weakening bullish momentum. This scenario would shift the bias to bearish in the short term, potentially targeting 0.6445 and 0.6400 as downside levels.
Conclusion:
AUDUSD maintains a bullish structure while trading above the 0.6465 support. A bounce from this level would validate the consolidation as a continuation pattern, with upside potential toward the 0.6570 area. A breakdown below 0.6465, however, would invalidate this view and suggest deeper corrective risk.
This communication is for informational purposes only and should not be viewed as any form of recommendation as to a particular course of action or as investment advice. It is not intended as an offer or solicitation for the purchase or sale of any financial instrument or as an official confirmation of any transaction. Opinions, estimates and assumptions expressed herein are made as of the date of this communication and are subject to change without notice. This communication has been prepared based upon information, including market prices, data and other information, believed to be reliable; however, Trade Nation does not warrant its completeness or accuracy. All market prices and market data contained in or attached to this communication are indicative and subject to change without notice.
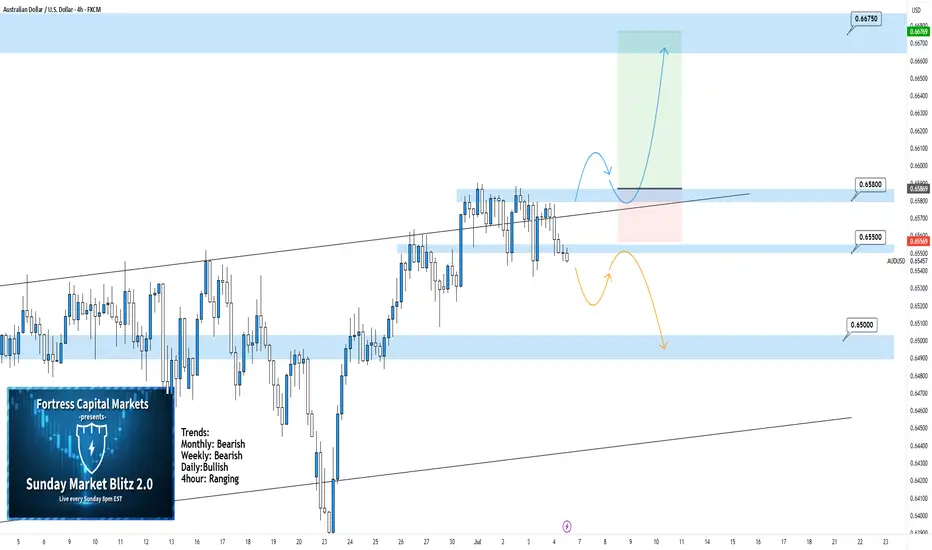
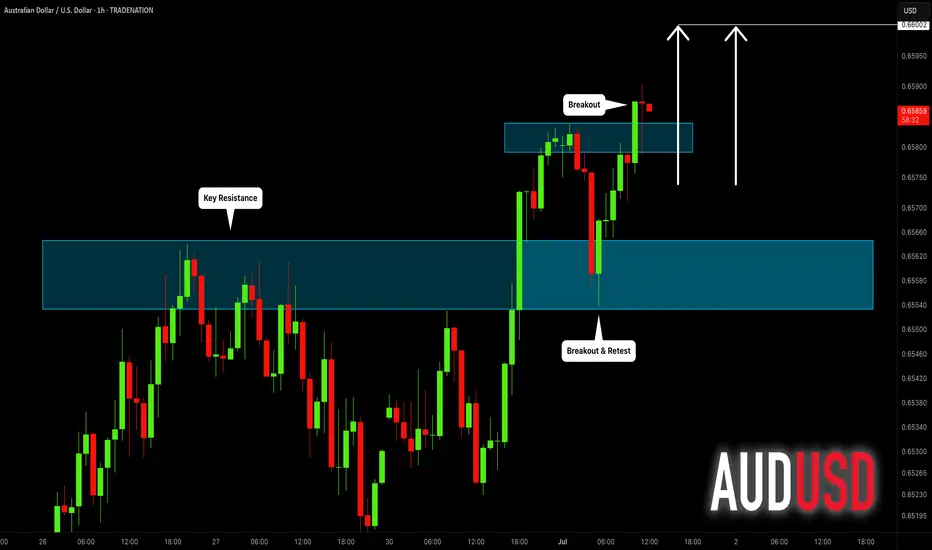
AUDUSD 4hour TF - July 6th, 2025AUDUSD 7/6/2025
AUDUSD 4hour Neutral idea
Monthly - Bearish
Weekly - Bearish
Dailly - Bullish
4hour - Ranging
We are still technically bullish overall but we can see here on the 4hour that AU is ranging between 0.65800 & 0.65500. This is a fairly small range so we’re not that interested in taking trades while price action is bouncing between these two zones.
We’re looking for conviction above 0.65800 or below 0.65500 before we can comfortably make a move. Let’s see what both of those situations would look like:
Bullish Continuation - Most of the trend data is suggesting AU is still bullish but we would need to see a strong push above resistance around 0.65800 with a confirmed higher low above before getting into any trades. If we do see this play out I'm looking toward 0.66750 resistance as a target.
Reversal back into channel - Price action seems to be poking out of the bottom of this range but we are still not convinced just yet. For us to strongly consider this a bearish move we would like to see a retest of 0.65500 as resistance followed by bearish conviction. Look for price action to move lower toward key support areas if this happens.
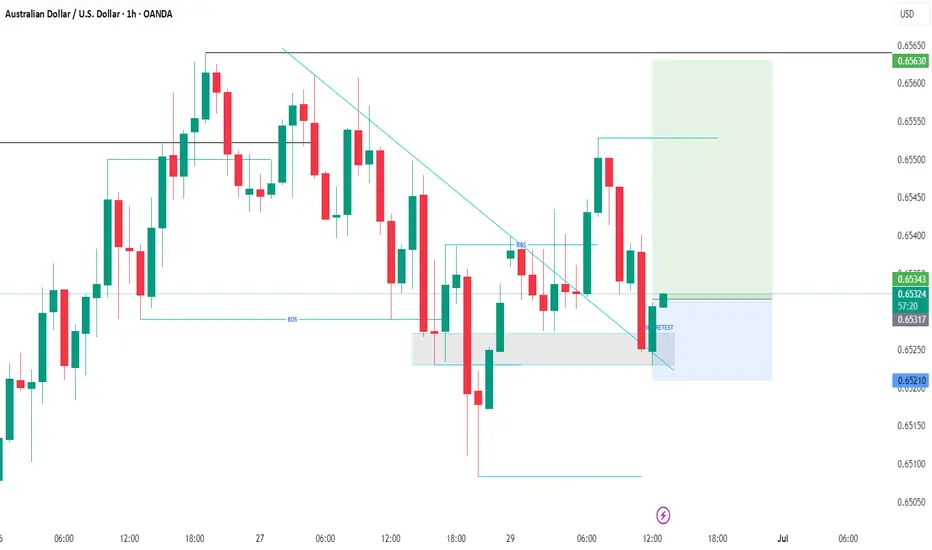
AUDUSD BUY SETUPWe have transitioned from a downtrend to and up trend as shown by the transition for lower low and lower high to a higher high and potential higher low. we have pulled back to a key level for an entry.
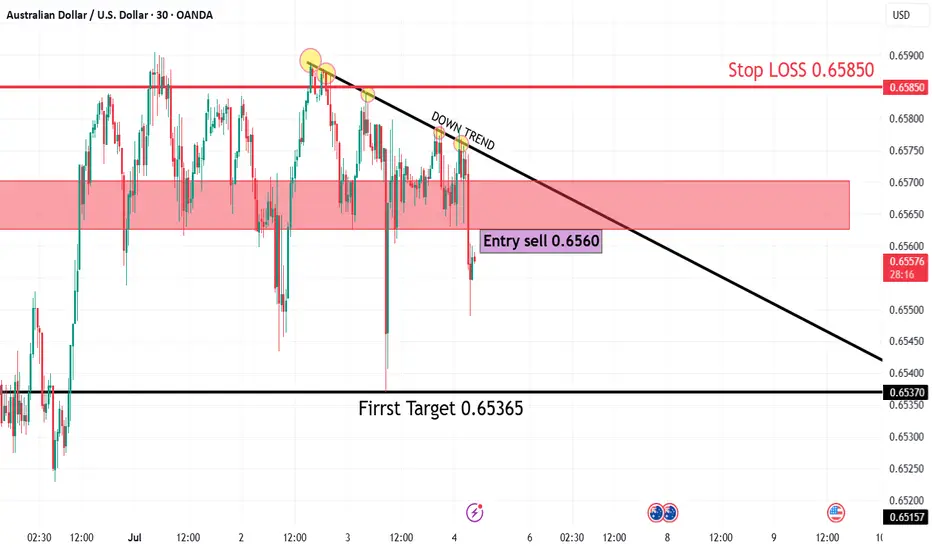
AUD/USD30 Mins Frame
🧠 Technical Overview:
The pair is moving in a clear downtrend, as confirmed by the descending trendline connecting multiple lower highs.
Every bullish attempt has been rejected at this trendline, showing strong seller pressure.
🧩 Key Technical Elements:
1. Downtrend Line:
Accurately drawn across descending highs.
Price has tested and rejected from this line multiple times, confirming its strength as a dynamic resistance.
2. Supply Zone:
Highlighted in red between 0.6565 and 0.6575.
Price entered this zone and was immediately rejected, reinforcing bearish sentiment.
3. Entry Point:
Sell at 0.6560, after price failed to break above both the supply zone and trendline resistance.
4. Stop Loss:
0.65850, placed just above the supply zone and the previous high — a safe level to exit if the setup fails.
5. Target Levels:
First Target: 0.65365 – a minor support level and reasonable short-term target.
Major Target: 0.65157 – a stronger previous support and potential reversal point.
📉 Expected Price Action:
As long as the price stays below the trendline and supply zone, further downside is expected.
The most recent price action shows a false breakout above resistance followed by a sharp drop, typical behavior in a downtrend.
🔥 Risk-to-Reward Ratio (R:R):
First Target:
Risk: 0.65850 – 0.6560 = 25 pips
Reward: 0.6560 – 0.65365 = 23.5 pips
→ R:R ≈ 1:1
Major Target:
Reward: 0.6560 – 0.65157 = 44.3 pips
→ R:R ≈ 1.8:1
✅ Solid R:R ratio especially toward the major target.
✅ Conclusion:
This is a technically sound short setup in line with the dominant downtrend.
The rejection from both the supply zone and trendline strengthens the bearish case.
Suitable for short- to medium-term traders, with clearly defined risk management.
#AUDUSD:We are yet to see weaken USD! AUDUSD to make yearly highAUDUSD hasn’t seen strong bullish volume yet, but tomorrow’s NFP will be crucial for determining the future trend of the AUDUSD. Based on your analysis, you can set multiple targets.
If you like our work and want to support us, you can do so by following us:
-Liking our ideas
-Commenting on our ideas
-Sharing
Team Setupsfx_
❤️🚀

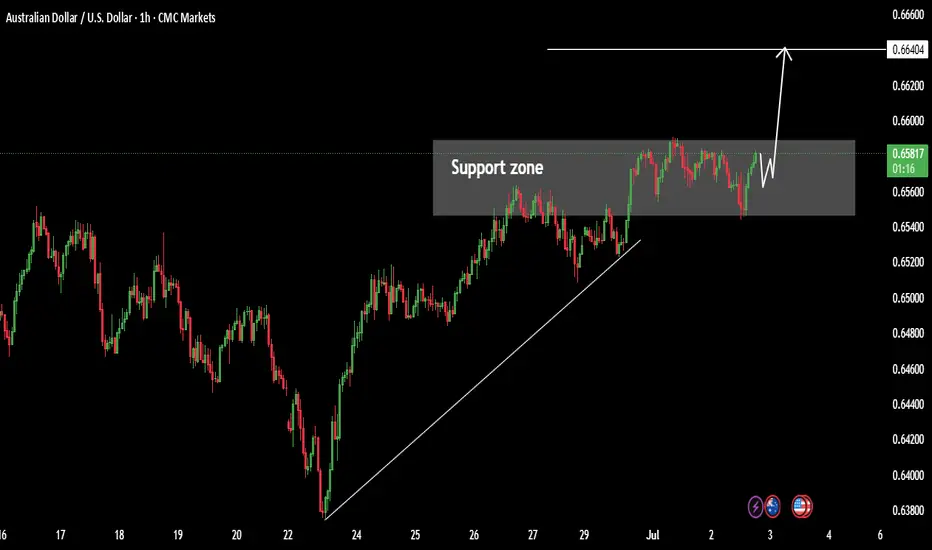
AUDUSD: Bullish Continuation After Breakout 🇦🇺🇺🇸
AUDUSD is going to rise more following a bullish breakout
of a key daily/intraday horizontal resistance.
Next goal - 0.66
❤️Please, support my work with like, thank you!❤️
I am part of Trade Nation's Influencer program and receive a monthly fee for using their TradingView charts in my analysis.
AUSUSD Breakout May continue GrowthAUDUSD Looking Precious High Bullish Pattern continue there Uptrend.
Here the some fallowing knowledge about AUSDUSD The dollar continues to bullish the global trend is clear and the price is testing multi year lows after yesterday Speech Powel the decline may continue AUDUSD is moving with in uptrend and move to our target ang catching there strong levels.
Resistance Levels 0.66400
Support Levels 0.65500
Hit the like if you find better analysis like this Hope this analysis is better for trading journey.
if you need any help about regarding trading and any Question share in comments.
AUDUSD Potential UpsidesHey Traders, in today's trading session we are monitoring AUDUSD for a buying opportunity around 0.64600 zone, AUDUSD is trading in an uptrend and currently is in a correction phase in which it is approaching the trend at 0.64600 support and resistance area.
Trade safe, Joe.
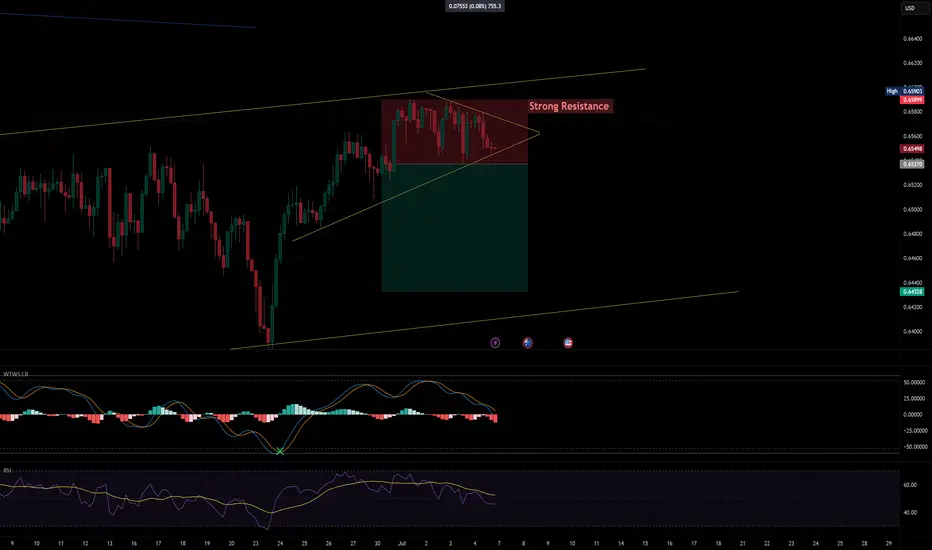
A strong resistance level AUDUSD🚨 Perfect Setup Alert!
A strong resistance level is holding firm 🔒 and guess what?
❌ Negative news hitting the Aussie 🇦🇺
✅ Positive momentum backing the US Dollar 🇺🇸
Add to that a week-long overbought zone 📈.
📉 The downtrend has begun — and we're ready to ride the wave of profits! 💰
#AUDUSD
AUDUSD long positionThe AUD/USD 2-hour chart shows a strong buy opportunity as price reacts to a key support zone. Multiple rejections with long lower wicks signal strong buyer interest, suggesting a potential bullish reversal. The setup offers a great risk-to-reward ratio, with a tight stop below support and a wide target above. If price breaks above the 50 EMA, it would further confirm bullish momentum.
AUDUSDHello Traders! 👋
What are your thoughts on AUDUSD?
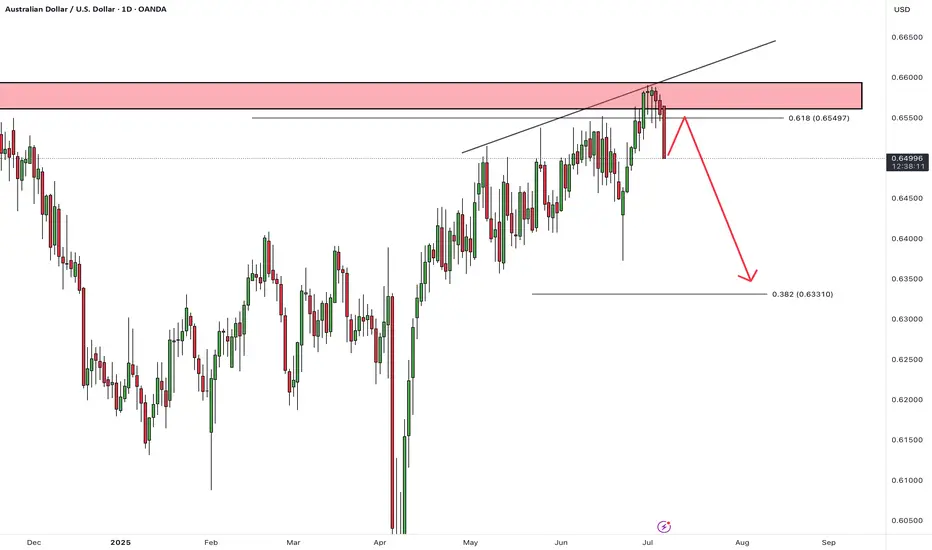
The AUDUSD pair reached a resistance zone, which was accompanied by a negative divergence, signaling weakening bullish momentum. This led to a bearish reaction from that area.
We expect that, after some consolidation around this resistance, the pair will likely continue its decline at least toward the specified support level.
Don’t forget to like and share your thoughts in the comments! ❤️
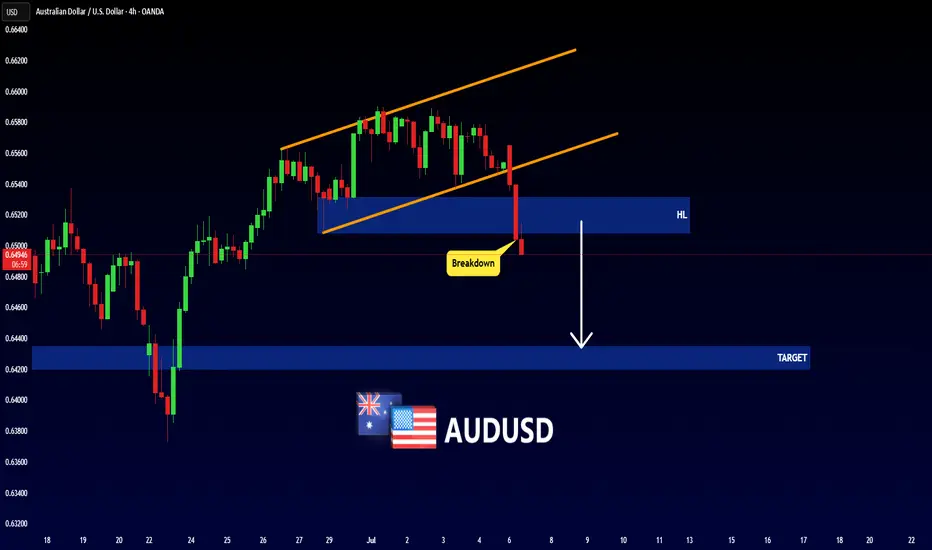
AUDUSD - BEARISH MOVEHello Traders !
The AUDUSD failed to create a new higher high!
The price broke the higher low (change of character).
So, I expect a bearish move📉
_________________
TARGET: 0.64350🎯
AUDUSD Potential UpsidesHey Traders, in today's trading session we are monitoring AUDUSD for a buying opportunity around 0.65300 zone, AUDUSD is trading in an uptrend and currently is in a correction phase in which it is approaching the trend at 0.65300 support and resistance area.
Trade safe, Joe.
I love a fresh daily structure break, here's why.......All the information you need to find a high probability trade are in front of you on the charts so build your trading decisions on 'the facts' of the chart NOT what you think or what you want to happen or even what you heard will happen. If you have enough facts telling you to trade in a certain direction and therefore enough confluence to take a trade, then this is how you will gain consistency in you trading and build confidence. Check out my trade idea!!
tradingview.sweetlogin.com

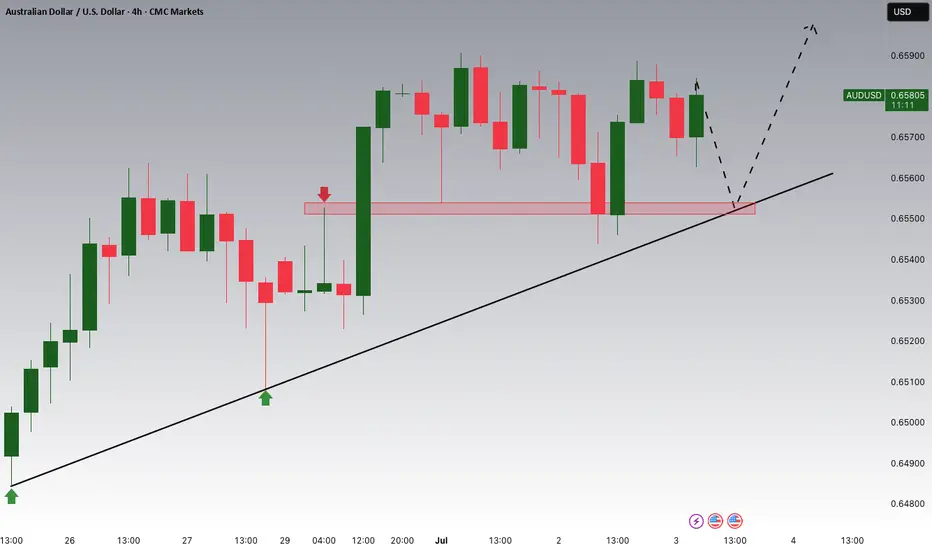
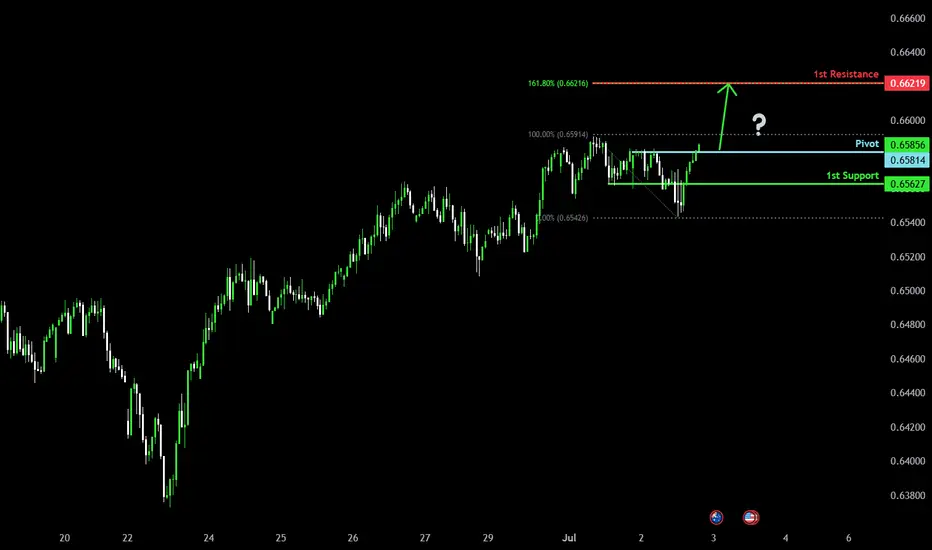
Could we see bullish continuation?The Aussie (AUD/USD) is reacting off the pivot and could rise to the 1st resistance which aligns with the 161.8% Fibonacci extension.
Pivot: 0.6581
1st Support: 0.6562
1st Resistance: 0.6621
Risk Warning:
Trading Forex and CFDs carries a high level of risk to your capital and you should only trade with money you can afford to lose. Trading Forex and CFDs may not be suitable for all investors, so please ensure that you fully understand the risks involved and seek independent advice if necessary.
Disclaimer:
The above opinions given constitute general market commentary, and do not constitute the opinion or advice of IC Markets or any form of personal or investment advice.
Any opinions, news, research, analyses, prices, other information, or links to third-party sites contained on this website are provided on an "as-is" basis, are intended only to be informative, is not an advice nor a recommendation, nor research, or a record of our trading prices, or an offer of, or solicitation for a transaction in any financial instrument and thus should not be treated as such. The information provided does not involve any specific investment objectives, financial situation and needs of any specific person who may receive it. Please be aware, that past performance is not a reliable indicator of future performance and/or results. Past Performance or Forward-looking scenarios based upon the reasonable beliefs of the third-party provider are not a guarantee of future performance. Actual results may differ materially from those anticipated in forward-looking or past performance statements. IC Markets makes no representation or warranty and assumes no liability as to the accuracy or completeness of the information provided, nor any loss arising from any investment based on a recommendation, forecast or any information supplied by any third-party.
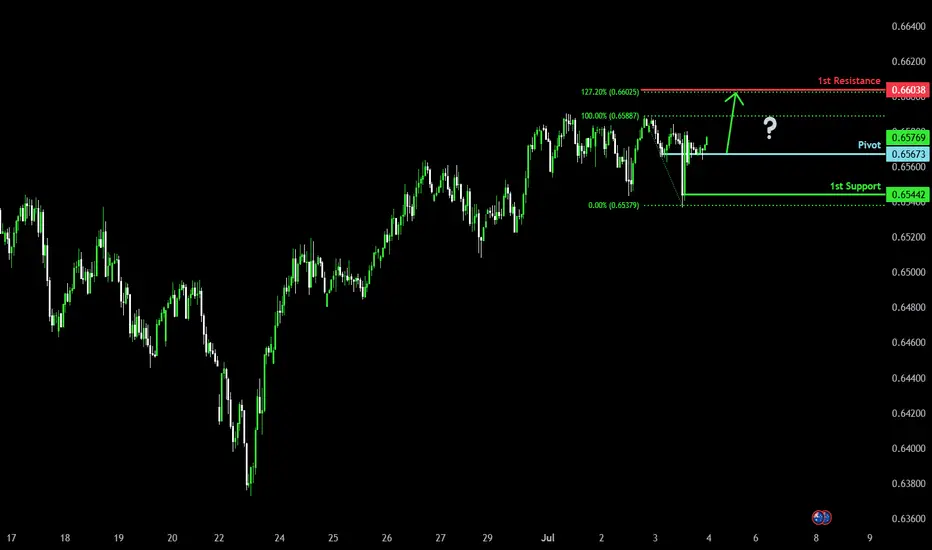
Bullish bounce off pullback support?The Aussie (AUD/USD) has bounced off the pivot and could rise to the 1st resistance, which lines up with the 127.2% Fibonacci extension.
Pivot: 0.6567
1st Support: 0.6544
1st Resistance: 0.6603
Risk Warning:
Trading Forex and CFDs carries a high level of risk to your capital and you should only trade with money you can afford to lose. Trading Forex and CFDs may not be suitable for all investors, so please ensure that you fully understand the risks involved and seek independent advice if necessary.
Disclaimer:
The above opinions given constitute general market commentary, and do not constitute the opinion or advice of IC Markets or any form of personal or investment advice.
Any opinions, news, research, analyses, prices, other information, or links to third-party sites contained on this website are provided on an "as-is" basis, are intended only to be informative, is not an advice nor a recommendation, nor research, or a record of our trading prices, or an offer of, or solicitation for a transaction in any financial instrument and thus should not be treated as such. The information provided does not involve any specific investment objectives, financial situation and needs of any specific person who may receive it. Please be aware, that past performance is not a reliable indicator of future performance and/or results. Past Performance or Forward-looking scenarios based upon the reasonable beliefs of the third-party provider are not a guarantee of future performance. Actual results may differ materially from those anticipated in forward-looking or past performance statements. IC Markets makes no representation or warranty and assumes no liability as to the accuracy or completeness of the information provided, nor any loss arising from any investment based on a recommendation, forecast or any information supplied by any third-party.