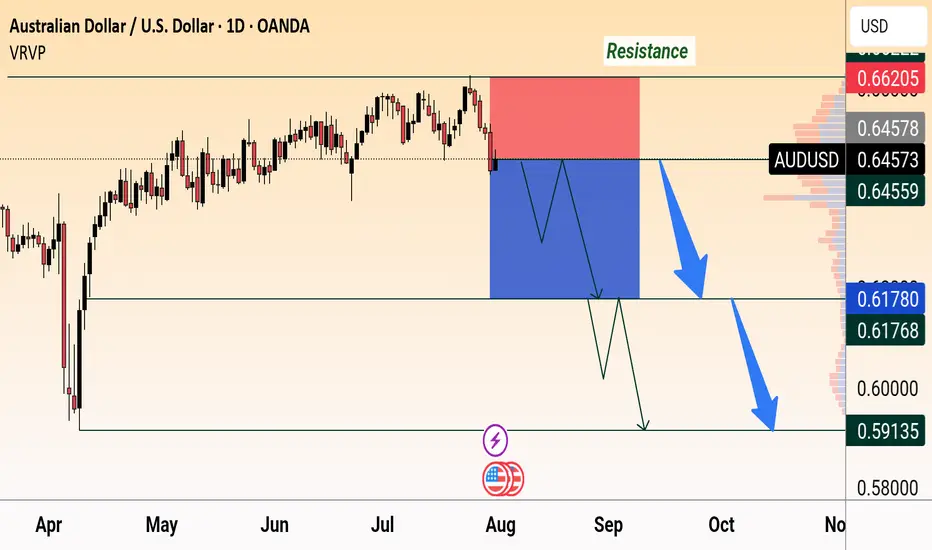
AUD/USD Bearish OutlookAUD/USD faces strong resistance at 0.6620 and is showing bearish momentum. Price is expected to drop below 0.6450 with targets near 0.6178 and 0.5913, following a possible consolidation.
AUDUSD trade ideas
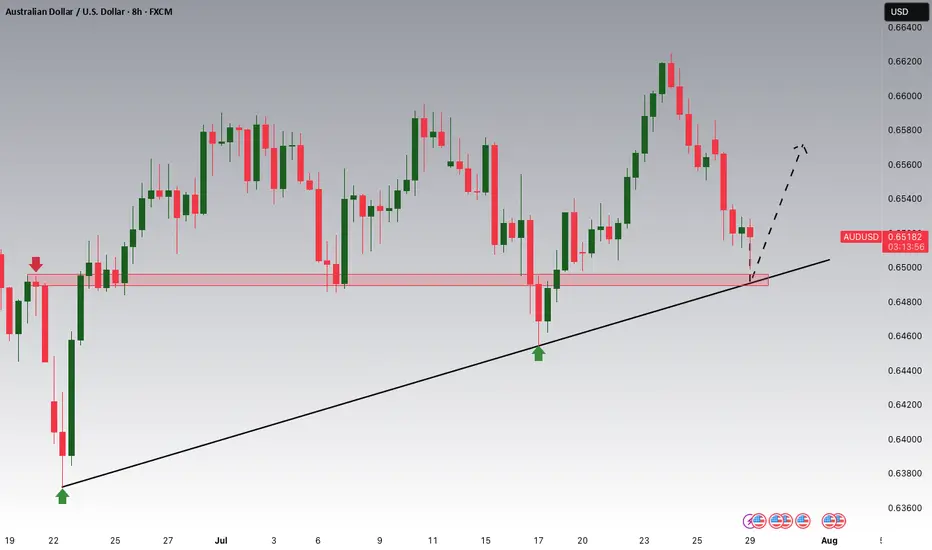
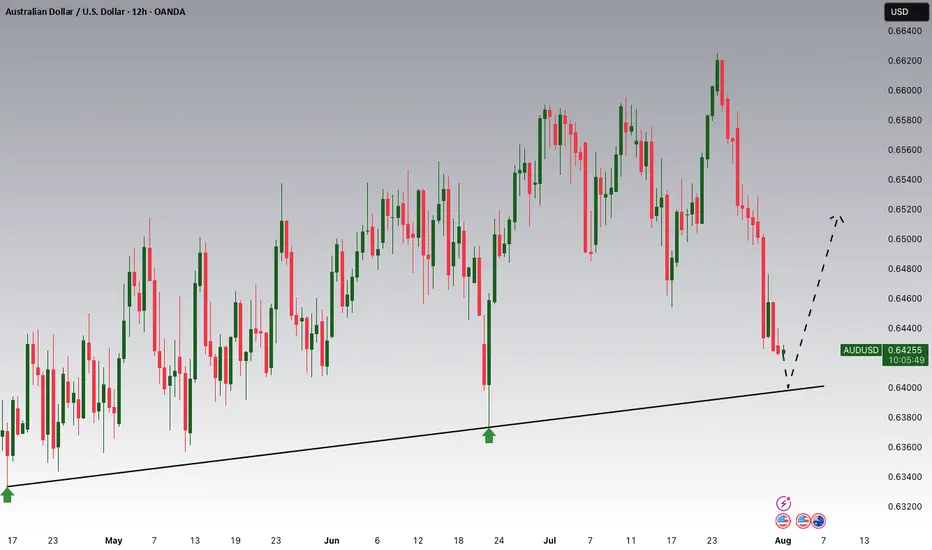
AUDUSD Potential UpsidesHey Traders, in today's trading session we are monitoring AUDUSD for a buying opportunity around 0.64900 zone, AUDUSD is trading in an uptrend and currently is in a correction phase in which it is approaching the trend at 0.64900 support and resistance area.
Trade safe, Joe.
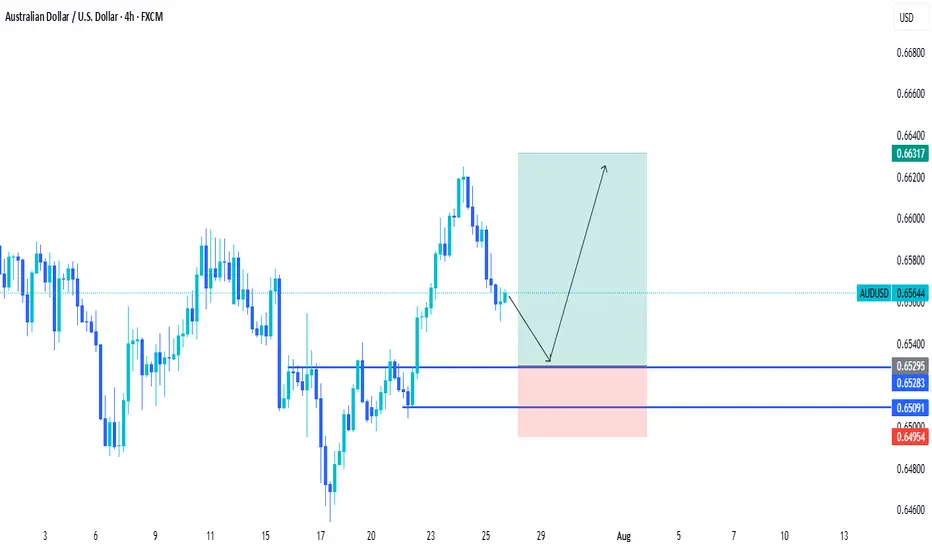
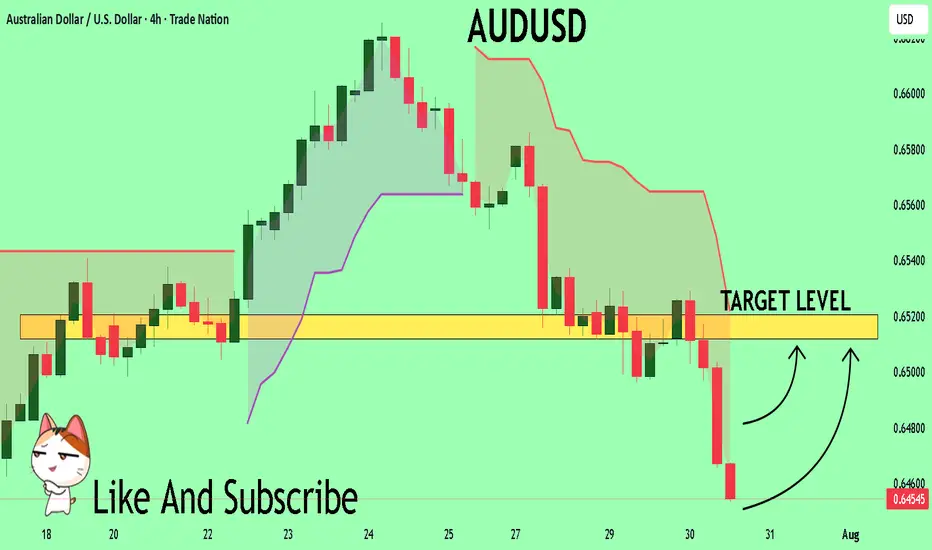
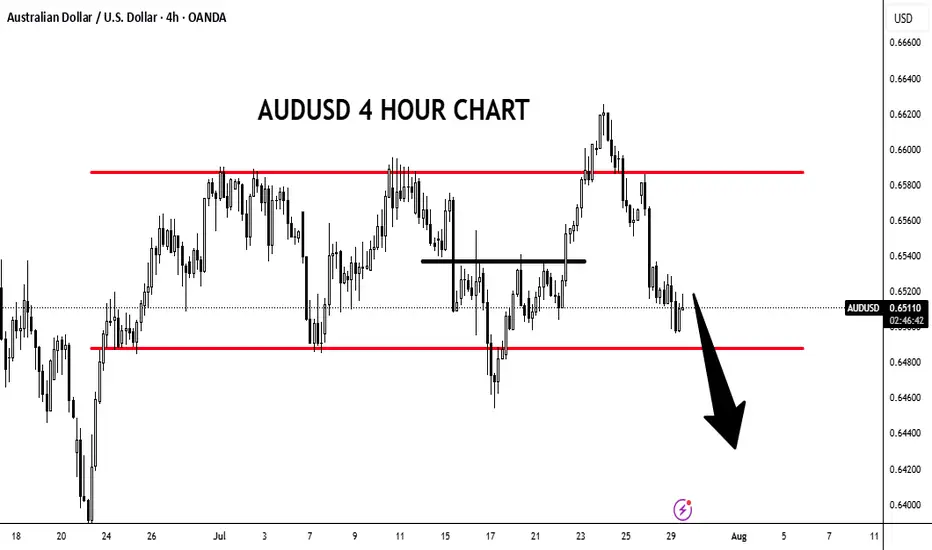
AUDUSD: Bearish Continuation from broken supportThe current setup is a clean example of a trend continuation play. Price recently broke decisively below a structure zone, this break and retest now flips the narrative, what once was a buy zone is now an opportunity for short entries.
Following the aggressive move down, price now began pulling back into that broken zone. The move appears corrective rather than impulsive, characterized by a slower, more rounded structure typical of pullback leg. This is classic behavior in continuation setups: fast drop, slow retrace, and then potential for the next leg lower.
The projected move targets a retest of the swing low at 0.63800. That level is significant, it's a level where prior demand reacted strongly and now it serves as the next probable magnet for price.
What makes this continuation trade high probability is the sharpness of the prior bearish impulse as it signals intent. The market seems to be in a controlled bearish sequence, where sellers dominate momentum and retracements offer fresh entries for trend followers.
The structure and zone alignment all point in the same direction continuation lower, not reversal.
Let me know in the comments what you think
Disclosure: I am part of Trade Nation's Influencer program and receive a monthly fee for using their TradingView charts in my analysis.
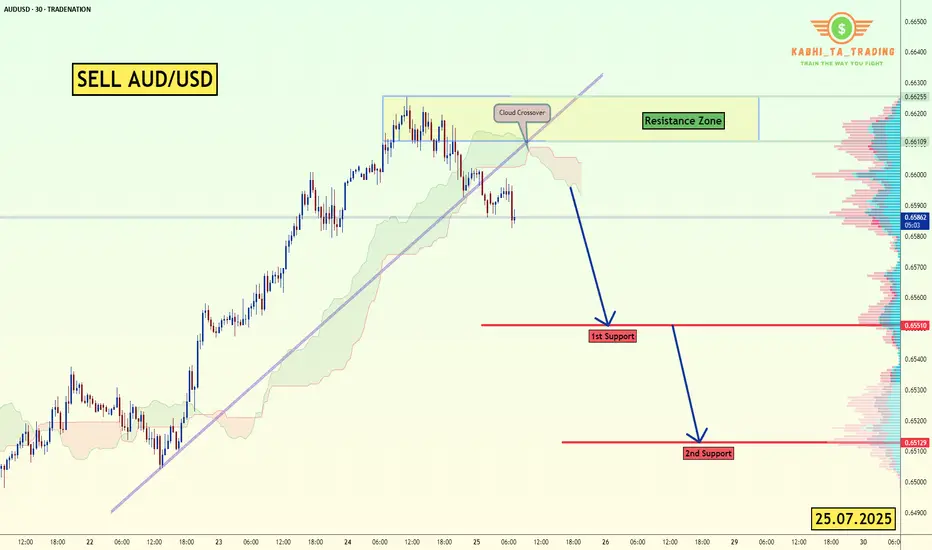
AUD/USD - Breakout (25.07.2025)The AUD/USD Pair on the M30 timeframe presents a Potential Selling Opportunity due to a recent Formation of a Trendline Pattern. This suggests a shift in momentum towards the downside in the coming hours.
Possible Short Trade:
Entry: Consider Entering A Short Position around Trendline Of The Pattern.
Target Levels:
1st Support – 0.6551
2nd Support – 0.6513
🎁 Please hit the like button and
🎁 Leave a comment to support for My Post !
Your likes and comments are incredibly motivating and will encourage me to share more analysis with you.
Best Regards, KABHI_TA_TRADING
Thank you.
Disclosure: I am part of Trade Nation's Influencer program and receive a monthly fee for using their TradingView charts in my analysis.
AUDUSD Potential UpsidesHey Traders, in today's trading session we are monitoring AUDUSD for a buying opportunity around 0.64000 zone, AUDUSD is trading in an uptrend and currently is in a correction phase in which it is approaching the trend at 0.64000 support and resistance area.
Trade safe, Joe.
30.07.25 Morning ForecastPairs on Watch -
FX:AUDUSD
FX:NZDUSD
FX:EURUSD
A short overview of the instruments I am looking at for today, multi-timeframe analysis down to what I will be looking at for an entry. Enjoy!

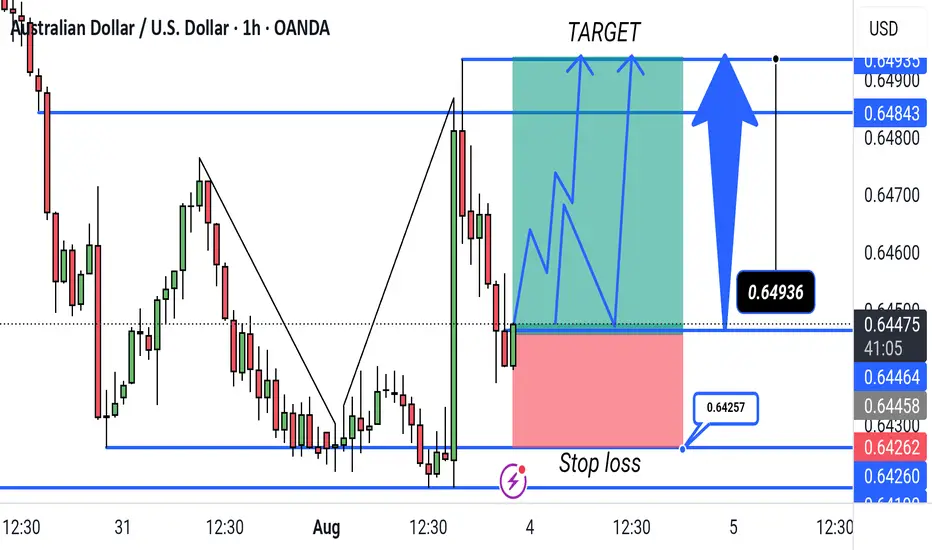
"AUD/USD Bullish Breakout Setup – 1H Timeframe. This chart shows a bullish trade setup for AUD/USD on the 1-hour timeframe. The entry is near 0.64464, with a target at 0.64843 and a stop loss at 0.64257. The trade aims to capitalize on a potential upward breakout following a support bounce.
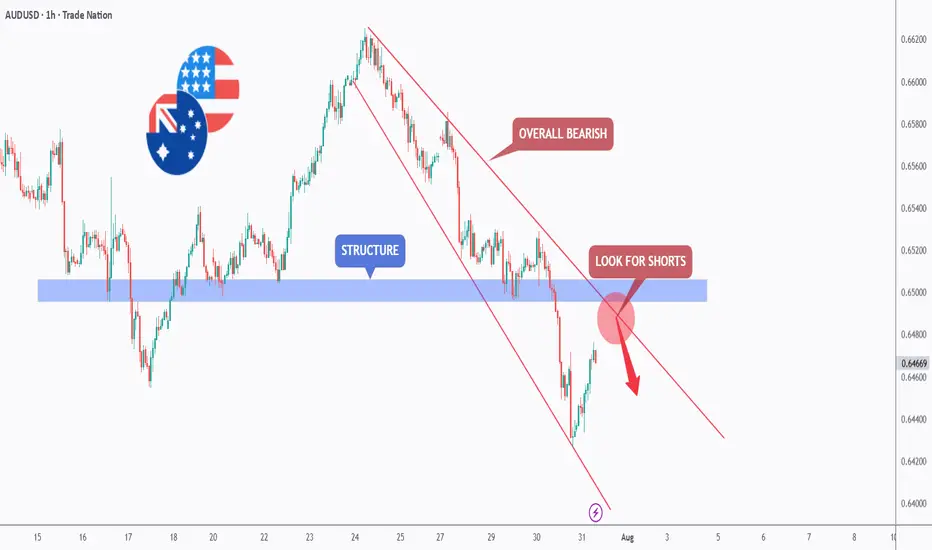
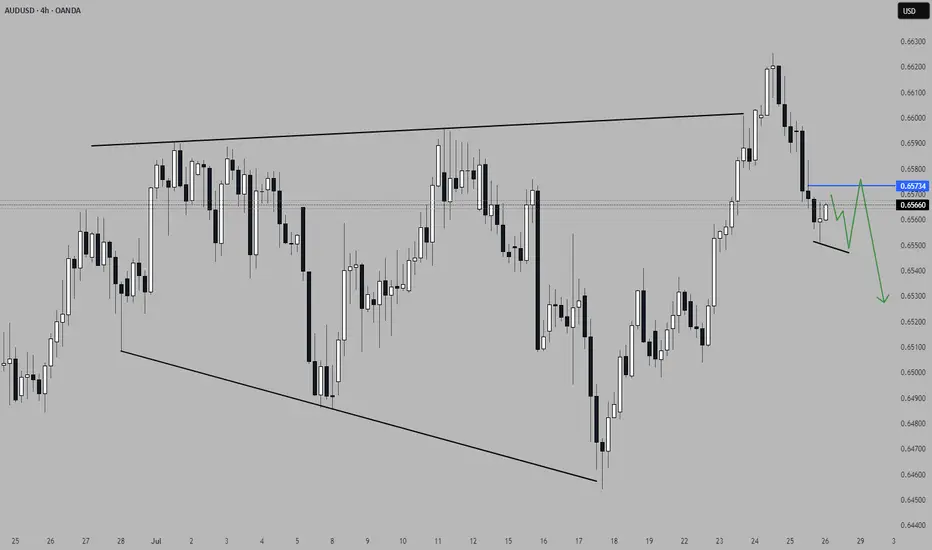
Sell the Rip? AUDUSD Retest Zone AlertHello TradingView Family / Fellow Traders. This is Richard, also known as theSignalyst.
📈AUDUSD has been overall bearish , trading within the falling red channel and it is currently retesting the upper bound of the channel.
Moreover, it is rejecting a structure marked in blue.
📚 As per my trading style:
As #AUDUSD approaches the red circle zone, I will be looking for trend-following sell setups on lower timeframes. (like a double top pattern, trendline break , and so on...)
📚 Always follow your trading plan regarding entry, risk management, and trade management.
Good luck!
All Strategies Are Good; If Managed Properly!
~Rich
Disclosure: I am part of Trade Nation's Influencer program and receive a monthly fee for using their TradingView charts in my analysis.
AUDUSD BUY SETUPAUDUSD is bullish on the daily timeframe and is currently retracing to continue buying. I want to see structural liquidity taken and tap my entry before continuing to the upside.
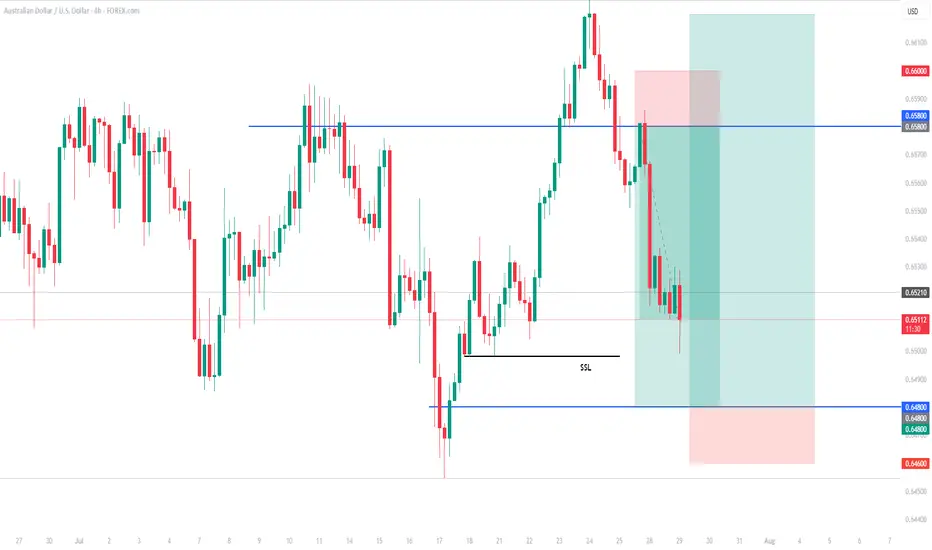
AUDUSD BUYThe AUD/USD pair is trading around 0.6520 on Tuesday. The daily chart’s technical analysis indicates a prevailing bullish bias as the pair remains within the ascending channel pattern. However, the 14-day Relative Strength Index (RSI) has moved below the 50 mark, indicating that a bearish bias is active. Additionally, the pair is positioned below the nine-day Exponential Moving Average (EMA), indicating that short-term price momentum is weaker.
The US and EU reached a framework trade agreement on Sunday that sets 15% tariffs on most European goods, taking effect on August 1. This deal has ended a months-long stand-off, per Bloomberg.
Traders keep their eyes on further developments in the US-China trade talks. The discussions are set to resume on Tuesday after top economic officials from both nations held over five hours of negotiations in Stockholm on Monday. The purpose of this meeting is to resolve ongoing disputes and extend their trade truce by another three months.
US Treasury Chief Scott Bessent met with China’s Vice Premier He Lifeng at Sweden’s Rosenbad government offices. The meeting comes ahead of an August 12 deadline to finalize a long-term tariff agreement with the Trump administration, building on preliminary deals reached in May and June that had helped ease tensions.
The US Federal Reserve (Fed) is widely expected to keep the benchmark interest rate steady between 4.25% and 4.50% at its July meeting. The FOMC press conference will be observed for any signs that rate cuts may start in September.
The Reserve Bank of Australia (RBA) is expected to closely watch the June labor force data and second-quarter inflation figures before deciding on a potential rate cut. Both the monthly and quarterly CPI reports are scheduled for release later this week.
SUPPORT 0.65593
SUPPORT 0.65424
SUPPORT 0.65593
RESISTSNCE 0.65050
RESISTANCE 0.64973
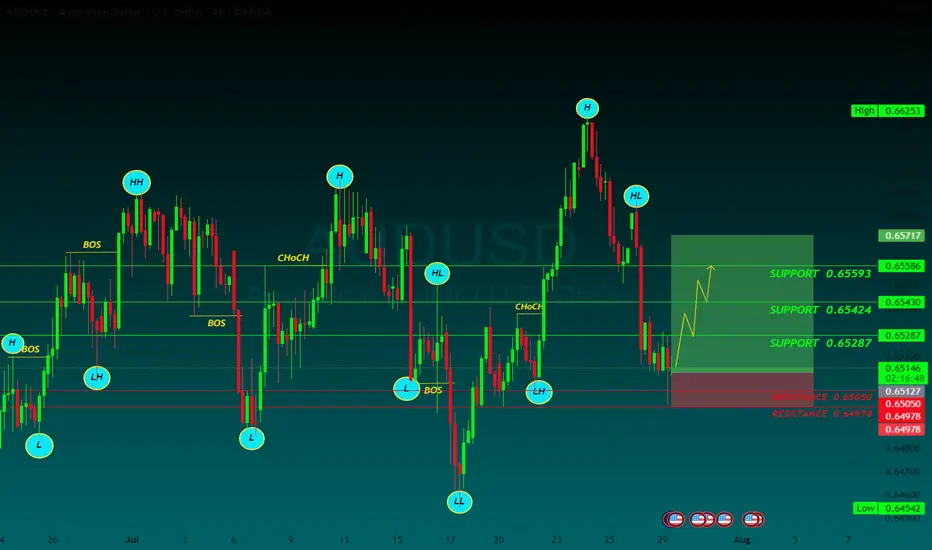
AUDUSD longs!!!Hello everyone
My bias towards AUDUSD is looking bullish and these are my reasons on why.
1. Price started to consolidate between 14/05/25 to 23/06/25 which caused price to take out EQL'S and create a CHOCH to the upside.
2. Price has than created many more consolidation patterns followed by EQL's raids as well.
3. I am hoping price will return back to my 4hr demand zone to go long again.
Looking for either market entry or buy limit not sure yet will find out as time goes by.
AUDUSD Will Go Lower! Sell!
Please, check our technical outlook for AUDUSD.
Time Frame: 9h
Current Trend: Bearish
Sentiment: Overbought (based on 7-period RSI)
Forecast: Bearish
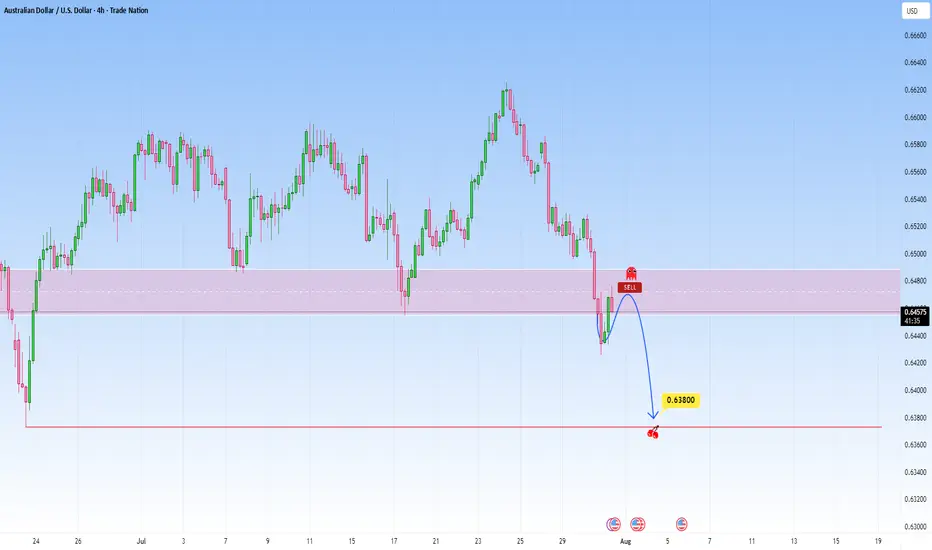
The market is approaching a significant resistance area 0.645.
Due to the fact that we see a positive bearish reaction from the underlined area, I strongly believe that sellers will manage to push the price all the way down to 0.637 level.
P.S
Overbought describes a period of time where there has been a significant and consistent upward move in price over a period of time without much pullback.
Disclosure: I am part of Trade Nation's Influencer program and receive a monthly fee for using their TradingView charts in my analysis.
Like and subscribe and comment my ideas if you enjoy them!

AUDUSD looks promising for a continuationThis pair presents a potential trade opportunity in the form of a short continuation. The price did reach a significant Area of Interest (AoI) in form of an expanding 3-touch structure before turning around. Price did close outside the structure on the H4 with a candlestick reversal pattern and printed a bearish high-test candle on the daily timeframe. This clearly shows a shift in momentum and I am now waiting for a lower time frame (LTF) continuation pattern to confirm the direction and a valid candlestick pattern for entry.
📈 Simplified Trading Rules:
> Follow a Valid Sequence
> Wait for Continuation
> Confirm Entry (valid candlestick pattern)
> Know When to Exit (SL placement)
Remember, technical analysis is subjective; develop your own approach. I use this format primarily to hold myself accountable and to share my personal market views.
⚠ Ensure you have your own risk management in place and always stick to your trading plan.
AUD/USD – Potential Bounce Buy SetupOANDA:AUDUSD
Timeframe: 30m
Type: Counter-trend / Bounce from Support
Risk Level: Medium to High
Possible Reward: 4+
🔹 Setup:
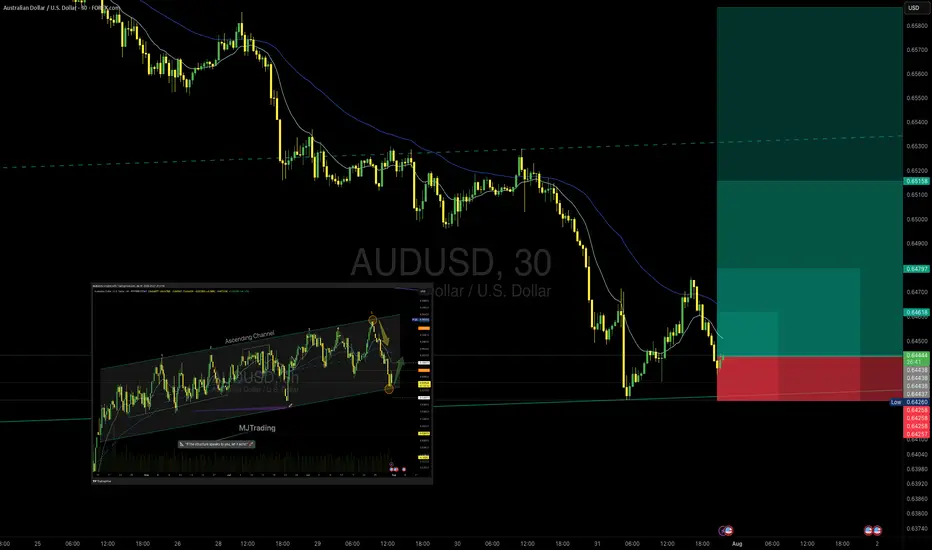
Price is testing the lower boundary of the recent support zone (0.6432 – 0.6420), aligning with the previous channel structure visible on the 8h chart. The descending move has shown initial signs of exhaustion, suggesting a potential bounce.
📈 Entry:
Current price zone 0.6432 – 0.6445
🎯 Targets (TP):
TP1: 0.64624
TP2: 0.64797
TP4: 0.65158
⛔ Stop Loss (SL):
0.64250 (below recent swing low and liquidity pool)
8H chart Overview:
Previous Position from top of Channel:
#AUDUSD #Forex #SmartMoney #PriceAction #MJTrading #ChartDesigner
Psychology Always Matters:
AUDUSD TRADE SETUPWait for retest the entry level and Bullish momentum candle then take a trade for Buy otherwise skip this setup
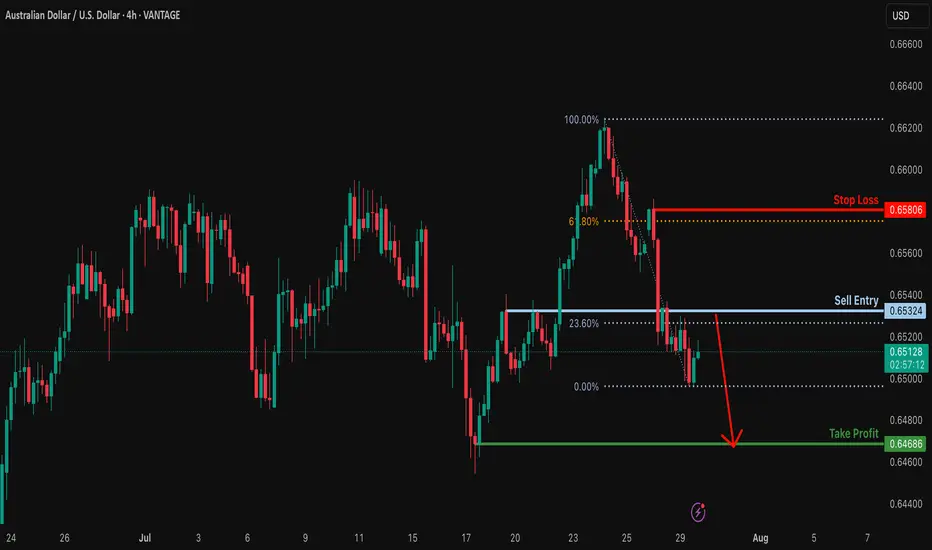
Potential bearish drop?The Aussie (AUD/USD) is rising toward the resistance level, which is a pullback resistance that is slightly above the 23.6% Fibonacci retracement and could reverse from this level to our take profit.
Entry: 0.6532
Why we like it:
There is a pullback resistance that is slightly above the 23.6% Fibonacci retracement.
Stop loss: 0.6580
Why we like it:
There is a pullback resistance that is slightly above the 61.8% Fibonacci retracement.
Take profit: 0.6467
Why we like it:
There is a swing low support.
Enjoying your TradingView experience? Review us!
TradingView (tradingview.sweetlogin.com)
Please be advised that the information presented on TradingView is provided to Vantage (‘Vantage Global Limited’, ‘we’) by a third-party provider (‘Everest Fortune Group’). Please be reminded that you are solely responsible for the trading decisions on your account. There is a very high degree of risk involved in trading. Any information and/or content is intended entirely for research, educational and informational purposes only and does not constitute investment or consultation advice or investment strategy. The information is not tailored to the investment needs of any specific person and therefore does not involve a consideration of any of the investment objectives, financial situation or needs of any viewer that may receive it. Kindly also note that past performance is not a reliable indicator of future results. Actual results may differ materially from those anticipated in forward-looking or past performance statements. We assume no liability as to the accuracy or completeness of any of the information and/or content provided herein and the Company cannot be held responsible for any omission, mistake nor for any loss or damage including without limitation to any loss of profit which may arise from reliance on any information supplied by Everest Fortune Group.
Australian dollar down, eyes US GDP, Australian CPIThe Australian dollar is down for a third straight trading day. In the North American session, the US dollar has posted gains against most of the major currencies, including the Aussie. The greenback received a boost after the US and the EU reached a framework trade agreement after protracted negotiations.
The data calendar is bare on Monday, with no events out of the US or Australia. Things get very busy on Wednesday, with Australian inflation, US GDP and the Federal Reserve rate decision.
Even with no US releases, the US dollar has posted gains against most of the major currencies, including the Aussie. The greenback received a boost after the US and the EU reached a framework trade agreement after protracted negotiations.
President Trump had threatened to impose 30% tariffs on European goods if a deal was not reached by Aug. 1. With the deal, a nasty trade war between the world's two largest economies has been avoided and the US will tariff most EU products at 15%.
The deal with the EU comes on the heels of a similar agreement with Japan, bringing a sigh of relief from the financial markets that have been worried about the economic fallout from Trump's tariff policy. The agreements remove a great deal of uncertainty and investors are hopeful that the US and Chinese negotiators will wrap up their talks with an agreement in hand.
The Federal Reserve meets on Wednesday and is virtually certain to maintain interest rates for a fifth straight meeting. It will be interesting to see if President Trump, who has been sharply critical of Fed policy, reacts to the decision. The money markets are expecting at least one cut before the end of the year, with the money markets pricing in a 61% likelihood a cut in September, according to FedWatch's CME.

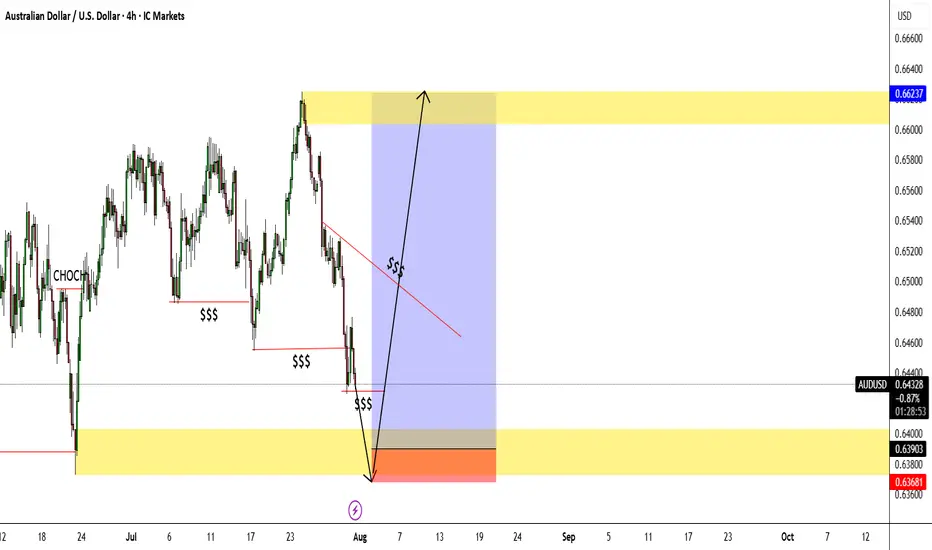
AUDUSD Engineered to Drop?🧠MJTrading:
📸 Viewing Tip:
🛠️ Some layout elements may shift depending on your screen size.
🔗 View the fixed high-resolution chart here:
🔻 OANDA:AUDUSD – Tagged the Top | Smart Money Eyes Lower Levels??
📍 Perfect Respect of Channel Structure
AUDUSD has just kissed the upper boundary of a long-standing ascending channel, showing sharp rejection — a sign that premium pricing might now shift toward discount levels.
📈 The aggressive push into the highs likely aimed to clear buy stops — fulfilling smart money objectives before a potential reversal.
📉 And here’s the subtle clue:
Just below the last bullish candle lies a thin slide — a structural weakness.
If price breaks and closes below that full body bearish candle (Below 0.66000), the market could slip fast, unleashing a momentum-driven drop into the first liquidity zone (0.6520s).
🧠 For smart money lovers, this is the classic:
Sweep → Trap → Slide
📏 And for fans of parallelism, the chart’s geometry offers a rare beauty — lines in harmony, structure in rhythm, and opportunity in alignment.
🔍 What to Watch For:
Break below 0.66000 (last candle body) = entry signal
0.6520–0.6540: first liquidity zone
0.6400–0.6300: deeper cleanout, if bearish pressure sustains
Inset: DXY bouncing from long-term demand supports bearish thesis
Manage your risk wisely...
For Lower time frame traders:
Psychology Always Matters:
(Click on the pictures for caption and concepts)
#AUDUSD #SmartMoney #LiquiditySweep #ChannelTrading #ChartDesigner #MJTrading #PriceAction #Forex

AUDUSD My Opinion! BUY!
My dear subscribers,
AUDUSD looks like it will make a good move, and here are the details:
The market is trading on 0.6455 pivot level.
Bias - Bullish
Technical Indicators: Both Super Trend & Pivot HL indicate a highly probable Bullish continuation.
Target - 0.6512
About Used Indicators:
The average true range (ATR) plays an important role in 'Supertrend' as the indicator uses ATR to calculate its value. The ATR indicator signals the degree of price volatility.
Disclosure: I am part of Trade Nation's Influencer program and receive a monthly fee for using their TradingView charts in my analysis.
———————————
WISH YOU ALL LUCK
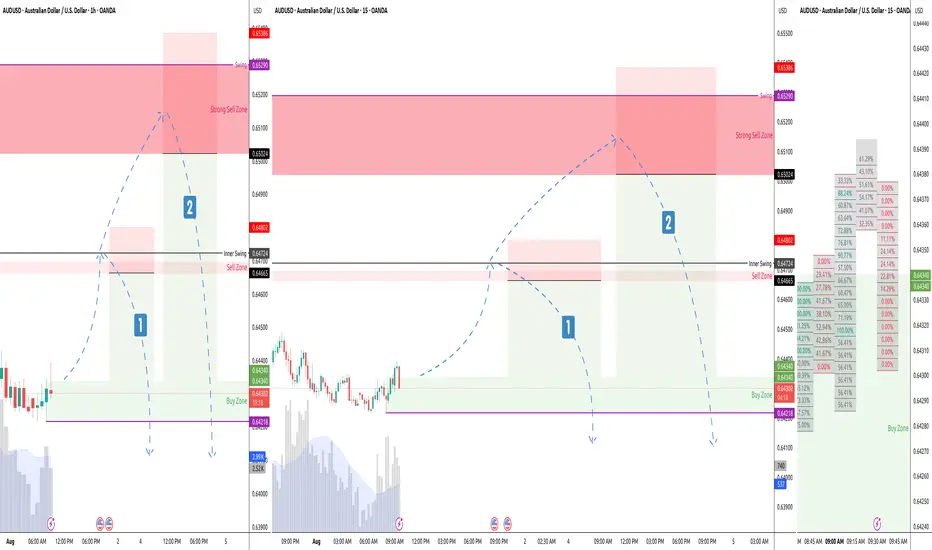
UADUSD 60/15 Pullback ShortOverall down trend. Saw previous session closing away from P profile, Looking for a retest on current session POC, and continue for bearish momentum.
Two possible pullbacks on sell zones above. React as accordingly.
Potential bullish reversal?The Aussie (AUD/USD) has bounced off the pivot, which is a swing low support, and could rise to the 1st resistance, which acts as a pullback resistance.
Pivot: 0.6502
1st Support: 0.6468
1st Resistance: 0.6558
Risk Warning:
Trading Forex and CFDs carries a high level of risk to your capital and you should only trade with money you can afford to lose. Trading Forex and CFDs may not be suitable for all investors, so please ensure that you fully understand the risks involved and seek independent advice if necessary.
Disclaimer:
The above opinions given constitute general market commentary, and do not constitute the opinion or advice of IC Markets or any form of personal or investment advice.
Any opinions, news, research, analyses, prices, other information, or links to third-party sites contained on this website are provided on an "as-is" basis, are intended only to be informative, is not an advice nor a recommendation, nor research, or a record of our trading prices, or an offer of, or solicitation for a transaction in any financial instrument and thus should not be treated as such. The information provided does not involve any specific investment objectives, financial situation and needs of any specific person who may receive it. Please be aware, that past performance is not a reliable indicator of future performance and/or results. Past Performance or Forward-looking scenarios based upon the reasonable beliefs of the third-party provider are not a guarantee of future performance. Actual results may differ materially from those anticipated in forward-looking or past performance statements. IC Markets makes no representation or warranty and assumes no liability as to the accuracy or completeness of the information provided, nor any loss arising from any investment based on a recommendation, forecast or any information supplied by any third-party.

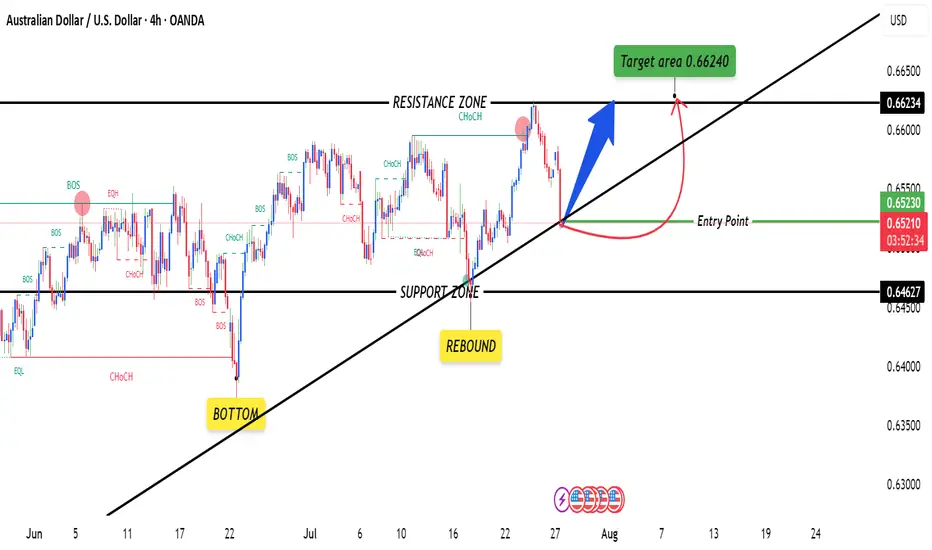
AUDUSD 4HOUR TIME FRAME ANALYSISOn the 4-hour chart, AUD USD has recently shifted into a shallow up-trend after carving out a higher low around 0.6480. From that support zone, price has rallied through a short-term descending channel, breaking its upper trendline just above 0.6500 and holding that breakout on the last two candles. The entry at 0.65231 sits just above a cluster of prior resistance–turned–support (0.6500–0.6520), giving the trade a solid foothold.
Momentum indicators confirm the bullish tilt: the 14-period RSI is riding around 60–65, neither overbought nor fatigued, suggesting room to run toward your target. Likewise, price is comfortably above both its 50-period and 200-period EMAs, with the shorter EMA crossing above the longer one roughly 12 bars ago, signalling that buyers are in control.