Signal-to-Noise Ratio: The Most Misunderstood Truth in Trading█ Signal-to-Noise Ratio: The Most Misunderstood Truth in Quant Trading
Most traders obsess over indicators, signals, models, and strategies.
But few ask the one question that defines whether any of it actually works:
❝ How strong is the signal — compared to the noise? ❞
Welcome to the concept of Signal-to-Noise Ratio (SNR) — the invisible force behind why some strategies succeed and most fail.
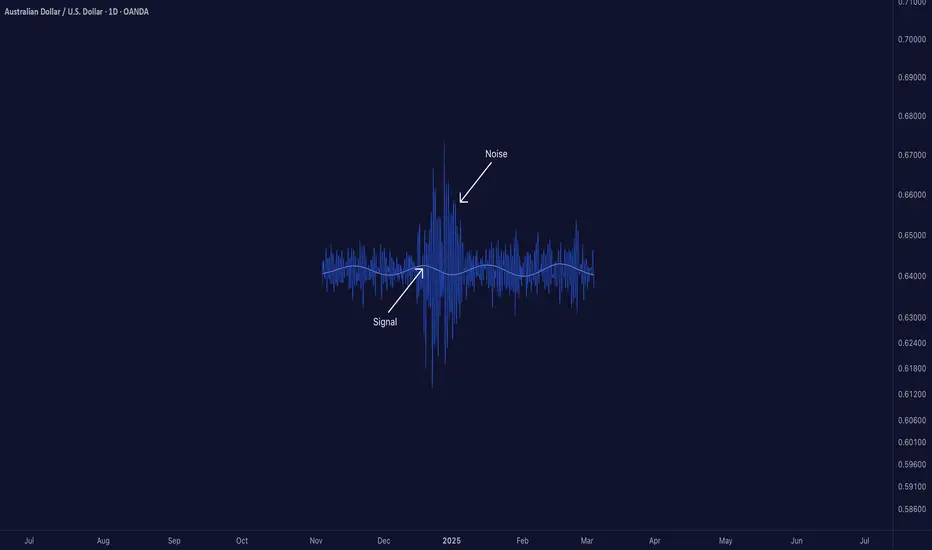
█ What Is Signal-to-Noise Ratio (SNR)?
⚪ In simple terms:
Signal = the real, meaningful, repeatable part of a price move
Noise = random fluctuations, market chaos, irrelevant variation
SNR = Signal Strength / Noise Level
If your signal is weak and noise is high, your edge gets buried.
If your signal is strong and noise is low, you can extract alpha with confidence.
In trading, SNR is like trying to hear a whisper in a hurricane. The whisper is your alpha. The hurricane is the market.
█ Why SNR Matters (More Than Sharpe, More Than Accuracy)
Most strategies die not because they’re logically flawed — but because they’re trying to extract signal in a low SNR environment.
Financial markets are dominated by noise.
The real edge (if it exists) is usually tiny and fleeting.
Even strong-looking backtests can be false positives created by fitting noise.
Every quant failure story you’ve ever heard — overfitting, false discoveries, bad AI models — starts with misunderstanding the signal-to-noise ratio.
█ SNR in the Age of AI
Machine learning struggles in markets because:
Most market data has very low SNR
The signal changes over time (nonstationarity)
AI is powerful enough to learn anything — including pure noise
This means unless you’re careful, your AI will confidently “discover” patterns that have no predictive value whatsoever.
Smart quants don’t just train models. They fight for SNR — every input, feature, and label is scrutinized through this lens.
█ How to Measure It (Sharpe, t-stat, IC)
You can estimate a strategy’s SNR with:
Sharpe Ratio: Signal = mean return, Noise = volatility
t-Statistic: Measures how confident you are that signal ≠ 0
Information Coefficient (IC): Correlation between forecast and realized return
👉 A high Sharpe or t-stat suggests strong signal vs noise
👉 A low value means your “edge” might just be noise in disguise
█ Real-World SNR: Why It's So Low in Markets
The average daily return of SPX is ~0.03%
The daily standard deviation is ~1%
That's signal-to-noise of 1:30 — and that's for the entire market, not a niche alpha.
Now imagine what it looks like for your scalping strategy, your RSI tweak, or your AI momentum model.
This is why most trading signals don’t survive live markets — the noise is just too loud.
█ How to Build Strategies With Higher SNR
To survive as a trader, you must engineer around low SNR. Here's how:
1. Combine signals
One weak signal = low SNR
100 uncorrelated weak signals = high aggregate SNR
2. Filter noise before acting
Use volatility filters, regime detection, thresholds
Trade only when signal strength exceeds noise level
3. Test over longer horizons
Short-term = more noise
Long-term = signal has more time to emerge
4. Avoid excessive optimization
Every parameter you tweak risks modeling noise
Simpler systems = less overfit = better SNR integrity
5. Validate rigorously
Walk-forward, OOS testing, bootstrapping — treat your model like it’s guilty until proven innocent
█ Low SNR = High Uncertainty
In low-SNR environments:
Alpha takes years to confirm (t-stat grows slowly)
Backtests are unreliable (lucky noise often looks like skill)
Drawdowns happen randomly (even good strategies get wrecked short-term)
This is why experience, skepticism, and humility matter more than flashy charts.
If your signal isn’t strong enough to consistently rise above noise, it doesn’t matter how elegant it looks.
█ Overfitting Is What Happens When You Fit the Noise
If you’ve read Why Your Backtest Lies , you already know the dangers of overfitting — when a strategy is tuned too perfectly to historical data and fails the moment it meets reality.
⚪ Here’s the deeper truth:
Overfitting is the natural consequence of working in a low signal-to-noise environment.
When markets are 95% noise and you optimize until everything looks perfect?
You're not discovering a signal. You're just fitting past randomness — noise that will never repeat the same way again.
❝ The more you optimize in a low-SNR environment, the more confident you become in something that isn’t real. ❞
This is why so many “flawless” backtests collapse in live trading. Because they never captured signal — they captured noise.
█ Final Word
Quant trading isn’t about who can code the most indicators or build the deepest neural nets.
It’s about who truly understands this:
❝ In a world full of noise, only the most disciplined signal survives. ❞
Before you build your next model, launch your next strategy, or chase your next setup…
Ask this:
❝ Am I trading signal — or am I trading noise? ❞
If you don’t know the answer, you're probably doing the latter.
-----------------
Disclaimer
The content provided in my scripts, indicators, ideas, algorithms, and systems is for educational and informational purposes only. It does not constitute financial advice, investment recommendations, or a solicitation to buy or sell any financial instruments. I will not accept liability for any loss or damage, including without limitation any loss of profit, which may arise directly or indirectly from the use of or reliance on such information.
All investments involve risk, and the past performance of a security, industry, sector, market, financial product, trading strategy, backtest, or individual's trading does not guarantee future results or returns. Investors are fully responsible for any investment decisions they make. Such decisions should be based solely on an evaluation of their financial circumstances, investment objectives, risk tolerance, and liquidity needs.
AUDUSD trade ideas
#AUDUSD: +1100 Pips Possible Swing Bullish Move! AUDUSD a strong sign of bullish behaviour has appeared alongside bullish momentum. As we have NFP tomorrow, we expect market to remain volatile; what we think now is to have market settled down before we can have any confirmation. We recommend to remain extra cautious tomorrow, once market get settled we can then enter with accurate risk management.
Like, comment and Share for more!
Team Setupsfx_
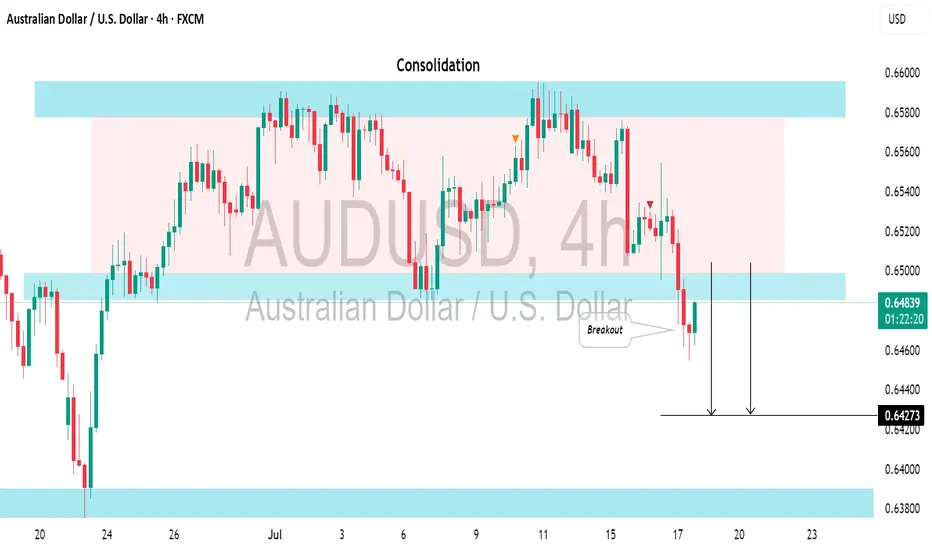
AUDUSD: Strong Bearish Signal?!The AUDUSD appears to be bearish following a few weeks of consolidation.
And a bearish breakout from the support of a sideways range serves as a strong confirmation signal.
We can anticipate a decline to at least the 0.6427 level.
AUDUSD Potential UpsidesHey Traders, in today's trading session we are monitoring AUDUSD for a buying opportunity around 0.65550 zone, AUDUSD is trading in an uptrend and currently is in a correction phase in which it is approaching the trend at 0.65550 support and resistance area.
Trade safe, Joe.
AUDUSD Potential UpsidesHey Traders, in today's trading session we are monitoring AUDUSD for a buying opportunity around 0.64500 zone, AUDUSD is trading in an uptrend and currently is in a correction phase in which it is approaching the trend at 0.64500 support and resistance area.
Trade safe, Joe.
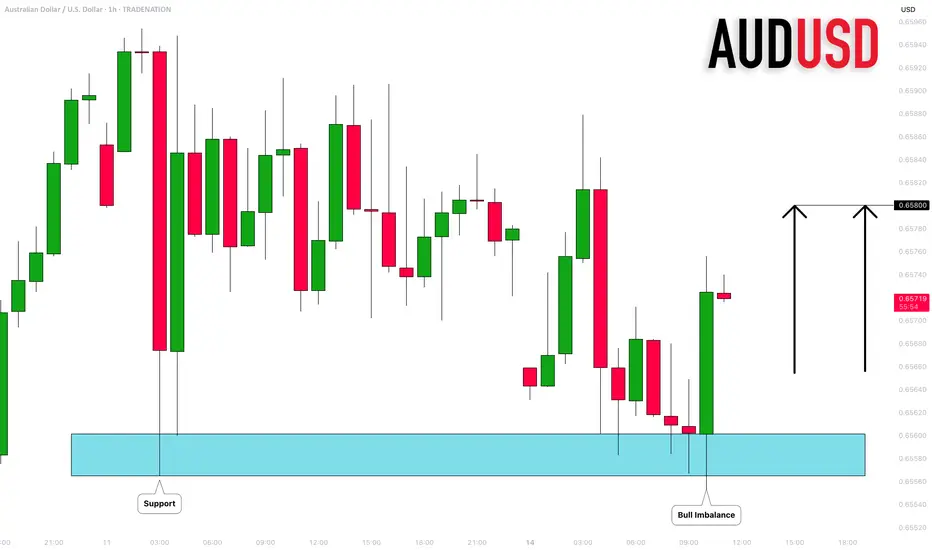
AUDUSD: Pullback From Support 🇦🇺🇺🇸
There is a high chance to see a pullback from the underlined
key horizontal support on AUDUSD.
As a confirmation, I see a bullish imbalance candle on an hourly time frame.
Goal - 0.658
❤️Please, support my work with like, thank you!❤️
I am part of Trade Nation's Influencer program and receive a monthly fee for using their TradingView charts in my analysis.
AUDUSD TRADE IDEA AUDUSD has pulled back to our Fibonacci level for a trade to the upside. Let's see how the market does it's thing
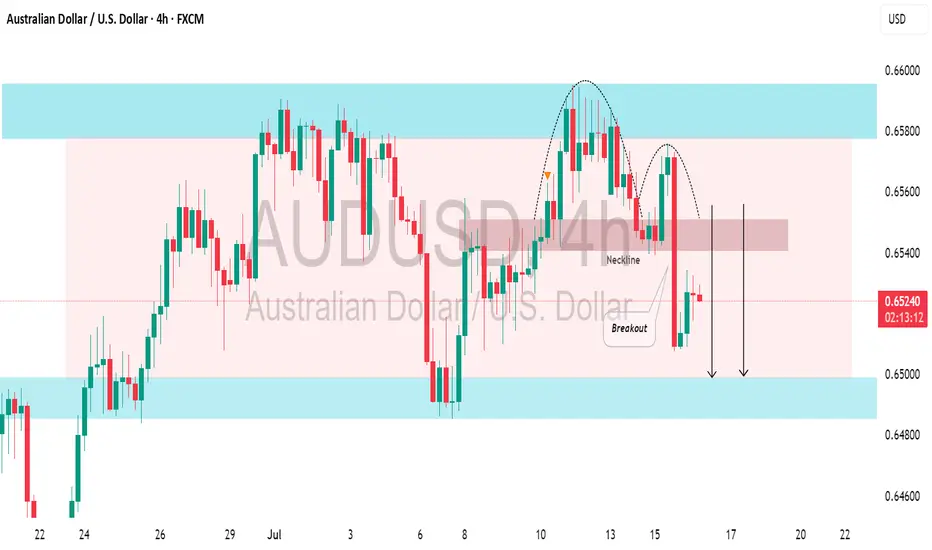
AUDUSD: Consolidation ContinuesThe AUDUSD is currently consolidating within a broad horizontal channel.
A notable bearish response to resistance has occurred, with the formation of a cup and handle pattern leading to a decline.
There is a strong likelihood that the price will soon hit the 0.6500 level.
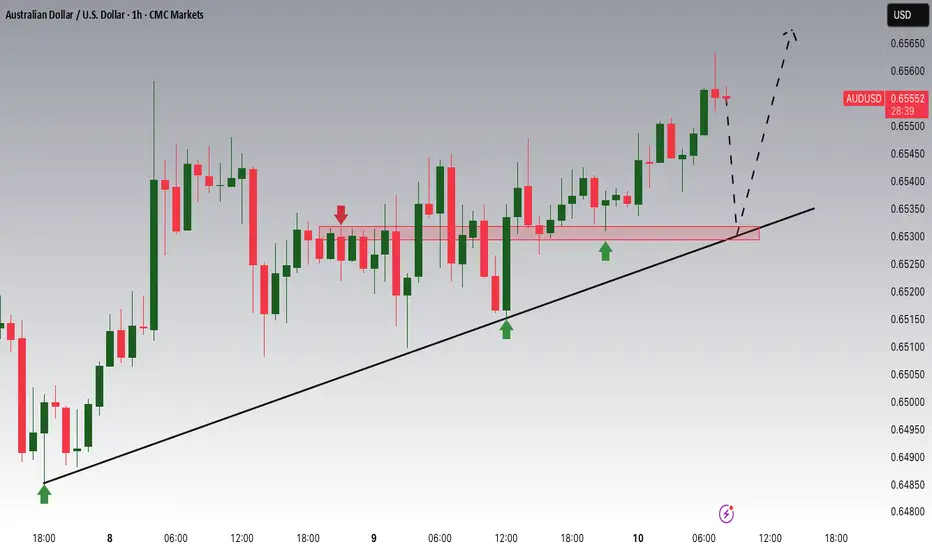
AUDUSD Potential UpsidesHey Traders, in today's trading session we are monitoring AUDUSD for a buying opportunity around 0.65300 zone, AUDUSD is trading in an uptrend and currently is in a correction phase in which it is approaching the trend at 0.65300 support and resistance area.
Trade safe, Joe.
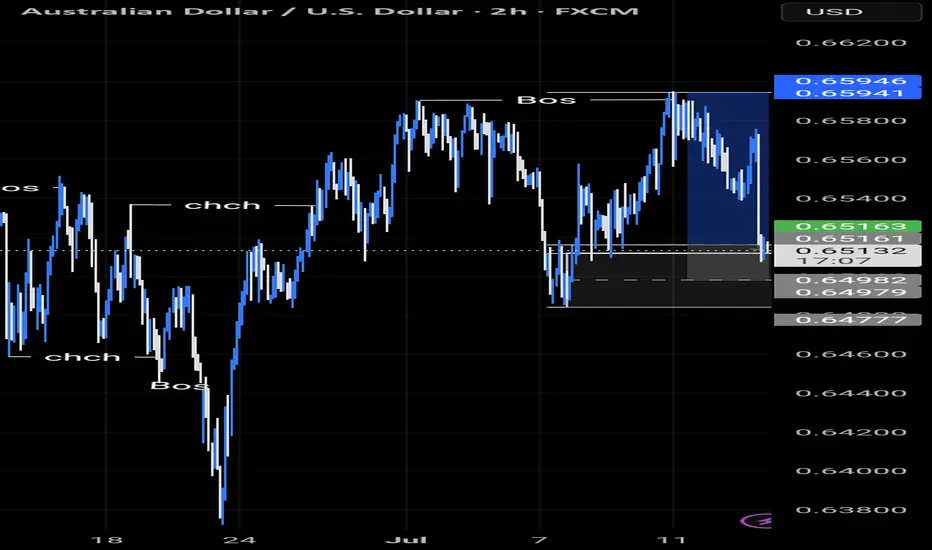
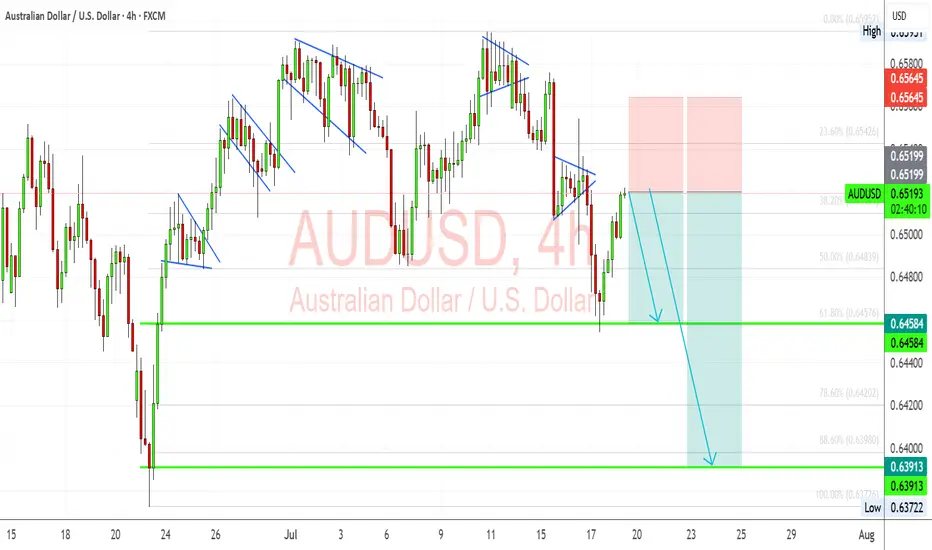
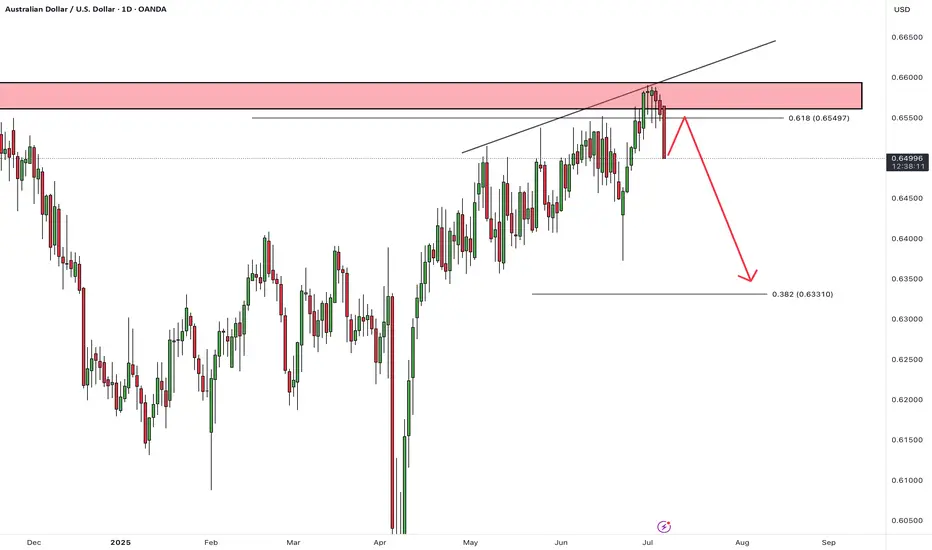
AUDUSD: Bearish Flag Retest Within Macro HeadwindsAUDUSD is developing a clean bearish technical setup just as macro fundamentals increasingly weigh on the Australian dollar. The pair recently completed a rising wedge breakout and is now retesting broken structure within a larger downtrend. With risk sentiment shaky due to U.S. tariff threats and dovish repricing of the RBA’s outlook, Aussie bulls may struggle to sustain momentum. A confirmed breakdown below 0.6458 could open the door toward June’s swing low near 0.6390.
🧠 Technical Breakdown:
✅ Bearish Flag Structure:
The chart shows a sequence of bearish flags and rising wedges, all of which have historically broken lower. The latest breakout to the downside was sharp, and the current rally appears corrective.
✅ Fib Levels & Confluence:
Price is hovering near the 38.2% retracement (0.6510) from the last leg down. The invalidation zone around 0.6565 aligns with a supply zone, making it an ideal SL area.
✅ Target Zones:
First support: 0.6458
Measured move: 0.6390 - 0.6370
These coincide with Fib 61.8% & 100%, adding technical confluence.
📉 Fundamental Drivers:
Dovish RBA Signals: Labour data missed expectations, and June inflation slowed (4.8% vs. 4.9% expected), softening the RBA’s hawkish stance.
Stronger USD Outlook: Powell’s reappointment risk and rate-cut delay pricing have supported the dollar. U.S. data (Retail Sales, CPI) still signal sticky inflation and strong labor.
Tariff Risk from Trump: With the U.S. floating global 10% tariffs, risk assets like AUD (a high-beta currency) face downside pressure.
⚠️ Risks to Bearish Bias:
Stronger-than-expected China stimulus could support AUD as a proxy.
A dovish Fed pivot or soft U.S. data might undercut USD strength.
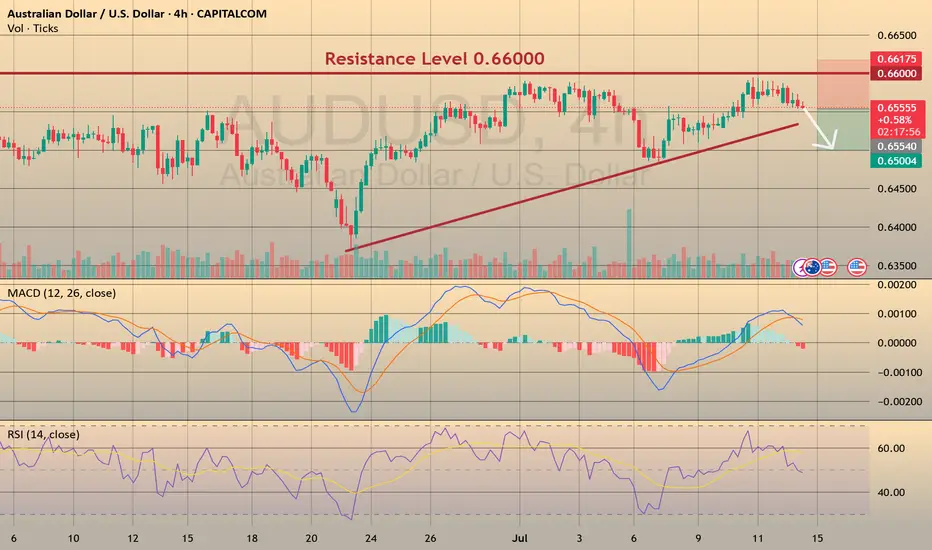
AUDUSD: Short Setup Ahead of Key Data OANDA:AUDUSD
AUDUSD is hovering near a rising trendline, with price action compressing and signaling a potential downside break in the coming sessions.
Just above, the 0.65900 resistance zone has capped recent rallies, and the pair’s failure to clear this level strengthens the case for a reversal.
Later today, we will see Westpac Consumer Confidence data for Australia, which could act as a catalyst for a sharp move. A weaker-than-expected print would likely pressure the Aussie further.
📋 Entry Checklist:
✅ Testing rising trendline, signaling potential breakdown
✅ Strong resistance at 0.65900 holding rallies
✅ Key consumer sentiment data could trigger volatility
📈 Trade Plan:
🔻 Sell Entry: 0.65600
❌ Stop Loss: 0.66200
✅ Take Profit: 0.65000
(Tap 👉 Trade Now 👈 on mobile to copy SL & TP easily)
📰 Fundamental Snapshot:
The Reserve Bank of Australia (RBA) surprised markets by holding rates steady at 3.85%, diverging from expectations of a potential cut. The RBA remains cautious amid persistent inflation risks driven by high labor costs and weak productivity, suggesting rates may stay restrictive longer.
Governor Michele Bullock highlighted that inflation could remain above forecasts, while Deputy Governor Andrew Hauser emphasized monitoring global uncertainties, including U.S. tariff developments, reflecting the RBA’s sensitivity to external headwinds impacting growth and trade.
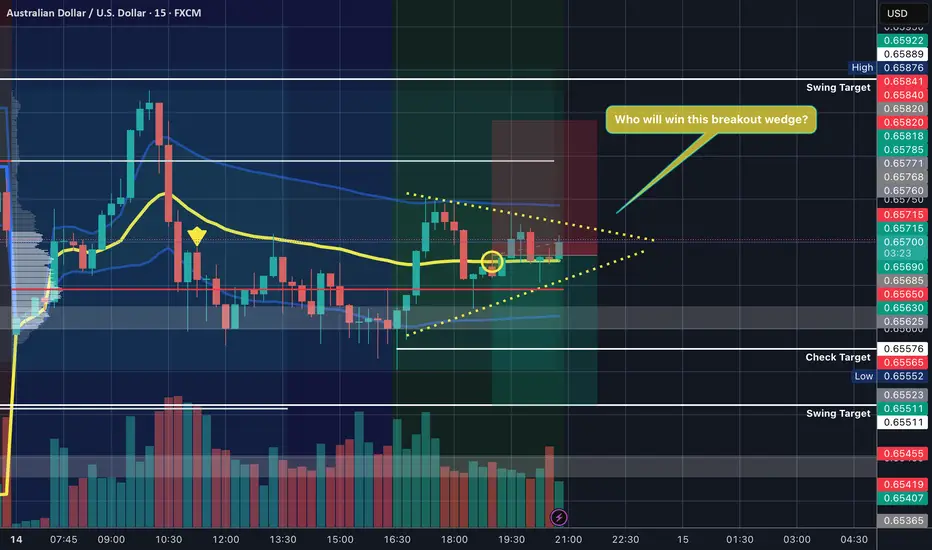
$AUDUSD - Who will win this breakout wedge? Who else is spotting this wedge in the OANDA:AUDUSD ?
As an orderflow trader, my bet is going Short $$$
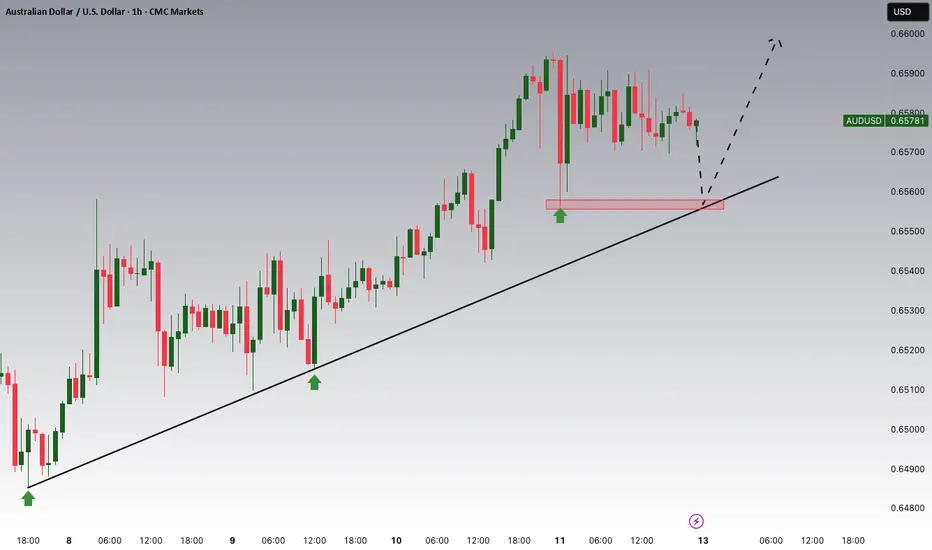
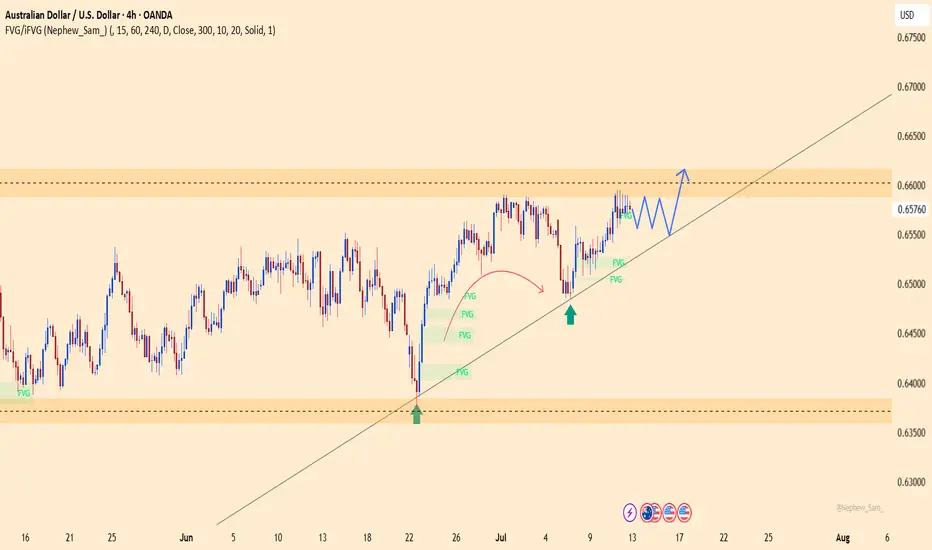
AUDUSD holds bullish structureAUDUSD is currently trading around 0.6576, maintaining a clear uptrend with higher lows and strong respect for the ascending trendline. A consolidation pattern is forming just below the key resistance zone at 0.6600–0.6617, suggesting a potential breakout if price stays above the support at 0.6546.
On the news front, the Australian dollar is supported by expectations that the RBA will keep interest rates high, while the USD is under slight pressure following weaker U.S. job data this week. Additionally, improving consumer data from China – Australia’s major trading partner – is further boosting AUD sentiment.
If the price breaks above 0.6617, AUDUSD could extend its rally into next week. Buyers are in control – have you planned your entry yet?
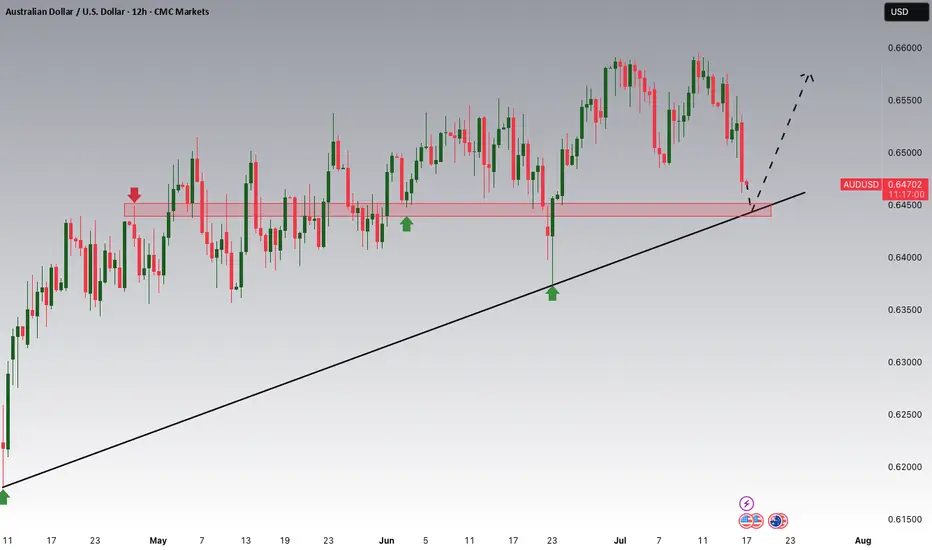
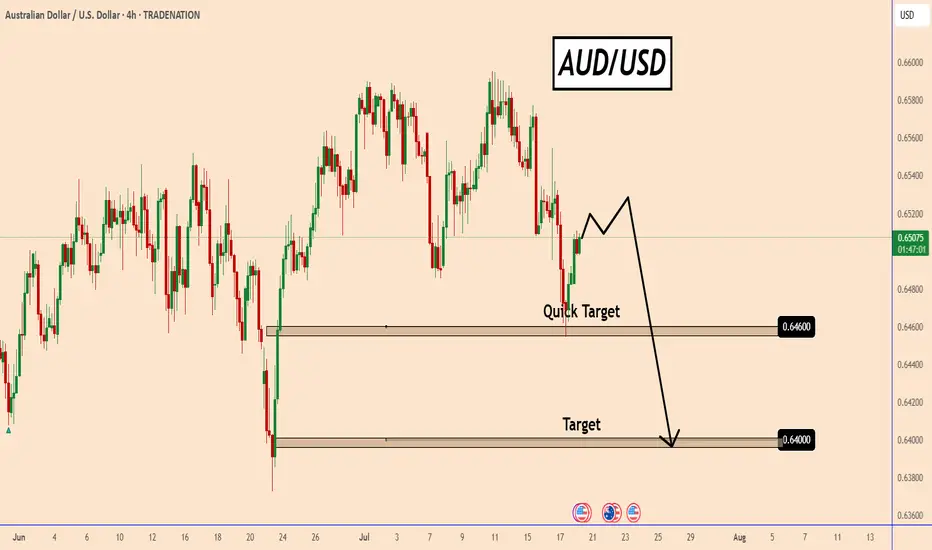
AUDUSD could fall again despite bullish momentumAUDUSD could fall again despite bullish momentum
AUDUSD found strong support near 0.6460.
Overnight the price rose despite the lack of any news on the economic calendar.
This could be related to the low volume of the current month and perhaps small currency injections or profit taking create such moves.
The price is not yet clear, but there is a high possibility of further decline in the coming days. It may show signs of reversal soon and could fall to 0.6460 and 0.6400.
You may find more details in the chart!
Thank you and Good Luck!
PS: Please support with a like or comment if you find this analysis useful for your trading day
Disclosure: I am part of Trade Nation's Influencer program and receive a monthly fee for using their TradingView charts in my analysis.
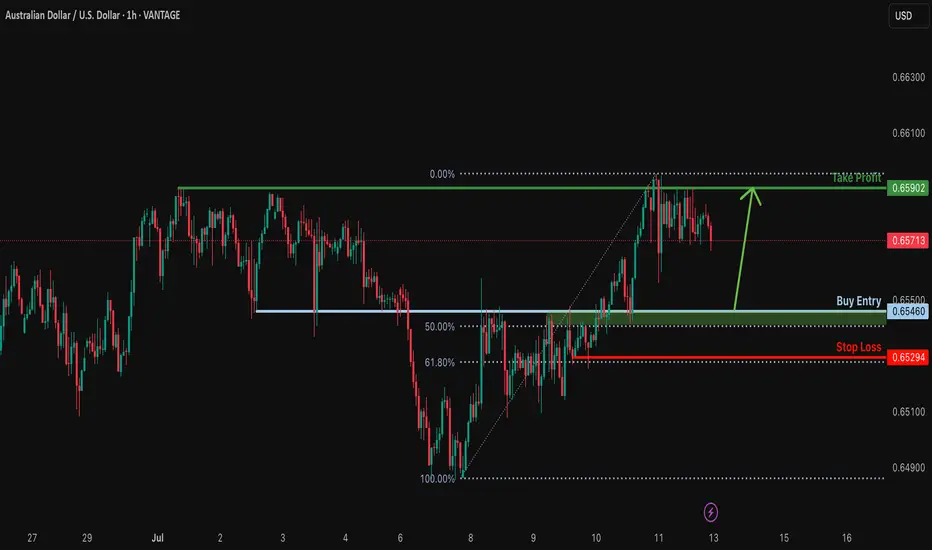
Bullish bounce off overlap support?AUD/USD is falling towards the support level which is an overlap support that is slightly above the 50% Fibonacci retracement and could bounce from this level too ur take profit.
Entry: 0.6546
Why we like it:
There is an overlap support that is slightly above the 50% Fibonacci retracement.
Stop loss: 0.6529
Why we like it:
There is a pullback support that aligns with the 61.8% Fibonacci retracement.
Take profit: 0.6590
Why we like it:
There is a pullback support.
Enjoying your TradingView experience? Review us!
Please be advised that the information presented on TradingView is provided to Vantage (‘Vantage Global Limited’, ‘we’) by a third-party provider (‘Everest Fortune Group’). Please be reminded that you are solely responsible for the trading decisions on your account. There is a very high degree of risk involved in trading. Any information and/or content is intended entirely for research, educational and informational purposes only and does not constitute investment or consultation advice or investment strategy. The information is not tailored to the investment needs of any specific person and therefore does not involve a consideration of any of the investment objectives, financial situation or needs of any viewer that may receive it. Kindly also note that past performance is not a reliable indicator of future results. Actual results may differ materially from those anticipated in forward-looking or past performance statements. We assume no liability as to the accuracy or completeness of any of the information and/or content provided herein and the Company cannot be held responsible for any omission, mistake nor for any loss or damage including without limitation to any loss of profit which may arise from reliance on any information supplied by Everest Fortune Group.
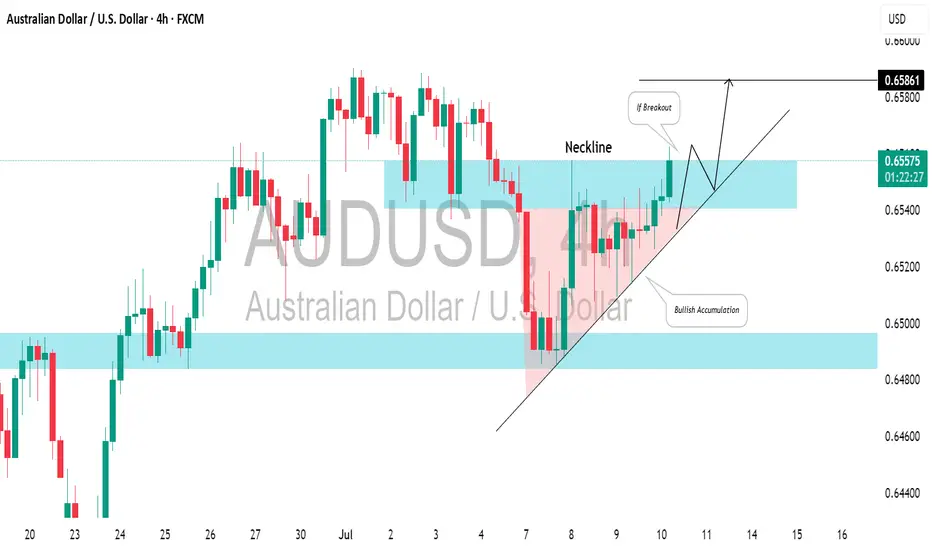
AUDUSD: Bullish Accumulation?!Quick update for ⚠️AUDUSD:
The price formed a classic bullish pattern on a 4-hour chart known as the ascending triangle, indicating bullish accumulation and a likely upward movement.
To confirm this, we will adhere to the previously discussed plan, waiting for a breakout above 0.6560 and a 4-hour candle close above that level, which could lead to a potential rise to 0.6586.
Conversely, a bearish breakout below the triangle's trend line would signal a strong downward movement.
AUDUSDHello Traders! 👋
What are your thoughts on AUDUSD?
The AUDUSD pair reached a resistance zone, which was accompanied by a negative divergence, signaling weakening bullish momentum. This led to a bearish reaction from that area.
We expect that, after some consolidation around this resistance, the pair will likely continue its decline at least toward the specified support level.
Don’t forget to like and share your thoughts in the comments! ❤️
AUD/USD: Bearish Pattern Hints at Downside MoveAUD/USD has struggled on pushes towards .6600 recently, including on Monday where a bearish reversal completed a three-candle evening star pattern—a notable topping pattern. While price signals ahead of major U.S. economic data during the Northern Hemisphere summer should be treated with extra caution, in an environment where trade uncertainty and geopolitical tensions are unlikely to be resolved in the near term, a short setup may be in order.
Should AUD/USD push back towards minor resistance at .6558 without breaking above, shorts could be established beneath the level with a stop above for protection. .6490 screens as a logical initial target, aligning with the 50-day moving average with the July 7 low located just below.
Some may look to enter around current levels, but given the caveats on the price signal, the preference is to let the setup come to you rather than forcing it.
Good luck!
DS

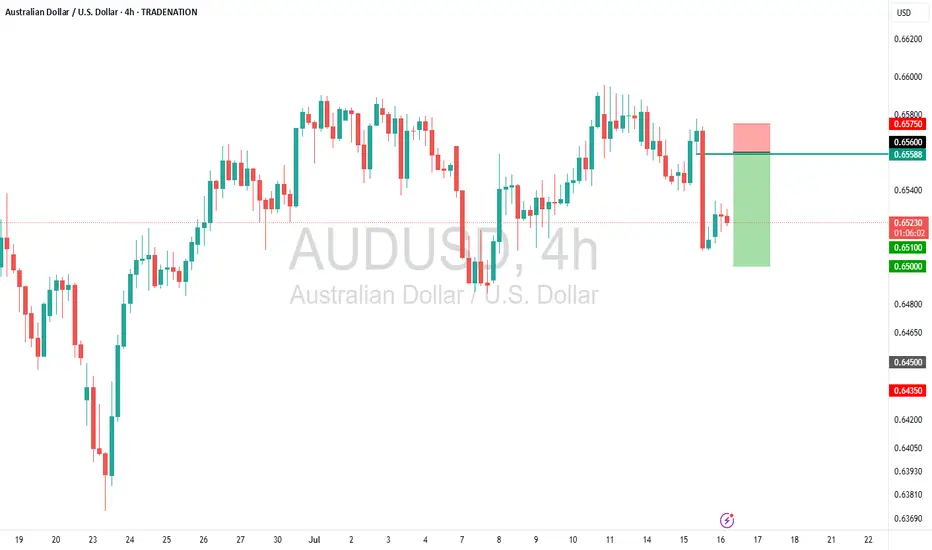
AUDUSD – Sell Into Rally as Top Formation DevelopsTrade Idea
Type: Sell Limit
Entry: 0.6560
Target: 0.6500
Stop Loss: 0.6575
Duration: Intraday
Expires: 17/07/2025 06:00
Technical Overview
Recent price action has been mixed and volatile, with signs that a top is forming.
The preferred strategy is to sell into rallies, capturing potential exhaustion near resistance.
Bespoke resistance at 0.6560 aligns perfectly with the entry, offering a high-probability area for reversal.
A move lower to 0.6500 would confirm bearish momentum and complete the expected corrective move.
Watch for upcoming key data events:
US PPI data (16/07 at 13:30 UTC), and
Australian Employment data (17/07 at 02:30 UTC), both of which could increase volatility and provide catalysts.
Key Technical Levels
Resistance: 0.6570 / 0.6590 / 0.6600
Support: 0.6520 / 0.6500 / 0.6480
Disclosure: I am part of Trade Nation's Influencer program and receive a monthly fee for using their TradingView charts in my analysis.
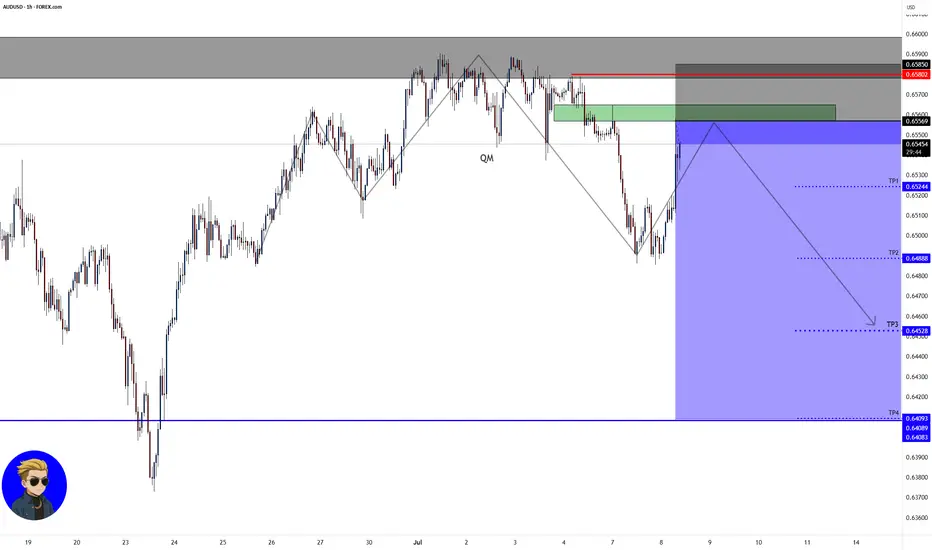
AUD/USD💰Symbol: { AUD/USD }
🟩Price: { 0.65569 }
🟥Stop: { 0.65850 }
1️⃣profit: { 0.65244 }
2️⃣profit: { 0.64888 }
3️⃣profit: { 0.64528 }
4️⃣profit: { 0.64093 }
📊Check your chart before entering.
🚨Check before use to make sure there is no important news.🚨
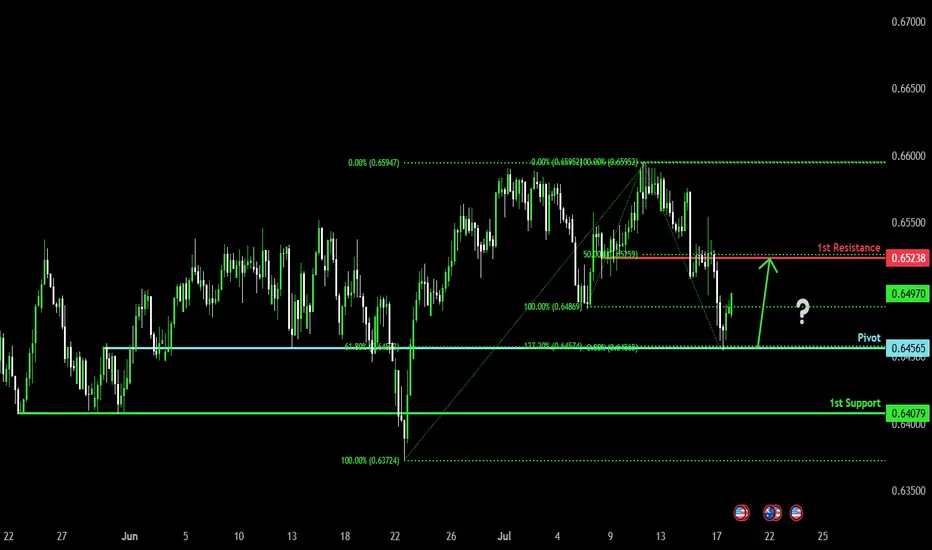
Bullish bounce?The Aussie (AUD/USD) has bounced off the pivot and could rise to the 1st resistance.
Pivot: 0.6456
1st Support: 0.6407
1st Resistance: 0.6523
Risk Warning:
Trading Forex and CFDs carries a high level of risk to your capital and you should only trade with money you can afford to lose. Trading Forex and CFDs may not be suitable for all investors, so please ensure that you fully understand the risks involved and seek independent advice if necessary.
Disclaimer:
The above opinions given constitute general market commentary, and do not constitute the opinion or advice of IC Markets or any form of personal or investment advice.
Any opinions, news, research, analyses, prices, other information, or links to third-party sites contained on this website are provided on an "as-is" basis, are intended only to be informative, is not an advice nor a recommendation, nor research, or a record of our trading prices, or an offer of, or solicitation for a transaction in any financial instrument and thus should not be treated as such. The information provided does not involve any specific investment objectives, financial situation and needs of any specific person who may receive it. Please be aware, that past performance is not a reliable indicator of future performance and/or results. Past Performance or Forward-looking scenarios based upon the reasonable beliefs of the third-party provider are not a guarantee of future performance. Actual results may differ materially from those anticipated in forward-looking or past performance statements. IC Markets makes no representation or warranty and assumes no liability as to the accuracy or completeness of the information provided, nor any loss arising from any investment based on a recommendation, forecast or any information supplied by any third-party.
AUDUSD: Bearish Continuation is Expected! Here is Why:
The price of AUDUSD will most likely collapse soon enough, due to the supply beginning to exceed demand which we can see by looking at the chart of the pair.
Disclosure: I am part of Trade Nation's Influencer program and receive a monthly fee for using their TradingView charts in my analysis.
❤️ Please, support our work with like & comment! ❤️
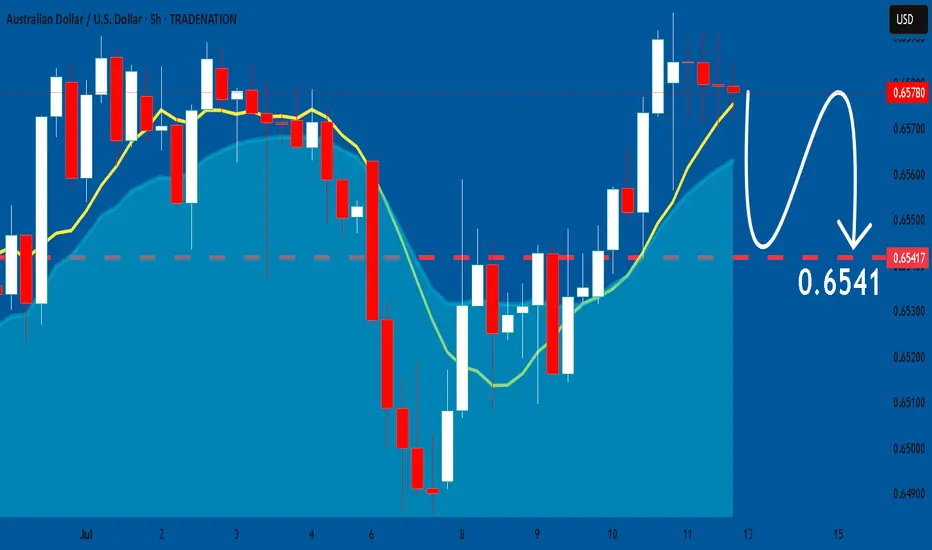
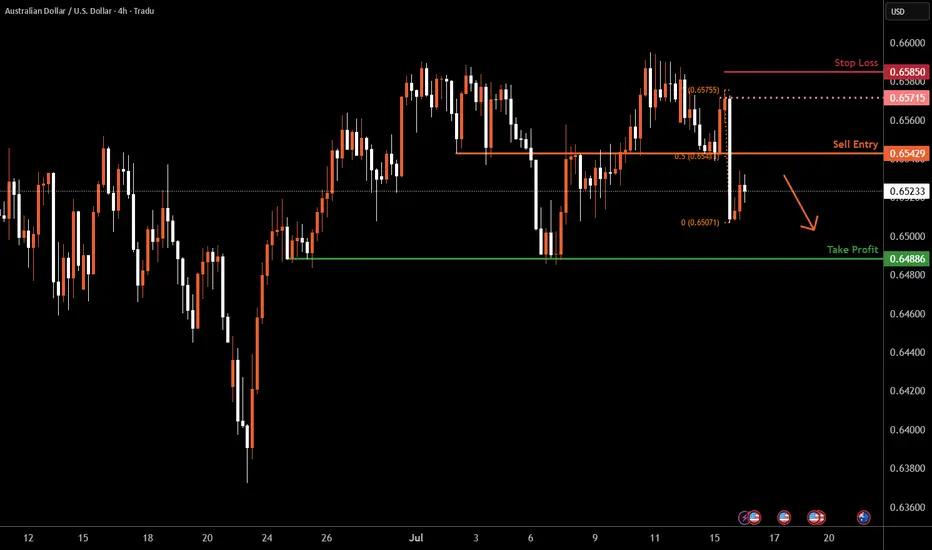
Aussie H4 | Overlap resistance at 50% Fibonacci retracementThe Aussie (AUD/USD) is rising towards an overlap resistance and could potentially reverse off this level to drop lower.
Sell entry is at 0.6542 which is an overlap resistance that aligns with the 50% Fibonacci retracement.
Stop loss is at 0.6585 which is a level that sits above a swing-high resistance.
Take profit is at 0.6488 which is a multi-swing-low support.
High Risk Investment Warning
Trading Forex/CFDs on margin carries a high level of risk and may not be suitable for all investors. Leverage can work against you.
Stratos Markets Limited (tradu.com ):
CFDs are complex instruments and come with a high risk of losing money rapidly due to leverage. 63% of retail investor accounts lose money when trading CFDs with this provider. You should consider whether you understand how CFDs work and whether you can afford to take the high risk of losing your money.
Stratos Europe Ltd (tradu.com ):
CFDs are complex instruments and come with a high risk of losing money rapidly due to leverage. 63% of retail investor accounts lose money when trading CFDs with this provider. You should consider whether you understand how CFDs work and whether you can afford to take the high risk of losing your money.
Stratos Global LLC (tradu.com ):
Losses can exceed deposits.
Please be advised that the information presented on TradingView is provided to Tradu (‘Company’, ‘we’) by a third-party provider (‘TFA Global Pte Ltd’). Please be reminded that you are solely responsible for the trading decisions on your account. There is a very high degree of risk involved in trading. Any information and/or content is intended entirely for research, educational and informational purposes only and does not constitute investment or consultation advice or investment strategy. The information is not tailored to the investment needs of any specific person and therefore does not involve a consideration of any of the investment objectives, financial situation or needs of any viewer that may receive it. Kindly also note that past performance is not a reliable indicator of future results. Actual results may differ materially from those anticipated in forward-looking or past performance statements. We assume no liability as to the accuracy or completeness of any of the information and/or content provided herein and the Company cannot be held responsible for any omission, mistake nor for any loss or damage including without limitation to any loss of profit which may arise from reliance on any information supplied by TFA Global Pte Ltd.
The speaker(s) is neither an employee, agent nor representative of Tradu and is therefore acting independently. The opinions given are their own, constitute general market commentary, and do not constitute the opinion or advice of Tradu or any form of personal or investment advice. Tradu neither endorses nor guarantees offerings of third-party speakers, nor is Tradu responsible for the content, veracity or opinions of third-party speakers, presenters or participants.