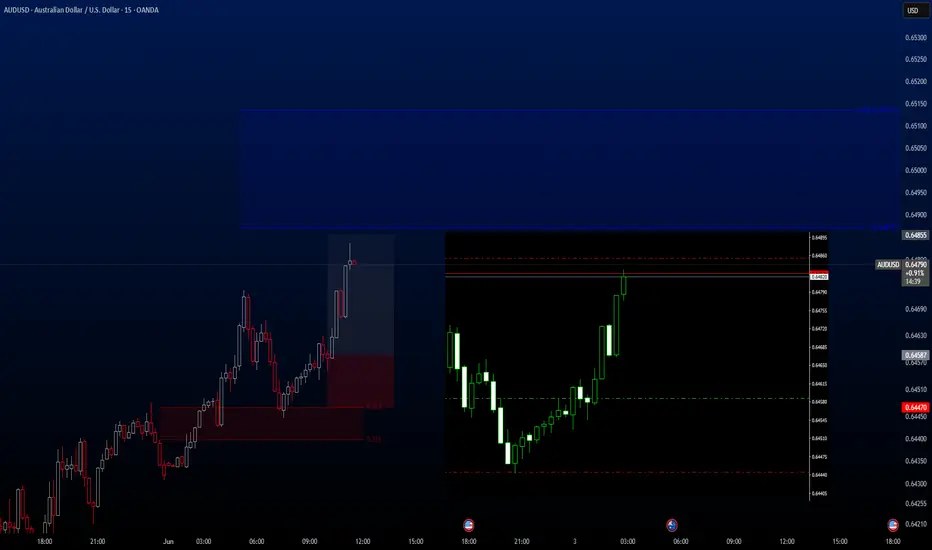
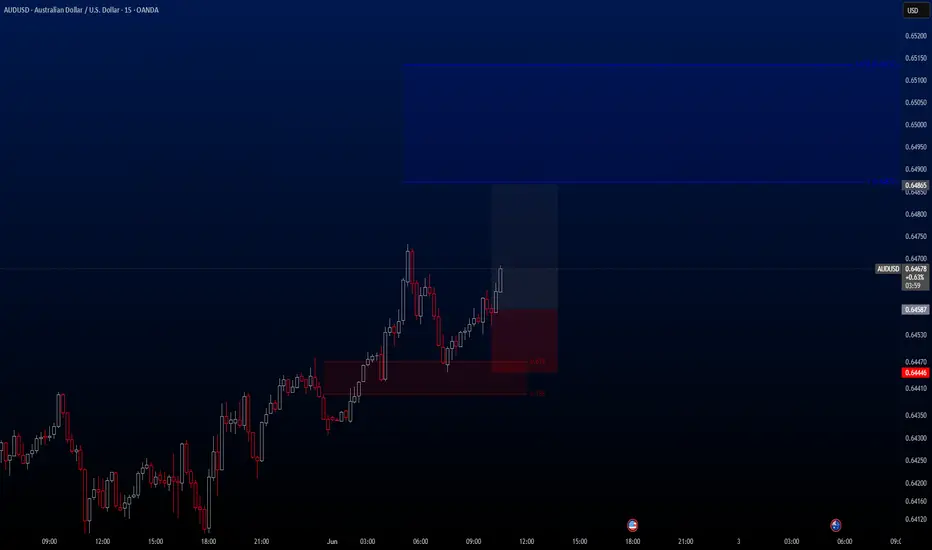
AUDUSD trade has hit Take ProfitThe AUDUSD trade I shared earlier has just hit TP at 0.6487. This will be my first and last trade for today. As I mentioned, today and this week are quite heavy in terms of news, so I’ll be trading less. Wishing everyone a profitable day — manage your risk wisely.
AUDUSD trade ideas
AUDUSD Hello traders. Wishing everyone a productive week ahead!
Today, the U.S. Manufacturing PMI (May) and the ISM Manufacturing PMI (May) reports will be released — both are high-impact events for the markets. This week, in particular, is expected to be news-heavy.
That said, it’s wise to remain cautious with trades. My plan is to open a few trades before the news and close them beforehand. One of these opportunities has emerged on the AUDUSD pair. I’ve already taken a Buy trade, and it's currently active.
This setup has two key Take Profit zones:
First TP: 0.6487
Second TP: 0.65137
I’ve personally targeted the first TP level, so I’ll be sharing the details of that trade. However, the same structure applies to the second target as well if you choose to aim higher.
🔍 Trade Details:
✔️ Timeframe: 15-Minute
✔️ Risk-to-Reward Ratio: 1:1 / 1:1.50 / 1:2
✔️ Trade Direction: Buy
✔️ Entry Price: 0.64587
✔️ Take Profit: 0.64865
✔️ Stop Loss: 0.64446
🔔 Disclaimer: This is not financial advice. I’m simply sharing a trade I’ve taken based on my personal trading system, strictly for educational and illustrative purposes.
📌 Interested in a systematic, data-driven trading approach?
💡 Follow the page and turn on notifications to stay updated on future trade setups and advanced market insights.
uptrendThe price is expected to stabilize above the green support area and then begin an upward trend to the specified resistance area.
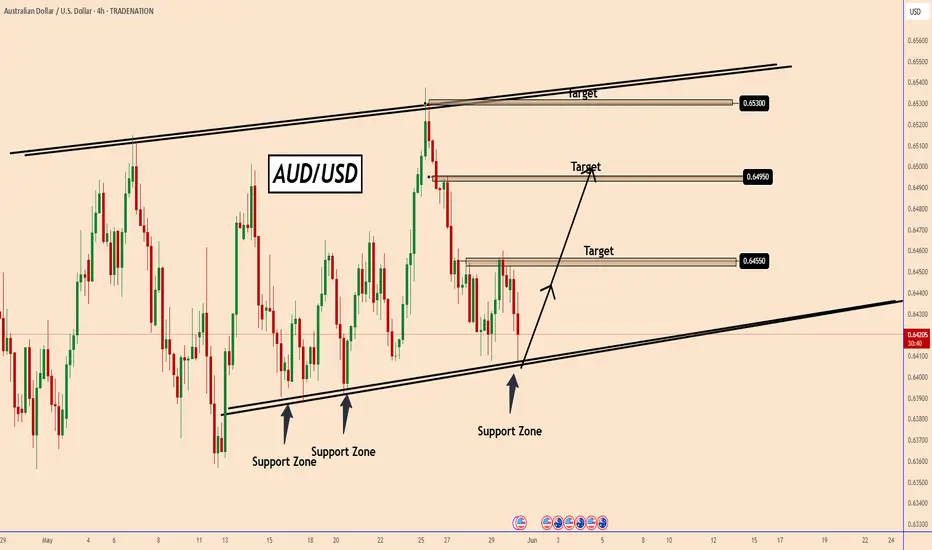
AUDUSD: Complex Price Action with Bullish BiasAUDUSD: Complex Price Action with Bullish Bias
AUDUSD is exhibiting a complex price pattern, often characterized by small and choppy movements. The chart shows that the price has been repeatedly halted near the current zone.
If this level holds, the likelihood of a bullish continuation increases, with potential targets at 0.6455, 0.6495, and 0.6530, as indicated on the chart.
You may find more details in the chart!
Thank you and Good Luck!
❤️PS: Please support with a like or comment if you find this analysis useful for your trading day❤️
Disclosure: I am part of Trade Nation's Influencer program and receive a monthly fee for using their TradingView charts in my analysis.
Aussie H4 | Potential bullish bounceThe Aussie (AUD/USD) is falling towards a multi-swing-low support and could potentially bounce off this level to climb higher.
Buy entry is at 0.6394 which is a multi-swing-low support that aligns with the 23.6% Fibonacci retracement.
Stop loss is at 0.63330 which is a level that lies underneath a multi-swing-low support.
Take profit is at 0.6521 which is a swing-high resistance.
High Risk Investment Warning
Trading Forex/CFDs on margin carries a high level of risk and may not be suitable for all investors. Leverage can work against you.
Stratos Markets Limited (tradu.com ):
CFDs are complex instruments and come with a high risk of losing money rapidly due to leverage. 63% of retail investor accounts lose money when trading CFDs with this provider. You should consider whether you understand how CFDs work and whether you can afford to take the high risk of losing your money.
Stratos Europe Ltd (tradu.com ):
CFDs are complex instruments and come with a high risk of losing money rapidly due to leverage. 63% of retail investor accounts lose money when trading CFDs with this provider. You should consider whether you understand how CFDs work and whether you can afford to take the high risk of losing your money.
Stratos Global LLC (tradu.com ):
Losses can exceed deposits.
Please be advised that the information presented on TradingView is provided to Tradu (‘Company’, ‘we’) by a third-party provider (‘TFA Global Pte Ltd’). Please be reminded that you are solely responsible for the trading decisions on your account. There is a very high degree of risk involved in trading. Any information and/or content is intended entirely for research, educational and informational purposes only and does not constitute investment or consultation advice or investment strategy. The information is not tailored to the investment needs of any specific person and therefore does not involve a consideration of any of the investment objectives, financial situation or needs of any viewer that may receive it. Kindly also note that past performance is not a reliable indicator of future results. Actual results may differ materially from those anticipated in forward-looking or past performance statements. We assume no liability as to the accuracy or completeness of any of the information and/or content provided herein and the Company cannot be held responsible for any omission, mistake nor for any loss or damage including without limitation to any loss of profit which may arise from reliance on any information supplied by TFA Global Pte Ltd.
The speaker(s) is neither an employee, agent nor representative of Tradu and is therefore acting independently. The opinions given are their own, constitute general market commentary, and do not constitute the opinion or advice of Tradu or any form of personal or investment advice. Tradu neither endorses nor guarantees offerings of third-party speakers, nor is Tradu responsible for the content, veracity or opinions of third-party speakers, presenters or participants.

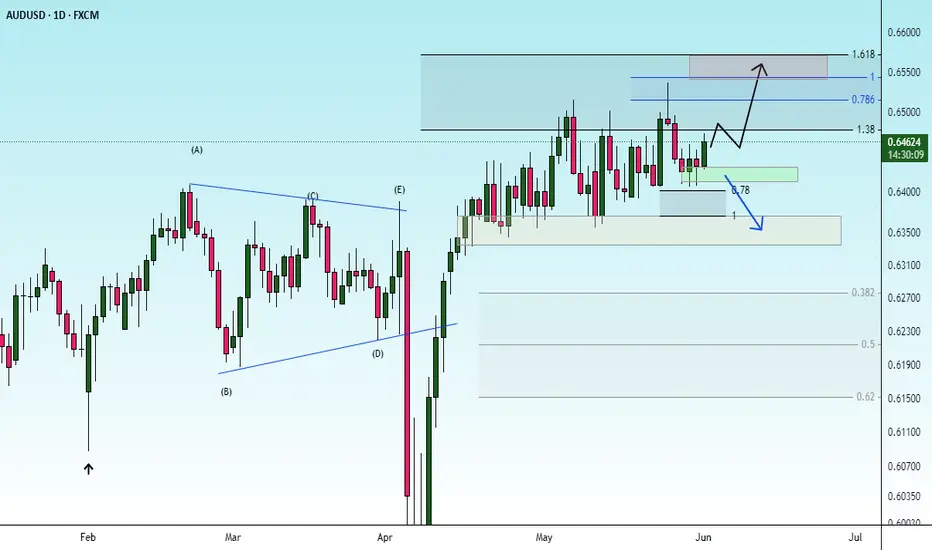
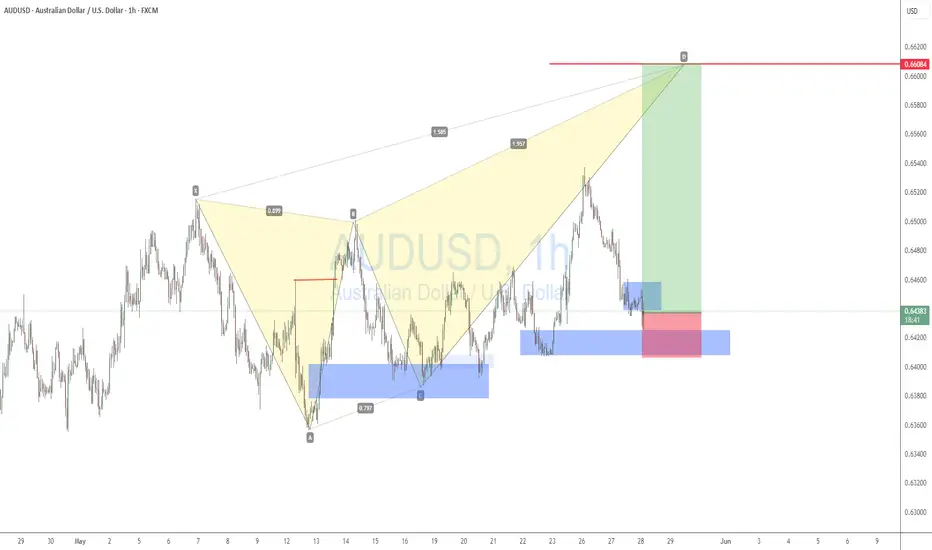
AUDUSD BULLISH RUNAUDUSD is expected to buy to complete the Deep crab pattern. With higher than expected CPI figures AUD is expected to bully the green-back which is struggling with low interest rate figures as a result of declining inflation figures nearing its 2024 inflation target of 2% and global trade wars.
expecting AUDUSD to hit around0.66000 psychological level
AUD/USD Setup – Demand Zone Respect & USD WeaknessPrice continues to hold a clean range above a demand zone that previously triggered aggressive buying.
With USD showing broad weakness across the board (DXY strongly bearish), this setup becomes even more attractive.
🔹 Clear structure of accumulation
🔹 Buyers defending the zone on multiple touches
🔹 Clean RRR and upside potential aligned with macro sentiment
🔹 Ideal conditions for a bullish continuation move
This type of setup reflects a disciplined, smart money approach — no need to rush, no need to chase.
#audusd #forexsetup #smartmoneytrader #priceaction #demandzone #forexcommunity #tradingview #liquidityzone #telegramsignals #swingtrading
Tapped In & Tapped Out – Smart Money’s About to Dump AUDUSDAUDUSD has just executed a classic liquidity raid, sweeping a short-term high into a high-probability 1H Order Block (OB) — which also aligns with the continuation move that broke prior structure to the downside.
This OB sits directly above equal highs that served as a clear magnet for buy-side liquidity — a textbook inducement for retail breakout traders. Smart money logic suggests these stops were used to fill sell orders.
Notably, there’s a Fair Value Gap (FVG) resting just below, which increases the probability of a displacement move to the downside. We now expect price to deliver into the Sellside Liquidity (4H) resting beneath the equal lows, a highly attractive draw on liquidity from an institutional perspective.
Key Confluences
✅ 1H OB tapped with precision
✅ Buy-side liquidity swept via equal highs
✅ Clear FVG imbalance below
✅ Sellside liquidity target aligned with equal lows
✅ Weekly bias still leans bearish
This is a high-probability setup when following ICT/SMC principles — refined entry, defined target, clean structure.
🔍 Watch for:
A clean bearish displacement from current levels
Potential lower timeframe confirmations (BOS/CHoCH) for tighter risk entries
📌 Target: 0.64071
🧠 Bias: Bearish
⚠️ As always — DYOR (Do Your Own Research). Institutional concepts work best with context and personal backtesting.

AUDUSD BullishAs anticipated, AUDUSD and USD pairs gap up, you can refer to our GBPUSD analysis, we called it. It is too late to buy at support, the best you can do is look for entries along the way. I am seeing a double bottom forming on M30, this may offer entries for retailers.

Week of 6/1/25: AU AnalysisA lot of consolidation from the prior week, all time frames are technically bullish and internal 1h structure is bullish. I am going to be cautious around the current level until there is a prime entry model to get in long.
Major news:
PMI - Monday
PMI/ADP NFP - Wed
Unemployment Claims - Thurs
NFP/Unemployment rate - Friday

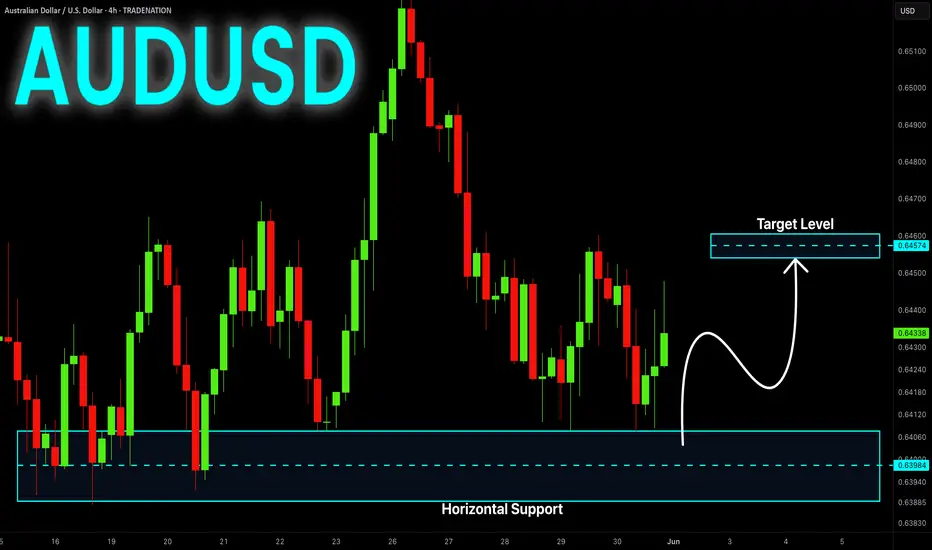
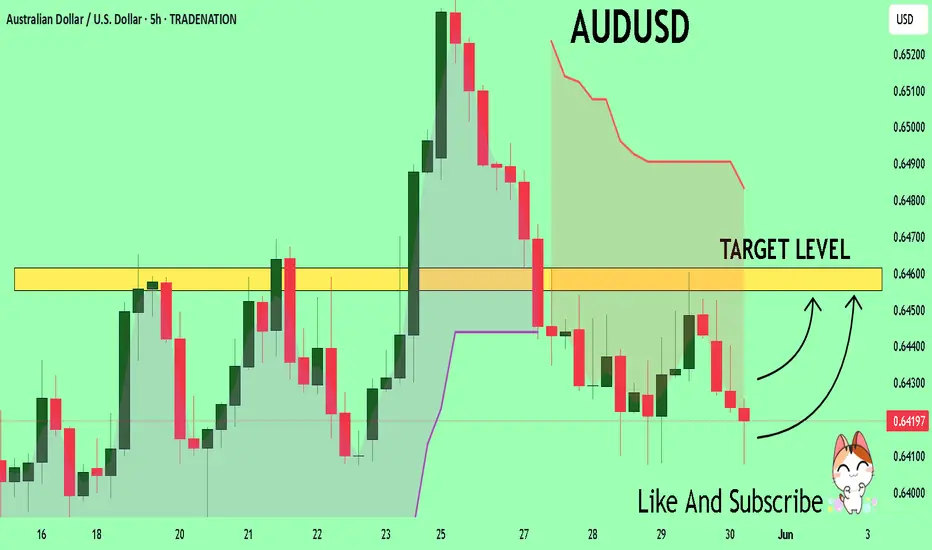
AUD_USD POTENTIAL LONG|
✅AUD_USD fell down sharply
But a strong support level was hit around 0.6400
Thus as a rebound is already happening
A move up towards the target of 0.6463 shall follow
LONG🚀
✅Like and subscribe to never miss a new idea!✅
Disclosure: I am part of Trade Nation's Influencer program and receive a monthly fee for using their TradingView charts in my analysis.
AUDUSD: weekly analysis Jun 1, 2025 – Jun 7, 2025Trump administration makes traders follow trades every single political news. Unpredictable about everything, if I want to describe the U.S president in one phrase. one day he decides to reduce tariffs, the other day he increases. One day wishes a good future for Iran, the other day he threatens Islamic republic with bombing. The same story with Russia, China and everything expects the Crypto. Okay let's get back to Aussie! any good news about China-Australia relations will increase the AUD.
The other important news this week is quarter to quarter GDP of the land of kangaroos.
After all, taking a look at weekly chart! A bullish week is more possible
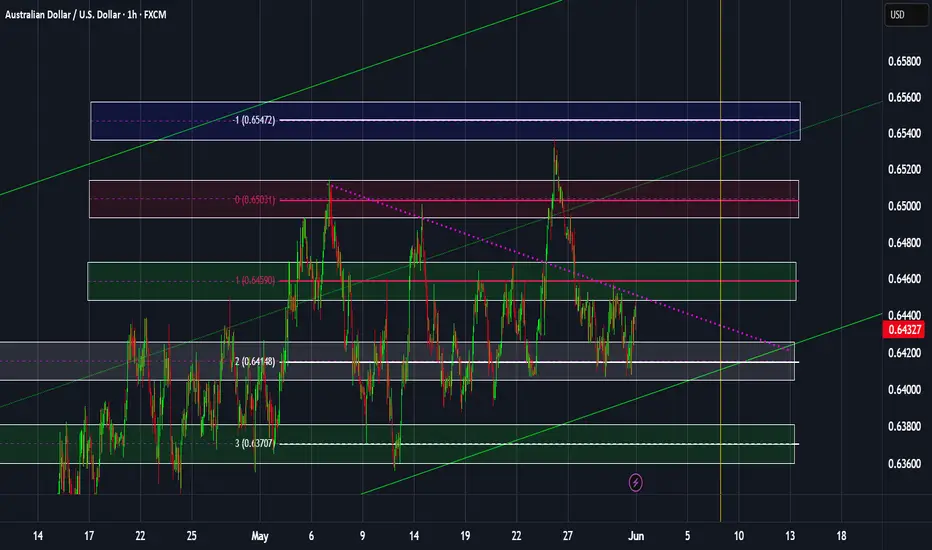
*******************************************************************
The indicated levels are determined based on the most reaction points and the assumption of approximately equal distance between the zones.
Some of these points can also be confirmed by the mathematical intervals of Murray.
You can enter with/without confirmation. IF you want to take confirmation you can use LTF analysis, Spike move confirmation, Trend Strength confirmation and ETC.
SL could be placed below the zone or regarding the LTF swings.
TP is the next zone or the nearest moving S&R, which are median and borders of the drawn channels.
*******************************************************************
Role of different zones:
GREEN: Just long trades allowed on them.
RED: Just Short trades allowed on them.
BLUE: both long and short trades allowed on them.
WHITE: No trades allowed on them! just use them as TP points
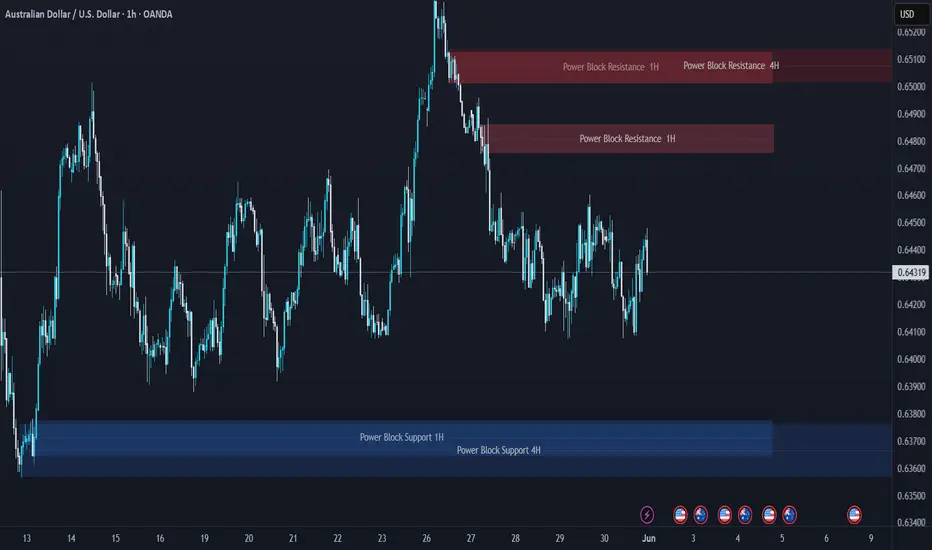
AUDUSD Support & Resistance LevelsThese zones have been generated using a custom-built software tool, developed and refined over an extended period of time. The tool is the result of dedicated effort and research, aiming to identify high-probability support and resistance areas with precision.
AUD-USD Rebound Ahead! Buy!
Hello,Traders!
AUD-USD made a retest
Of the horizontal demand
Area around 0.6394 and
We are already seeing a
Nice bullish reaction from
The level so we are locally
Bullish biased and we will
Be expecting a further
Local bullish move up
On Monday
Buy!
Comment and subscribe to help us grow!
Check out other forecasts below too!
Disclosure: I am part of Trade Nation's Influencer program and receive a monthly fee for using their TradingView charts in my analysis.
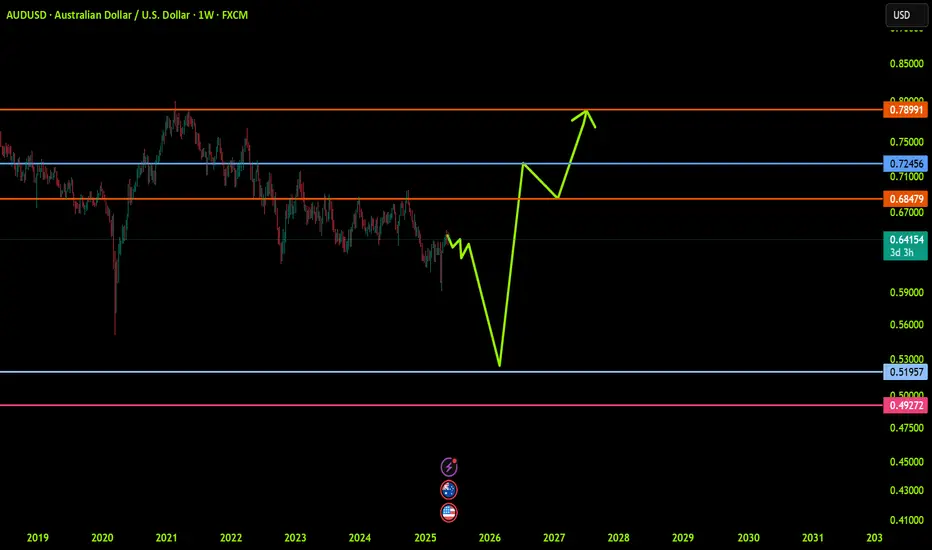
AUDUSD: Trend in weekly time framePlease pay special attention to the accurate trend, and very accurate colored levels.
Be careful
BEST
MT
AUDUSDAUD/USD Analysis: Bond Yields, Interest Rate Differential, Carry Trade, and Upcoming Fundamentals
1. 10-Year Bond Yields and Interest Rate Differential (May 25–30, 2025)
Australian 10-Year Bond Yield: ~4.42% (as of May 23, 2025) .
US 10-Year Treasury Yield: ~4.51% (as of May 21–23, 2025) .
Interest Rate Differential:4.51% (US)−4.42% (AUD)=+0.09%
so the IRD is 4.51% (US)−4.42% (AUD)=+0.09%
The US held a slight yield advantage, though the spread narrowed due to RBA rate cuts and weaker Australian data.
2. Policy Rate Differential and Carry Trade Advantage
RBA Cash Rate: 3.85% (cut by 25bps in May 2025) .
Fed Funds Rate: 4.25% (lower bound) .
Interest Rate Differential:4.25% (US)−3.85% (AUD)=+0.40%
The USD held a carry trade advantage, incentivizing investors to borrow AUD (lower rate) and invest in USD assets (higher rate).
3. AUD/USD Price Action (May 25–30)
AUD/USD fell to 0.6425, down 1% weekly, pressured by:
Weak Australian retail sales (-0.1% MoM) and building permits .
RBA’s dovish pivot, signaling potential further cuts amid trade tensions and slowing inflation .
Reinstated US tariffs under Trump’s policies, boosting USD safe-haven demand .
4. Key Fundamentals for June 1–7, 2025
Australia:
Retail Sales (May 30): Weakness could reinforce RBA easing expectations .
Building Approvals (June 3): Further declines may pressure AUD .
RBA Rhetoric: Dovish guidance likely to persist, with markets pricing rates to 3% by early 2026 .
US:
Nonfarm Payrolls (June 6): Strong data may revive Fed rate hike bets, widening the USD yield advantage.
Tariff Developments: Escalating US-China/EU trade tensions could strengthen USD .
Global Risks: Stagflation fears and bond market volatility may amplify AUD/USD swings .
Summary Table
Metric Australia (AUD) United States (USD)
10-Year Bond Yield ~4.42% ~4.51%
Policy Rate 3.85% 4.25%
Interest Rate Differential +0.40% (USD over AUD) —
Carry Trade Bias USD favored —
Conclusion
May 25–30: AUD/USD weakened due to RBA dovishness and USD strength, with a +0.40% rate differential supporting USD carry trades.
June 1–7: Focus on Australian retail sales, building approvals, and US jobs data. A soft AU data mix and resilient US economy may extend AUD/USD’s downtrend toward 0.6360
Monitor RBA/Fed rhetoric and trade policy shifts for volatility.
#audusd

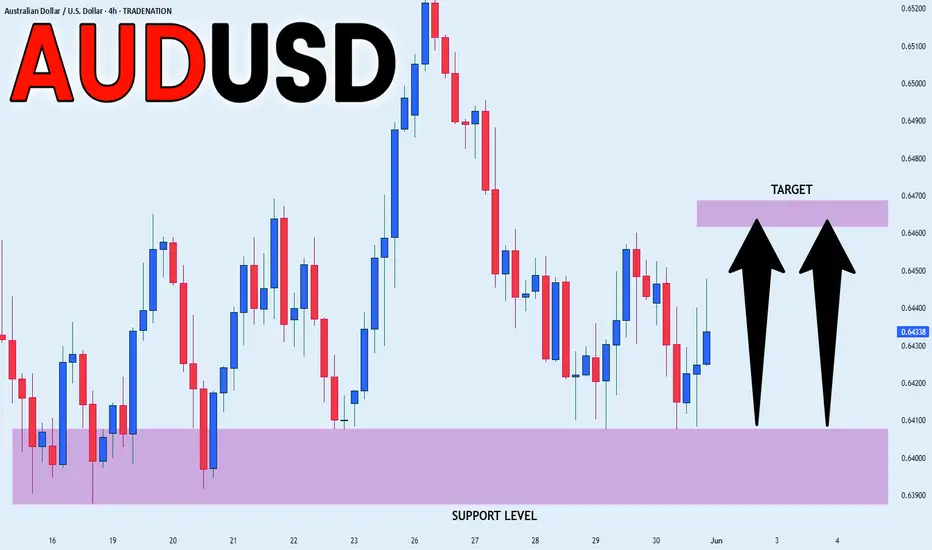
AUD/USD Price Action Analysis – Range Trading Opportunity📉 AUD/USD Price Action Analysis – Range Trading Opportunity 🔁
⚙️ Market Structure Overview:
The AUD/USD pair is currently exhibiting a well-defined range-bound market structure between the Support Zone (0.63800 – 0.64000) and the Resistance Zone (0.65200 – 0.65400).
🟩 Support Zone
📍 Identified by multiple price rejections and bullish reversals (marked with ⬆️ arrows).
💡 This area represents strong buying interest, making it a potential long-entry zone on bullish confirmation.
🟥 Resistance Zone
📍 Marked by two sharp rejections (⬇️ arrows) and upper wicks.
💡 This zone has served as a supply area, where sellers overpower buyers, signaling potential short opportunities.
🔄 Current Scenario:
Price is approaching the support zone again after rejecting the resistance area. Based on historical behavior:
📉 Short-term Bearish Momentum is in play until support is tested.
📈 Potential Bullish Reversal is likely if support holds — aligning with previous bounce behavior.
🔮 Trade Ideas:
📈 Bullish Setup:
📍Entry: Near support zone (~0.63850)
🎯Target: Resistance zone (~0.65250)
🛑Stop-loss: Below support (~0.63650)
📉 Bearish Setup (Breakdown Scenario):
📍Entry: On confirmed break below support (~0.63800)
🎯Target: Lower structure zones (TBD based on breakout leg)
🛑Stop-loss: Above broken support
📅 Key Risk Events:
🔔 Multiple high-impact USD and AUD economic events approaching.
🧭 Traders should monitor fundamentals closely for increased volatility and breakout potential.
🧠 Summary:
📌 The AUD/USD pair is currently respecting a range-bound structure.
🧱 Buying from support and selling from resistance remains the most probable high-probability strategy.
📊 Range trading suits this setup until a confirmed breakout or breakdown occurs.
🔔 Like & Follow for more clean, structured trade setups and zone-based price action ideas!

AUDUSD INTRADAY sideways consolidation supported at 0.6360The AUD/USD pair maintains a bullish bias, underpinned by a steady rising trend on the higher timeframes. However, recent intraday price action shows consolidation, indicating a pause in upward momentum as the market awaits a fresh catalyst.
Key Technical Levels:
Support:
0.6360 – Critical near-term support and prior consolidation zone. A successful retest could reinforce the bullish setup.
0.6320 – Next support level; a break below 0.6360 may trigger a deeper pullback.
0.6280 – Broader downside support zone; loss of this level would signal a shift in trend.
Resistance:
0.6500 – Primary upside target on continuation of bullish momentum.
0.6530 – Secondary resistance; break above would confirm strength.
0.6570 – Long-term resistance zone; potential target if bullish momentum accelerates.
Technical Outlook:
A pullback to 0.6360 followed by a bullish rebound would suggest continuation of the current uptrend, opening room for gains toward 0.6500, 0.6530, and 0.6570 over the medium term. On the downside, a daily close below 0.6360 would invalidate the bullish setup, exposing the pair to a potential decline toward 0.6320 and 0.6280.
Conclusion:
AUD/USD remains in a bullish structure, but near-term direction depends on the 0.6360 level. A rebound from support keeps the upside scenario in play, while a confirmed break lower may lead to a corrective retracement. Traders should watch for price behavior around 0.6360 for confirmation of the next move.
This communication is for informational purposes only and should not be viewed as any form of recommendation as to a particular course of action or as investment advice. It is not intended as an offer or solicitation for the purchase or sale of any financial instrument or as an official confirmation of any transaction. Opinions, estimates and assumptions expressed herein are made as of the date of this communication and are subject to change without notice. This communication has been prepared based upon information, including market prices, data and other information, believed to be reliable; however, Trade Nation does not warrant its completeness or accuracy. All market prices and market data contained in or attached to this communication are indicative and subject to change without notice.

AUDUSD Will Explode! BUY!
My dear followers,
I analysed this chart on AUDUSD and concluded the following:
The market is trading on 0.6420 pivot level.
Bias - Bullish
Technical Indicators: Both Super Trend & Pivot HL indicate a highly probable Bullish continuation.
Target - 0.6455
About Used Indicators:
A super-trend indicator is plotted on either above or below the closing price to signal a buy or sell. The indicator changes color, based on whether or not you should be buying. If the super-trend indicator moves below the closing price, the indicator turns green, and it signals an entry point or points to buy.
Disclosure: I am part of Trade Nation's Influencer program and receive a monthly fee for using their TradingView charts in my analysis.
———————————
WISH YOU ALL LUCK
EURUSD,GBPUSD and AUDUSD Analysis todayHello traders, this is a complete multiple timeframe analysis of this pair. We see could find significant trading opportunities as per analysis upon price action confirmation we may take this trade. Smash the like button if you find value in this analysis and drop a comment if you have any questions or let me know which pair to cover in my next analysis.

Possibility of correction A trend change is expected to occur within the resistance levels and a continuation of the downtrend is expected. If the price breaks through the resistance level, a continuation of the uptrend is possible.

2nd poi bounce entry For London session Looking for buys to close out the week
Price respected poi 1 with a strong push out giving a possible 2nd entry trade

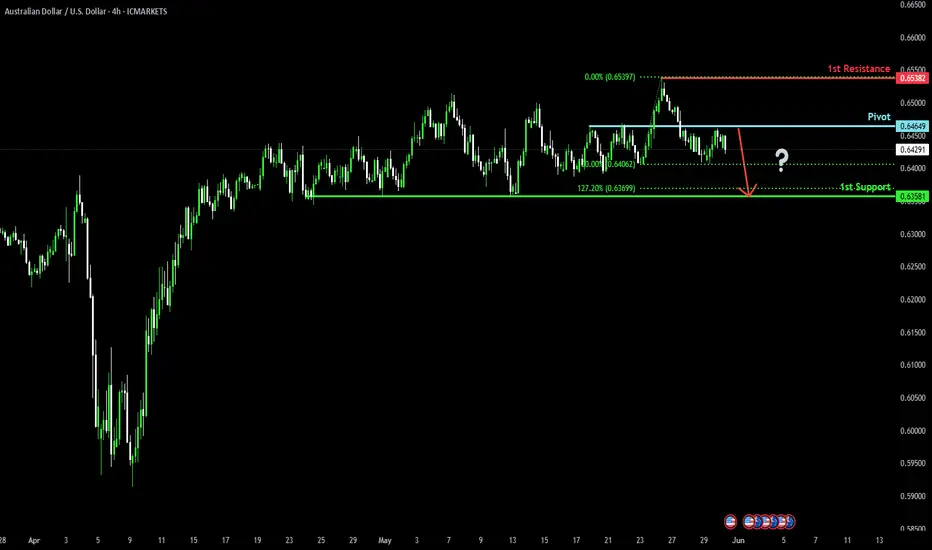
Bearish drop off pullback resistance?GBP/USD has rejected off the pivot and could drop to the 1st support, which aligns with the 127.2% Fibonacci extension.
Pivot: 0.6446
1st Support: 0.6358
1st Resistance: 0.6538
Risk Warning:
Trading Forex and CFDs carries a high level of risk to your capital and you should only trade with money you can afford to lose. Trading Forex and CFDs may not be suitable for all investors, so please ensure that you fully understand the risks involved and seek independent advice if necessary.
Disclaimer:
The above opinions given constitute general market commentary, and do not constitute the opinion or advice of IC Markets or any form of personal or investment advice.
Any opinions, news, research, analyses, prices, other information, or links to third-party sites contained on this website are provided on an "as-is" basis, are intended only to be informative, is not an advice nor a recommendation, nor research, or a record of our trading prices, or an offer of, or solicitation for a transaction in any financial instrument and thus should not be treated as such. The information provided does not involve any specific investment objectives, financial situation and needs of any specific person who may receive it. Please be aware, that past performance is not a reliable indicator of future performance and/or results. Past Performance or Forward-looking scenarios based upon the reasonable beliefs of the third-party provider are not a guarantee of future performance. Actual results may differ materially from those anticipated in forward-looking or past performance statements. IC Markets makes no representation or warranty and assumes no liability as to the accuracy or completeness of the information provided, nor any loss arising from any investment based on a recommendation, forecast or any information supplied by any third-party.