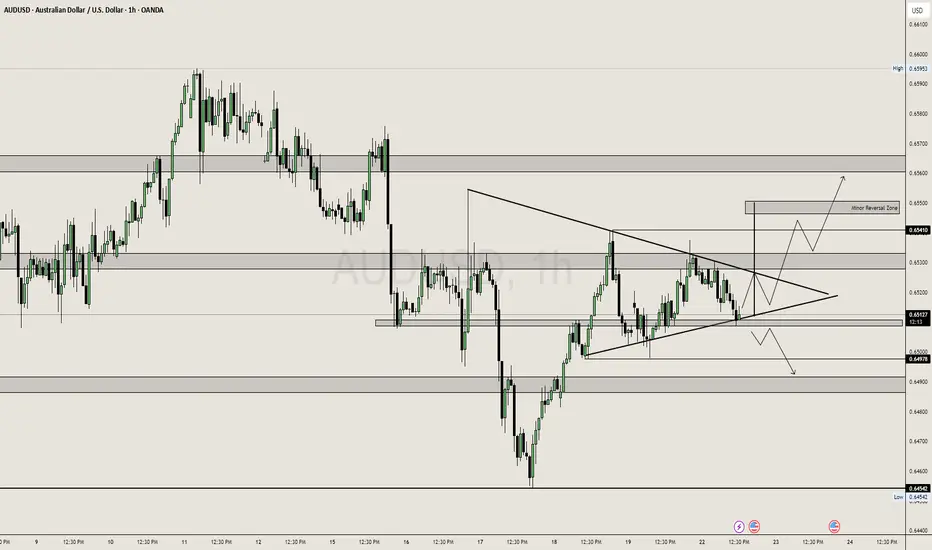
AUDUSD: Symmetrical Triangle
Price is consolidating inside a symmetrical triangle, showing indecision between bulls and bears.
Before entering the triangle, the market showed strong bullish momentum, indicating a possible continuation pattern.
Price is hovering near a key support level (0.6513) where multiple candle wicks suggest buying pressure is defending.
🔍 Key Zones & Levels:
Support (0.6500–0.6510):
Price is reacting strongly here.
A break below this = bearish pressure → could retest lower demand zones.
Resistance (0.6530–0.6541):
Mid-structure resistance.
Clean breakout above this confirms bullish control.
Minor Reversal Zone (0.6555):
If bulls break above triangle, this area may stall price or reverse short term.
Ideal area for TP or trailing SL.
Demand Zone (0.6454):
Strong historical buy zone.
Only likely to hit if triangle breaks down aggressively.
📈 Bullish Scenario:
If price breaks and closes above triangle + 0.6530 zone, expect:
Rally to 0.6541 (first target)
Extension toward 0.6555 where reversal/supply could kick in.
Momentum and volume confirmation needed — no breakout = no trade.
📉 Bearish Scenario:
If price breaks below triangle & 0.6500, expect:
Drop to 0.6490 (minor support)
Further slide toward 0.6454 (major support) if downside accelerates.
AUDUSD trade ideas
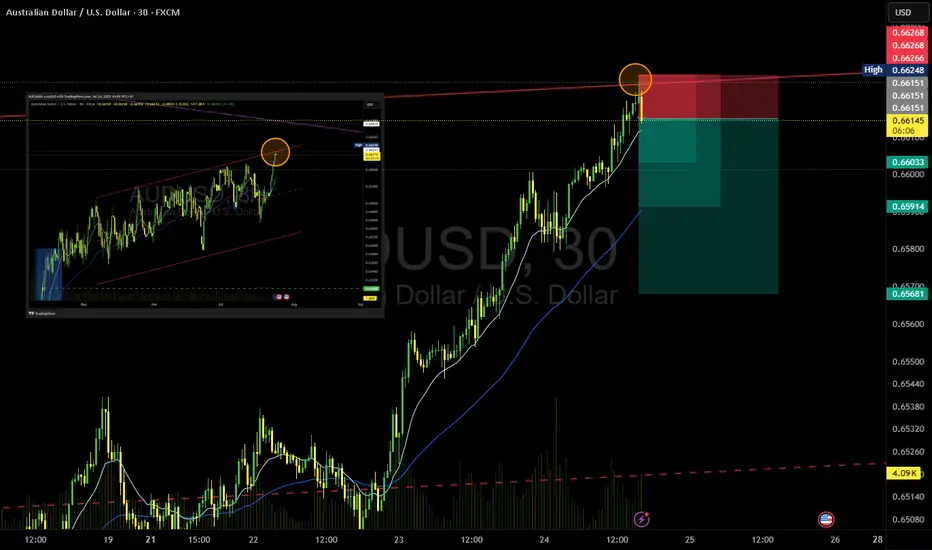
AUD/USD Sell SetupOANDA:AUDUSD
Timeframe: m30
Entry: 0.66151
SL: 0.66266
TP1: 0.66033
TP2: 0.65914
TP4: 0.65681
📊 Setup Rationale
🔺 Channel Top Rejection (8H Overlay) Price has touched the upper boundary of a descending channel visible on the 8-hour chart. This zone has historically acted as a strong resistance, increasing the probability of a reversal.
🧱 Local Structure (30min) Entry aligns with a minor double top (in lower TFs) and bearish momentum. The tight SL allows for a high R:R profile.
🔄 Momentum Shift Watch for bearish engulfing or rejection wick on lower timeframes to confirm entry.
#MJTrading #Forex #AUDUSD #Sell
Psychology always matters:
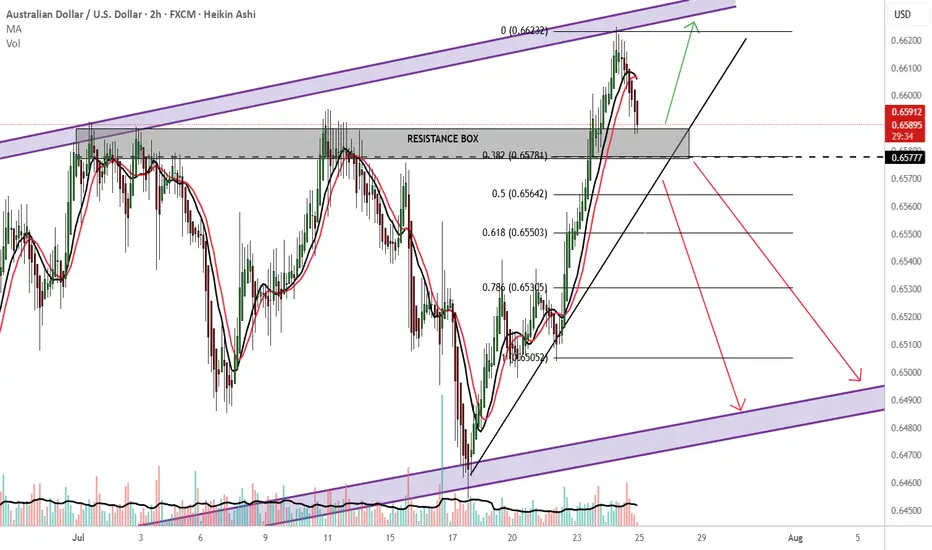
AUDUSD Still early days
20% in me:
Unless strong bullish fundamentals present themselves or the big boys with the big bucks drive a bullish push anywhere from 0.65784 or resistance, I would be looking to sell.
Buy outside the resistance box
TP:0.66600 new immediate high?
Please also consider price action as there are 2 previous rejections in the 0.65784 price area.
80% in me:
-Australia is heavily tied to China via exports
RBA rate cuts?
Falling iron ore prices...
-Perfect price action channel trade. SELL at resistance BUY at support. Bullish long term, bearish short term.
-fib 0.382 downward continuation and close below 0.65784
-Looking for a break below the upward sloping trendline HARD sell
-safer option: wait for a 0.65780 retest, below the upward sloping trendline sells and make bank.
TP: 0.6500
THOUGHTS?
AUD/USD: Rising Wedge Breakdown Signals Bearish ShiftAUD/USD has broken down from a rising wedge formation after rejecting near the 61.8% Fibonacci retracement at 0.6558. This pattern, typically bearish, suggests the recent uptrend is losing steam — a view reinforced by Friday’s strong bearish candle closing below both the wedge support and the 50-day SMA (0.6510).
The price action now sits just above the 200-day SMA (0.6397), a level that could act as a short-term buffer. If this moving average gives way, focus shifts to the prior horizontal support at 0.6170. Meanwhile, upside attempts may find resistance at the broken wedge support and Fib zone near 0.6550.
Momentum indicators support the bearish case:
MACD is flat but biased lower, hovering near the zero line.
RSI has dipped below 50 (currently ~47.7), indicating weakening bullish momentum.
Unless AUD/USD quickly reclaims 0.6550, the path appears tilted toward further losses, potentially targeting the 0.63–0.62 zone.
Bias: Bearish breakdown with downside pressure while below 0.6550. Watch 0.6397 and 0.6170 as key support levels.
-MW

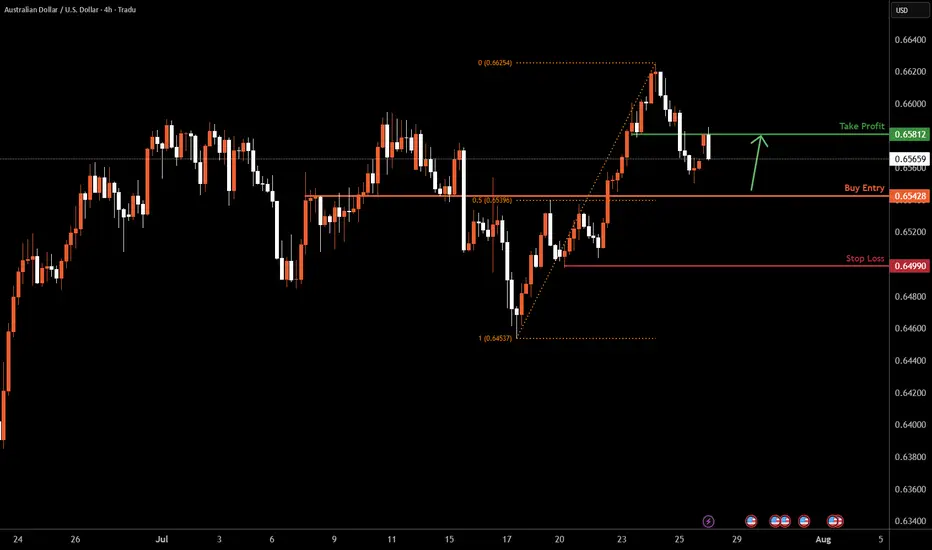
AUDUSD H4 I Bullish Bounce Off the 50% Fib Based on the H4 chart analysis, we can see that the price is falling toward our buy entry at 0.6542, which is a pullback support that aligns with the 50% Fib retracement.
Our take profit will be at 0.6581, an overlap resistance.
The stop loss will be placed at 0.6499, a swing low support.
High Risk Investment Warning
Trading Forex/CFDs on margin carries a high level of risk and may not be suitable for all investors. Leverage can work against you.
Stratos Markets Limited (tradu.com ):
CFDs are complex instruments and come with a high risk of losing money rapidly due to leverage. 66% of retail investor accounts lose money when trading CFDs with this provider. You should consider whether you understand how CFDs work and whether you can afford to take the high risk of losing your money.
Stratos Europe Ltd (tradu.com ):
CFDs are complex instruments and come with a high risk of losing money rapidly due to leverage. 66% of retail investor accounts lose money when trading CFDs with this provider. You should consider whether you understand how CFDs work and whether you can afford to take the high risk of losing your money.
Stratos Global LLC (tradu.com ):
Losses can exceed deposits.
Please be advised that the information presented on TradingView is provided to Tradu (‘Company’, ‘we’) by a third-party provider (‘TFA Global Pte Ltd’). Please be reminded that you are solely responsible for the trading decisions on your account. There is a very high degree of risk involved in trading. Any information and/or content is intended entirely for research, educational and informational purposes only and does not constitute investment or consultation advice or investment strategy. The information is not tailored to the investment needs of any specific person and therefore does not involve a consideration of any of the investment objectives, financial situation or needs of any viewer that may receive it. Kindly also note that past performance is not a reliable indicator of future results. Actual results may differ materially from those anticipated in forward-looking or past performance statements. We assume no liability as to the accuracy or completeness of any of the information and/or content provided herein and the Company cannot be held responsible for any omission, mistake nor for any loss or damage including without limitation to any loss of profit which may arise from reliance on any information supplied by TFA Global Pte Ltd.
The speaker(s) is neither an employee, agent nor representative of Tradu and is therefore acting independently. The opinions given are their own, constitute general market commentary, and do not constitute the opinion or advice of Tradu or any form of personal or investment advice. Tradu neither endorses nor guarantees offerings of third-party speakers, nor is Tradu responsible for the content, veracity or opinions of third-party speakers, presenters or participants.
AUDUSD BUYBUY @0.64256
SL @0.64189
TP @0.64591
If SL hits by a candle sweep and closed above the entry level again buy....
And always risk 1%

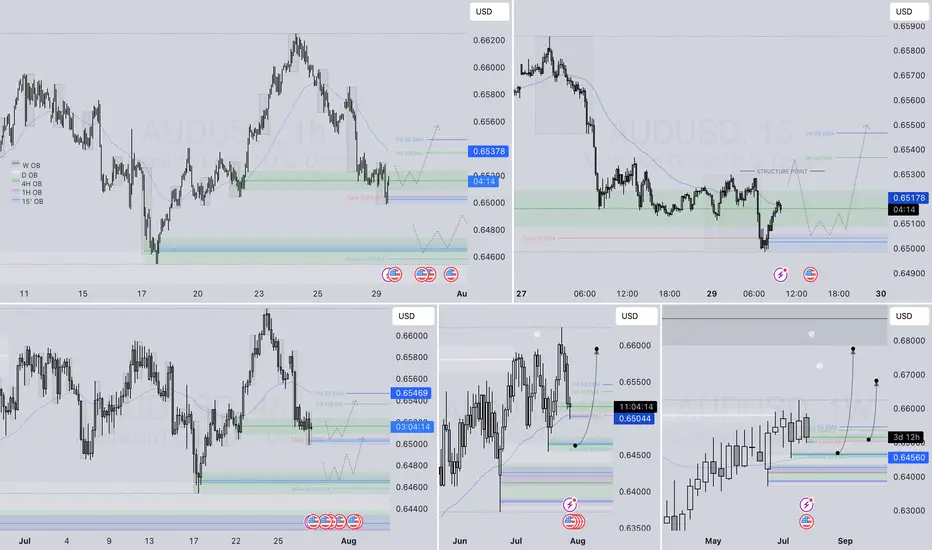
AUDUSD – DAILY FORECAST Q3 | W31 | D30 | Y25📊 AUDUSD – DAILY FORECAST
Q3 | W31 | D30 | Y25
Daily Forecast 🔍📅
Here’s a short diagnosis of the current chart setup 🧠📈
Higher time frame order blocks have been identified — these are our patient points of interest 🎯🧭.
It’s crucial to wait for a confirmed break of structure 🧱✅ before forming a directional bias.
This keeps us disciplined and aligned with what price action is truly telling us.
📈 Risk Management Protocols
🔑 Core principles:
Max 1% risk per trade
Only execute at pre-identified levels
Use alerts, not emotion
Stick to your RR plan — minimum 1:2
🧠 You’re not paid for how many trades you take, you’re paid for how well you manage risk.
🧠 Weekly FRGNT Insight
"Trade what the market gives, not what your ego wants."
Stay mechanical. Stay focused. Let the probabilities work.
FX:AUDUSD

AUDUSD H4| Bearish reversal off 38.2% Fibonacci resistanceAussie (AUD/USD) is rising towards the sell entry, which is a pullback resistance that lines up with the 38.2% Fibonacci retracement and could reverse to the take profit.
Buy entry is at 0.6541, which is a pullback resistance that lines up with the 38.2% Fibonacci retracement.
Stop loss is at 0.6580, which is a pullback resistance that aligns with the 61.8% Fibonacci retracement.
Take profit is at 0.6467, which is a swing low support.
High Risk Investment Warning
Trading Forex/CFDs on margin carries a high level of risk and may not be suitable for all investors. Leverage can work against you.
Stratos Markets Limited (tradu.com ):
CFDs are complex instruments and come with a high risk of losing money rapidly due to leverage. 65% of retail investor accounts lose money when trading CFDs with this provider. You should consider whether you understand how CFDs work and whether you can afford to take the high risk of losing your money.
Stratos Europe Ltd (tradu.com ):
CFDs are complex instruments and come with a high risk of losing money rapidly due to leverage. 66% of retail investor accounts lose money when trading CFDs with this provider. You should consider whether you understand how CFDs work and whether you can afford to take the high risk of losing your money.
Stratos Global LLC (tradu.com ):
Losses can exceed deposits.
Please be advised that the information presented on TradingView is provided to Tradu (‘Company’, ‘we’) by a third-party provider (‘TFA Global Pte Ltd’). Please be reminded that you are solely responsible for the trading decisions on your account. There is a very high degree of risk involved in trading. Any information and/or content is intended entirely for research, educational and informational purposes only and does not constitute investment or consultation advice or investment strategy. The information is not tailored to the investment needs of any specific person and therefore does not involve a consideration of any of the investment objectives, financial situation or needs of any viewer that may receive it. Kindly also note that past performance is not a reliable indicator of future results. Actual results may differ materially from those anticipated in forward-looking or past performance statements. We assume no liability as to the accuracy or completeness of any of the information and/or content provided herein and the Company cannot be held responsible for any omission, mistake nor for any loss or damage including without limitation to any loss of profit which may arise from reliance on any information supplied by TFA Global Pte Ltd.
The speaker(s) is neither an employee, agent nor representative of Tradu and is therefore acting independently. The opinions given are their own, constitute general market commentary, and do not constitute the opinion or advice of Tradu or any form of personal or investment advice. Tradu neither endorses nor guarantees offerings of third-party speakers, nor is Tradu responsible for the content, veracity or opinions of third-party speakers, presenters or participants.

AUDUSD – DAILY FORECAST Q3 | W31 | D29 | Y25📊 AUDUSD – DAILY FORECAST
Q3 | W31 | D29 | Y25
Daily Forecast 🔍📅
Here’s a short diagnosis of the current chart setup 🧠📈
Higher time frame order blocks have been identified — these are our patient points of interest 🎯🧭.
It’s crucial to wait for a confirmed break of structure 🧱✅ before forming a directional bias.
This keeps us disciplined and aligned with what price action is truly telling us.
📈 Risk Management Protocols
🔑 Core principles:
Max 1% risk per trade
Only execute at pre-identified levels
Use alerts, not emotion
Stick to your RR plan — minimum 1:2
🧠 You’re not paid for how many trades you take, you’re paid for how well you manage risk.
🧠 Weekly FRGNT Insight
"Trade what the market gives, not what your ego wants."
Stay mechanical. Stay focused. Let the probabilities work.
FX:AUDUSD
AUDUSD(20250729)Today's AnalysisMarket news:
After gold prices soared to an all-time high of more than $3,500 an ounce in April, the latest report from the Commodity Futures Trading Commission (CFTC) showed that fund managers have increased their bullish bets to the highest level in 16 weeks.
Technical analysis:
Today's buy and sell boundaries:
0.6538
Support and resistance levels:
0.6610
0.6583
0.6566
0.6511
0.6493
0.6466
Trading strategy:
If the price breaks through 0.6538, consider buying, the first target price is 0.6566
If the price breaks through 0.6511, consider selling, the first target price is 0.6493

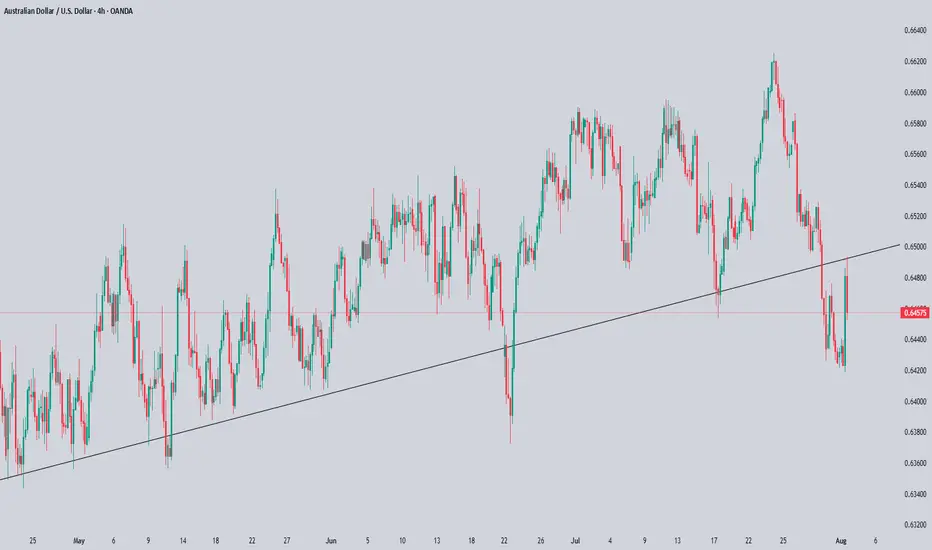
This Chart Screams Breakout – Are You In?AUD/USD – Bullish Setup Brewing
AUD/USD has been respecting this rising channel beautifully, with clean higher highs and higher lows.
Back in April, we saw a classic bear trap, price wicked below support, lured in shorts, and then reversed sharply. That fakeout sparked a strong rally and confirmed demand.
Currently, price is consolidating near the Key Resistance Zone and bouncing off the lower trendline again a sign of strength.
If this pattern continues, we could soon see a breakout above the upper trendline, potentially sending AUD/USD flying toward 0.68+.
Outlook:
As long as the structure holds, dips are for buying. Bulls remain in control.
DYOR, NFA
Thanks for the reading

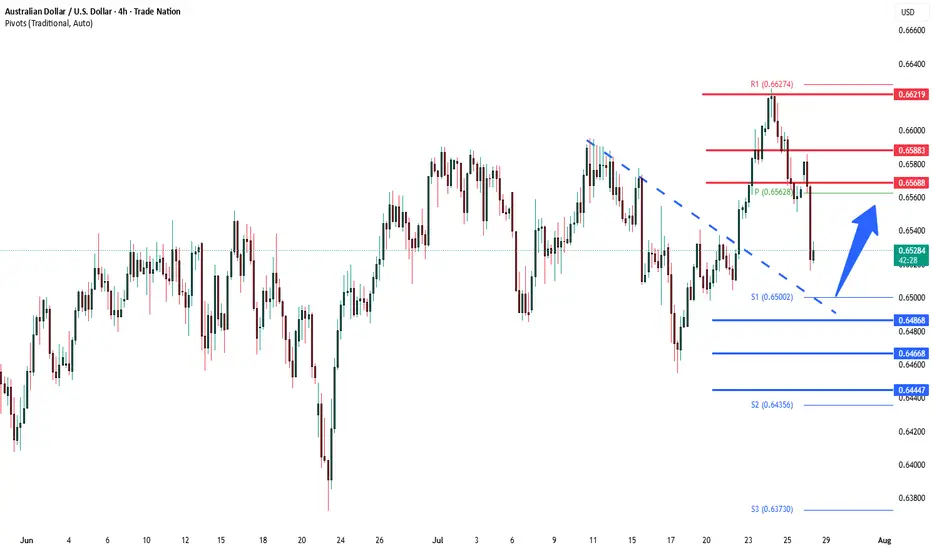
AUDUSD corrective pullback supported at 0.6486Trend Overview:
The AUDUSD currency price remains in a bullish trend, characterised by higher highs and higher lows. The recent intraday price action is forming a continuation consolidation pattern, suggesting a potential pause before a renewed move higher.
Key Technical Levels:
Support: 0.6465 (primary pivot), followed by 0.6445 and 0.6400
Resistance: 0.6570 (initial), then 0.6590 and 0.6625
Technical Outlook:
A pullback to the 0.6465 level, which aligns with the previous consolidation zone, could act as a platform for renewed buying interest. A confirmed bounce from this support may trigger a continuation toward the next resistance levels at 0.6570, 0.6590, and ultimately 0.6625.
Conversely, a daily close below 0.6465 would suggest weakening bullish momentum. This scenario would shift the bias to bearish in the short term, potentially targeting 0.6445 and 0.6400 as downside levels.
Conclusion:
AUDUSD maintains a bullish structure while trading above the 0.6465 support. A bounce from this level would validate the consolidation as a continuation pattern, with upside potential toward the 0.6570 area. A breakdown below 0.6465, however, would invalidate this view and suggest deeper corrective risk.
This communication is for informational purposes only and should not be viewed as any form of recommendation as to a particular course of action or as investment advice. It is not intended as an offer or solicitation for the purchase or sale of any financial instrument or as an official confirmation of any transaction. Opinions, estimates and assumptions expressed herein are made as of the date of this communication and are subject to change without notice. This communication has been prepared based upon information, including market prices, data and other information, believed to be reliable; however, Trade Nation does not warrant its completeness or accuracy. All market prices and market data contained in or attached to this communication are indicative and subject to change without notice.
AUDUSD Technical & Order Flow AnalysisOur analysis is based on a multi-timeframe top-down approach and fundamental analysis.
Based on our assessment, the price is expected to return to the monthly level.
DISCLAIMER: This analysis may change at any time without notice and is solely intended to assist traders in making independent investment decisions. Please note that this is a prediction, and I have no obligation to act on it, nor should you.
Please support our analysis with a boost or comment!
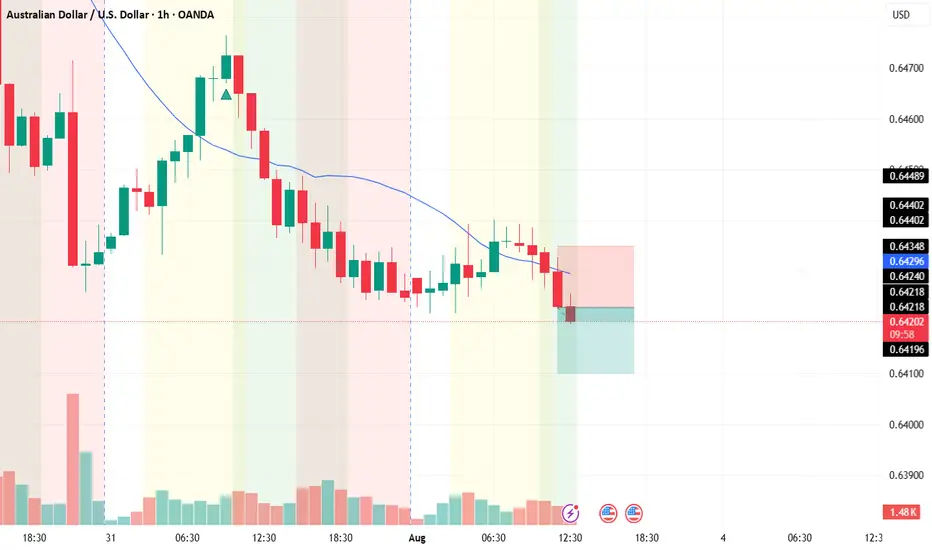
AUD/USDThis is a trade setup for AUD/USD, based on volume and trend analysis.
Entry Price: 0.64230
Stop-Loss (SL): 0.64350
Take-Profit (TP): 0.64100
The trade is intended to be executed instantly at the mentioned price, in alignment with both volume behavior and the current trend direction.
Disclaimer: This setup is shared purely for backtesting purposes and to document trade ideas. It is not financial advice. Always perform your own analysis before making any trading decisions.
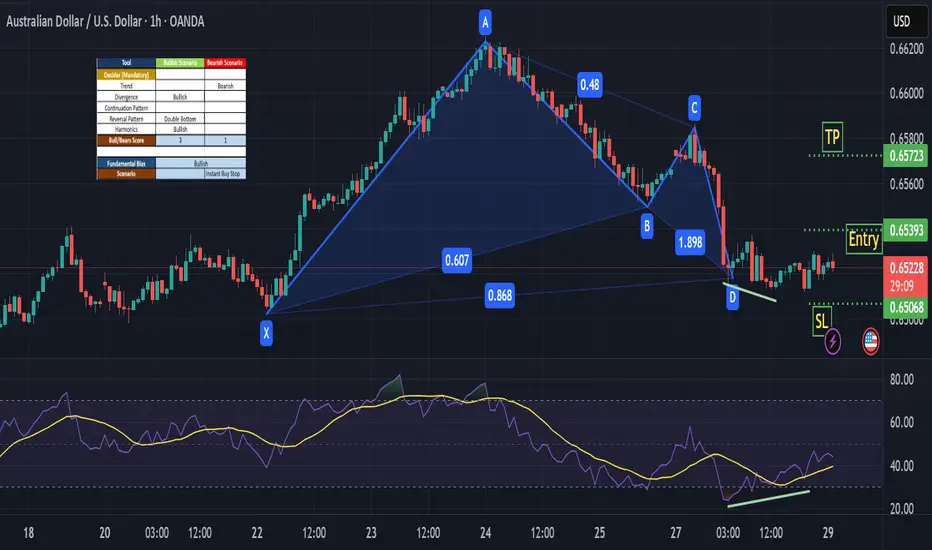
AUDUSD - BullishAUDUSD is Bullish on Fundamental Bias and Seasonal aslo support long position. Divergence can also be observed on RSI. Forming an Harmonic pattern so it looks like buyers are in a strong position
AUD/USD Bulls Eye BreakoutThe Australian Dollar surged more than 1.8% this week with AUD/USD now testing multi-month uptrend resistance at fresh yearly highs. A four-day rally takes price into confluent resistance at the September low / upper parallel at 6622- The focus is on today’s close with the immediate advance vulnerable while below this key slope. Subsequent resistance objectives eyed at the 2019 low at 6671 and the 78.6% retracement of the broader 2024 decline at 6723.
Initial support rests with the July open at 6581 and is backed by the May high-day close (HDC) / weekly open at 6486-6506. Losses would need to be limited to this region for the late-June advance to remain viable (near-term bullish invalidation). Subsequent support seen at the June low-day close (LDC) at 6458 with a break below 6350 ultimately needed to suggest a more significant high is in place / larger reversal is underway.
Bottom line: A breakout of the July opening-range takes AUD/USD into confluent uptrend resistance- risk for topside exhaustion / price inflection here. From a trading standpoint, a good zone to reduce portions of long-exposure / raise protective stops – losses shudl be limited to 6486 IF price is heading higher on this stretch with a close above this slope needed to fuel the next leg of the advance.
Keep in mind the FOMC interest rate decision is on tap next week with Core Personal Consumption Expenditures (PCE) and Non-Farm Payrolls (NFPs) slated into the monthly cross. Stay nimble into the releases and watch the weekly closes here.
-MB

SELL AUDUSD IF DAILY CANDLE ENDS AS BEARISH ON IDC(THIS CHART)sell AUDUSD and buy USDCAD as the dollar is gaining strength

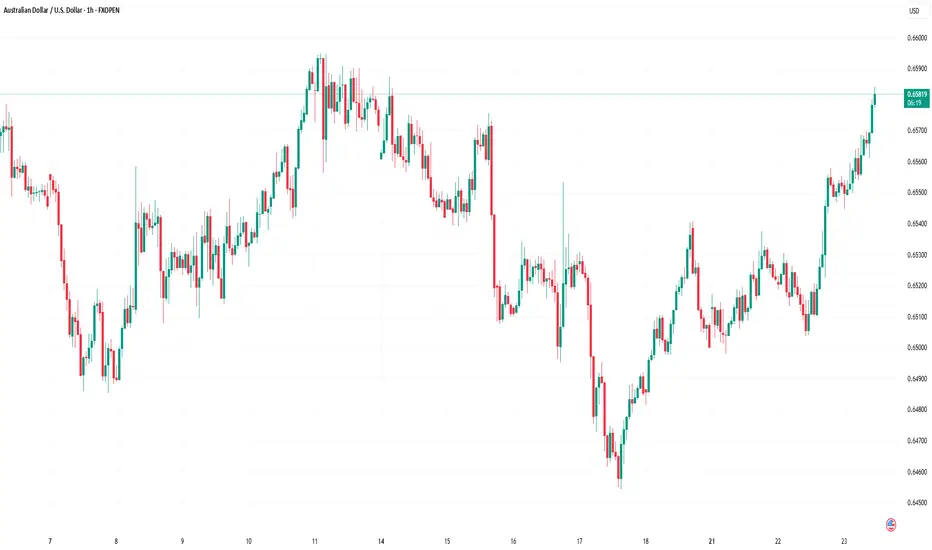
Market Analysis: AUD/USD Climbs as Dollar WeakensMarket Analysis: AUD/USD Climbs as Dollar Weakens
AUD/USD started a decent increase above the 0.6520 level.
Important Takeaways for AUD/USD Analysis Today
- The Aussie Dollar rebounded after forming a base above the 0.6450 level against the US Dollar.
- There is a connecting bullish trend line forming with support at 0.6540 on the hourly chart of AUD/USD.
AUD/USD Technical Analysis
On the hourly chart of AUD/USD at FXOpen, the pair started a fresh increase from the 0.6450 support. The Aussie Dollar was able to clear the 0.6500 resistance to move into a positive zone against the US Dollar.
There was a close above the 0.6550 resistance and the 50-hour simple moving average. Finally, the pair tested the 0.6565 zone. A high was formed near 0.6564 and the pair recently started a consolidation phase.
On the downside, initial support is near the 0.6540 level. There is also a connecting bullish trend line forming with support at 0.6540. It is close to the 23.6% Fib retracement level of the upward move from the 0.6454 swing low to the 0.6564 high.
The next major support is near the 0.6495 zone. If there is a downside break below it, the pair could extend its decline toward the 0.6480 level. It is close to the 76.4% Fib retracement level.
Any more losses might signal a move toward 0.6450. On the upside, the AUD/USD chart indicates that the pair is now facing resistance near 0.6565. The first major resistance might be 0.6575. An upside break above the 0.6575 resistance might send the pair further higher.
The next major resistance is near the 0.6600 level. Any more gains could clear the path for a move toward the 0.6650 resistance zone.
This article represents the opinion of the Companies operating under the FXOpen brand only. It is not to be construed as an offer, solicitation, or recommendation with respect to products and services provided by the Companies operating under the FXOpen brand, nor is it to be considered financial advice.
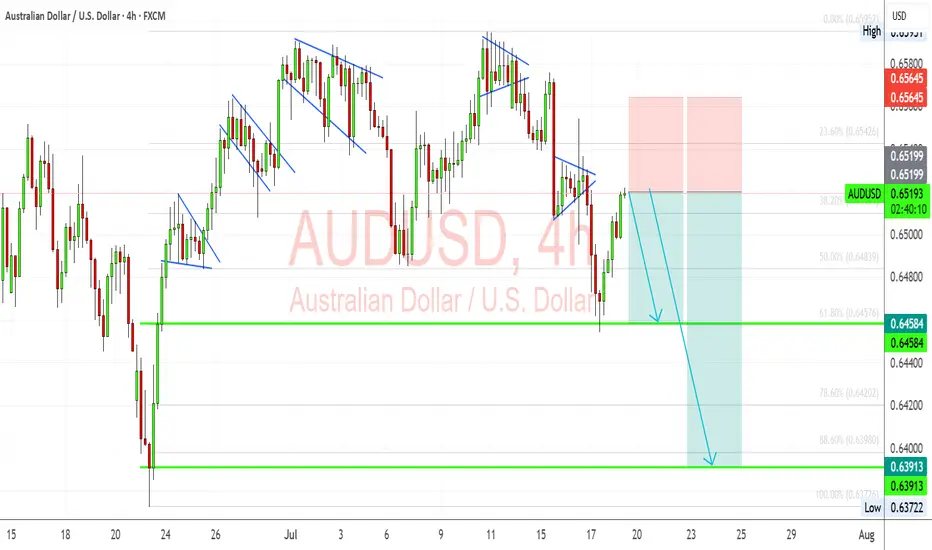
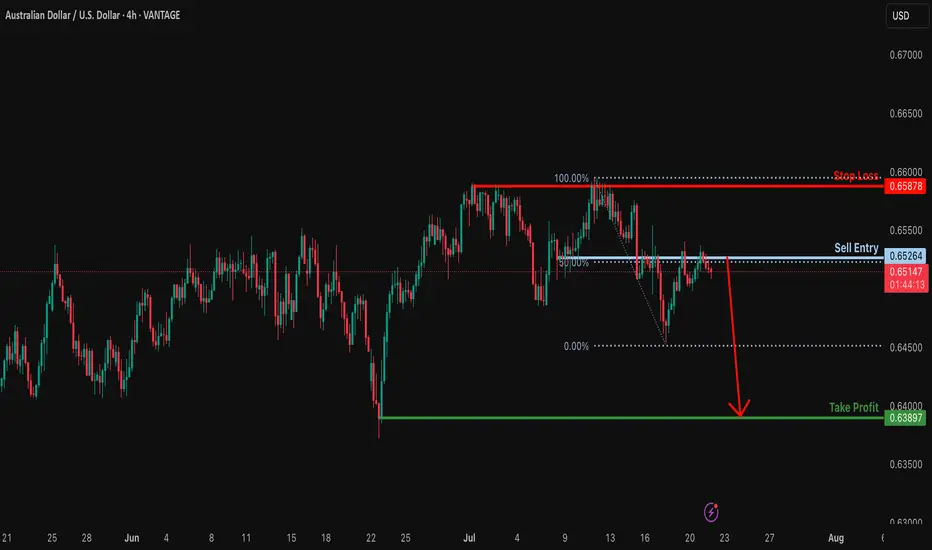
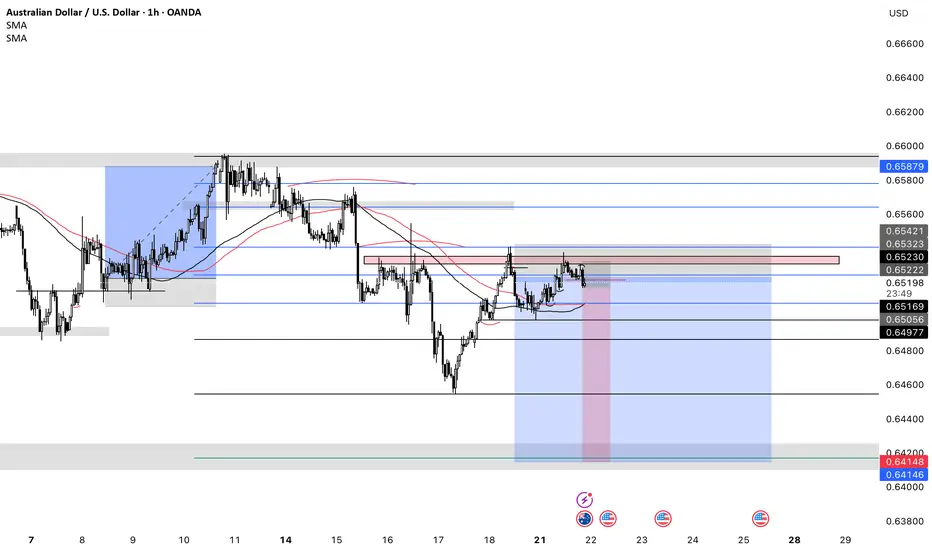
Could the Aussie drop from here?The price is reacting off the resistance level which is a pullback resistance that aligns with the 50% Fibonacci retracement and could drop from this level to our take profit.
Entry: 0.6526
Why we like it:
There is a pullback resistance that lines up with the 50% Fibonacci retracement.
Stop loss: 0.6587
Why we like it:
There is a multi swing high resistance.
Take profit: 0.6389
Why we like it:
There is a pullback support.
Enjoying your TradingView experience? Review us!
Please be advised that the information presented on TradingView is provided to Vantage (‘Vantage Global Limited’, ‘we’) by a third-party provider (‘Everest Fortune Group’). Please be reminded that you are solely responsible for the trading decisions on your account. There is a very high degree of risk involved in trading. Any information and/or content is intended entirely for research, educational and informational purposes only and does not constitute investment or consultation advice or investment strategy. The information is not tailored to the investment needs of any specific person and therefore does not involve a consideration of any of the investment objectives, financial situation or needs of any viewer that may receive it. Kindly also note that past performance is not a reliable indicator of future results. Actual results may differ materially from those anticipated in forward-looking or past performance statements. We assume no liability as to the accuracy or completeness of any of the information and/or content provided herein and the Company cannot be held responsible for any omission, mistake nor for any loss or damage including without limitation to any loss of profit which may arise from reliance on any information supplied by Everest Fortune Group.
Bearish reversal off 61.8% Fibonacci resistance?AUD/USD is rising towards the pivot and could reverse to the 1st support, which acts as a pullback support.
Pivot: 0.6543
1st Support: 0.6469
1st Resistance: 0.6590
Risk Warning:
Trading Forex and CFDs carries a high level of risk to your capital and you should only trade with money you can afford to lose. Trading Forex and CFDs may not be suitable for all investors, so please ensure that you fully understand the risks involved and seek independent advice if necessary.
Disclaimer:
The above opinions given constitute general market commentary, and do not constitute the opinion or advice of IC Markets or any form of personal or investment advice.
Any opinions, news, research, analyses, prices, other information, or links to third-party sites contained on this website are provided on an "as-is" basis, are intended only to be informative, is not an advice nor a recommendation, nor research, or a record of our trading prices, or an offer of, or solicitation for a transaction in any financial instrument and thus should not be treated as such. The information provided does not involve any specific investment objectives, financial situation and needs of any specific person who may receive it. Please be aware, that past performance is not a reliable indicator of future performance and/or results. Past Performance or Forward-looking scenarios based upon the reasonable beliefs of the third-party provider are not a guarantee of future performance. Actual results may differ materially from those anticipated in forward-looking or past performance statements. IC Markets makes no representation or warranty and assumes no liability as to the accuracy or completeness of the information provided, nor any loss arising from any investment based on a recommendation, forecast or any information supplied by any third-party.

AUDUSD Sells In sells based on H4 bearish structure. H4 Double top, 61.8% Daily Retracement & evening star pattern. Im aiming for the daily support of 0.64160.
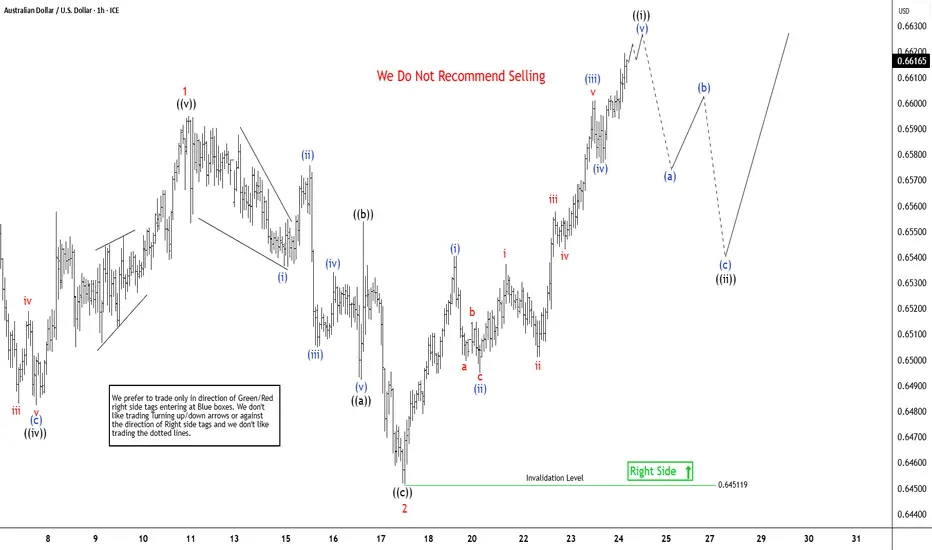
AUDUSD Elliott Wave Outlook: Impulse Pattern Approaching To EndThe AUDUSD pair is showing higher high from 4.09.2025 low, expecting rally to continue from 5.12.2025 low. It favors zigzag corrective bounce from April-2025 low & should continue rally against 0.6451 low. In daily, it started corrective bounce from 4.09.2025 low & may extend towards 0.6720 – 0.6955 area in next few weeks. Above 4.09.2025 low, it ended (A) at 0.6515 high of 5.06.2025, (B) at 0.6354 low of 5.12.2025 & favors upside in (C). Ideally, (C) can extend towards 0.6955 or higher levels, while pullback holds above 5.12.2025 low. Within (C), it placed 1 at 0.6595 high, 2 at 0.6451 low in corrective pullback & favors upside in 3. Within 1, it ended ((i)) at 0.6552 high, ((ii)) at 0.6369 low, ((iii)) at 0.6590 high, ((iv)) at 0.6451 low & ((v)) at 0.6595 high in overlapping diagonal. Below 1 high, it ended 2 in zigzag correction at extreme area before resume rally in 3.
It placed ((a)) of 2 at 0.6492 low in 5 swings, ((b)) at 0.6554 high & ((c)) at 0.6451 low in 5 swings. Wave 2 pullback ended at 0.618 Fibonacci retracement of 1. Within 3, it favors impulse in ((i)) started from 7.17.2025 low. It placed (i) of ((i)) at 0.6540 high, (ii) at 0.6495 low, (iii) at 0.6601 high, (iv) at 0.6576 low & favor upside in (v) targeting in to 0.6606 – 0.6637 area to finish it. It already reached minimum area, but can see more upside above 0.6593 low. Alternatively, the current move even can be (iii) of ((i)) followed by small pullback in (iv) & higher in (v). Later, it expects ((ii)) to correct in 3, 7 or 11 swings against 7.17.2025 low & find support from extreme area to continue rally. Wave 3 should extend in to 0.6692 – 0.6841 area in 5 swings before correcting in 4 of (C). We like to buy the pullback in 3, 7 or 11 swings at extreme area against 7.17.2025 low.
AUDUSD: Bearish Flag Retest Within Macro HeadwindsAUDUSD is developing a clean bearish technical setup just as macro fundamentals increasingly weigh on the Australian dollar. The pair recently completed a rising wedge breakout and is now retesting broken structure within a larger downtrend. With risk sentiment shaky due to U.S. tariff threats and dovish repricing of the RBA’s outlook, Aussie bulls may struggle to sustain momentum. A confirmed breakdown below 0.6458 could open the door toward June’s swing low near 0.6390.
🧠 Technical Breakdown:
✅ Bearish Flag Structure:
The chart shows a sequence of bearish flags and rising wedges, all of which have historically broken lower. The latest breakout to the downside was sharp, and the current rally appears corrective.
✅ Fib Levels & Confluence:
Price is hovering near the 38.2% retracement (0.6510) from the last leg down. The invalidation zone around 0.6565 aligns with a supply zone, making it an ideal SL area.
✅ Target Zones:
First support: 0.6458
Measured move: 0.6390 - 0.6370
These coincide with Fib 61.8% & 100%, adding technical confluence.
📉 Fundamental Drivers:
Dovish RBA Signals: Labour data missed expectations, and June inflation slowed (4.8% vs. 4.9% expected), softening the RBA’s hawkish stance.
Stronger USD Outlook: Powell’s reappointment risk and rate-cut delay pricing have supported the dollar. U.S. data (Retail Sales, CPI) still signal sticky inflation and strong labor.
Tariff Risk from Trump: With the U.S. floating global 10% tariffs, risk assets like AUD (a high-beta currency) face downside pressure.
⚠️ Risks to Bearish Bias:
Stronger-than-expected China stimulus could support AUD as a proxy.
A dovish Fed pivot or soft U.S. data might undercut USD strength.