AUDUSD trade ideas
Buy Aud from pivoton the 1D chart there is some uptrend
on 1H and 4H chart price is testing the pivot line for support
if the support will be strong anought could be good RR
AUDUSD InsightWelcome to all our subscribers!
Please share your personal opinions in the comments. Don't forget to like and subscribe!
Key Points
- Former U.S. Treasury Secretary Scott Bessent stated regarding Fed Chair Powell, “There is nothing that would make me say he should step down immediately,” — a remark that stands in contrast to previous comments made by former President Trump and his close aides.
- On U.S.-China trade negotiations, Secretary Bessent mentioned, “We will meet with Chinese officials in Stockholm on Monday and Tuesday to discuss extending the trade truce deadline.”
- Goldman Sachs has projected the U.S. growth rate this year at 1.1%. In a report, Jan Hatzius, Chief Economist at Goldman Sachs, estimated the probability of a U.S. recession at 30%, which is double the normal level.
Major Economic Events This Week
+ July 24: ECB Interest Rate Decision
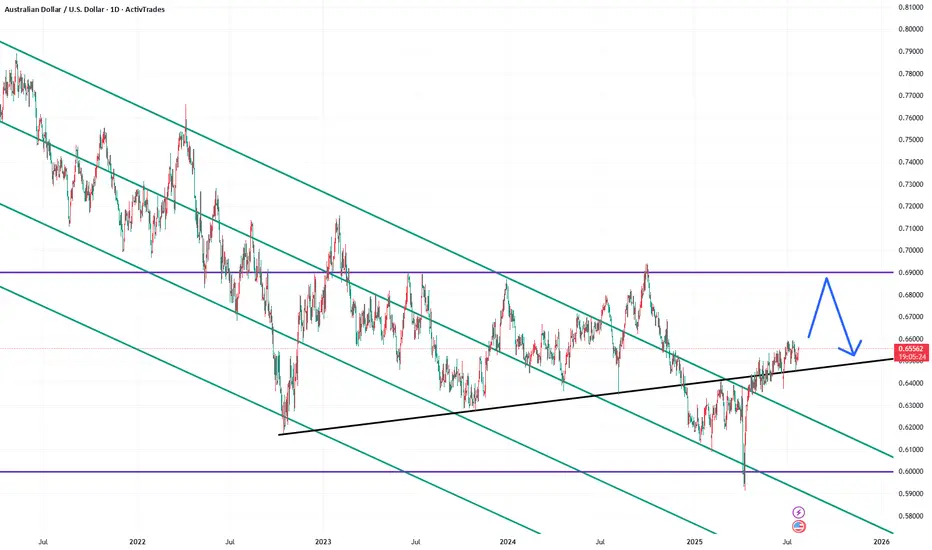
AUDUSD Chart Analysis
The pair continues a gentle upward trend within its channel. As previously anticipated, a long-term rise toward the 0.69000 level is expected. However, resistance is still observed around the 0.66000 level. A breakout above this zone could lead to a swift rise toward 0.67000. Still, there is minor resistance near 0.67000, which may temporarily limit upward momentum. A slight pullback may occur before another upward move resumes.
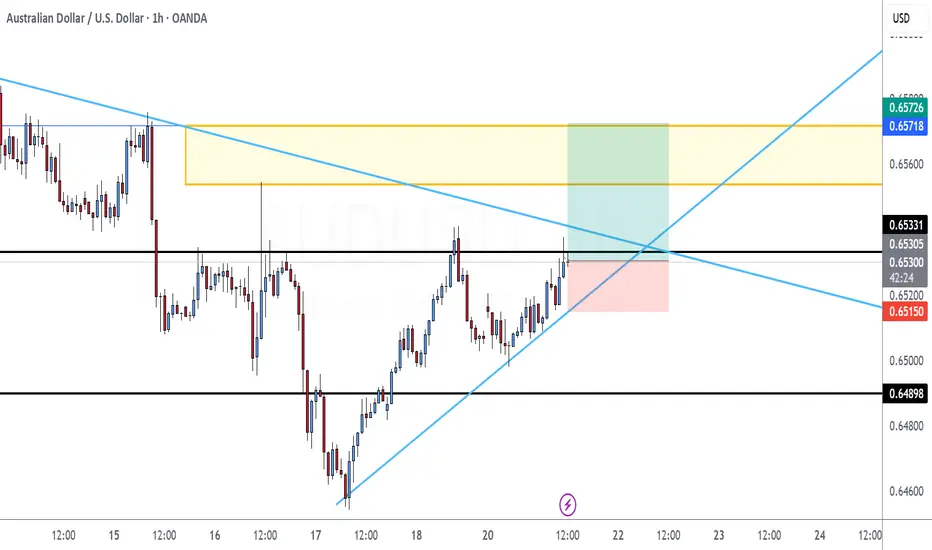
AUDUSD Ready to enter Buy?✅ **Market & Timeframe:**
AUD/USD, 1‑hour chart.
✅ **Overall Bias (multi‑timeframe):**
* Weekly: Bullish
* Daily: Bearish
* 12H: Bullish
* 6H: Bullish
* 4H: Bullish
➡️ **≈ 80% Bullish bias overall.**
✅ **Pattern & Structure:**
You’ve clearly highlighted an **Inverse Head and Shoulders**:
* Left Shoulder near 0.6520
* Head near 0.6500
* Right Shoulder near 0.6525
Price has broken above the neckline (\~0.6540 area).
✅ **Key Levels:**
* **Daily AOI (Area of Interest):** 0.6537–0.6541
(price currently above, expected to retest this zone)
* **Next upside target:** 0.6588–0.6590
* **Major support:** Lower Daily AOI around 0.6466–0.6490
✅ **Moving Averages:**
* Blue MA (shorter) is above red MA (longer) – showing upward momentum.
✅ **Price Action Plan (illustrated by your arrows):**
1. Price has just broken out above the neckline.
2. Expecting a **retest back into Daily AOI (\~0.6540)**.
3. Looking for bullish confirmation there (e.g., bullish candlestick pattern) to enter **long**.
4. Targeting the resistance zone around **0.6588–0.6590**.
---
📌 **Summary:**
Your chart signals an **80% bullish setup**.
✅ Inverse head & shoulders → breakout above neckline.
✅ Wait for price to pull back into Daily AOI (0.6537–0.6541).
✅ Look for bullish confirmation → then enter long.
🎯 Target: \~0.6588–0.6590.

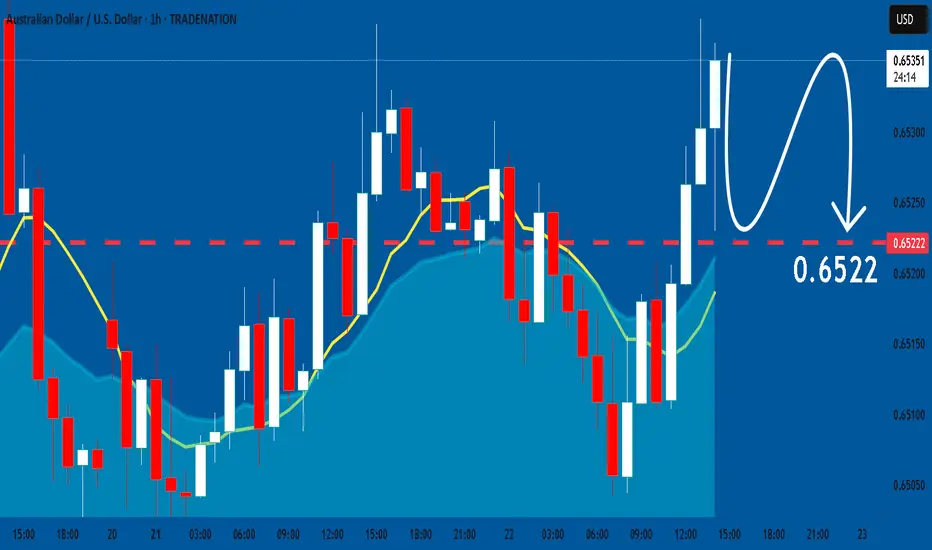
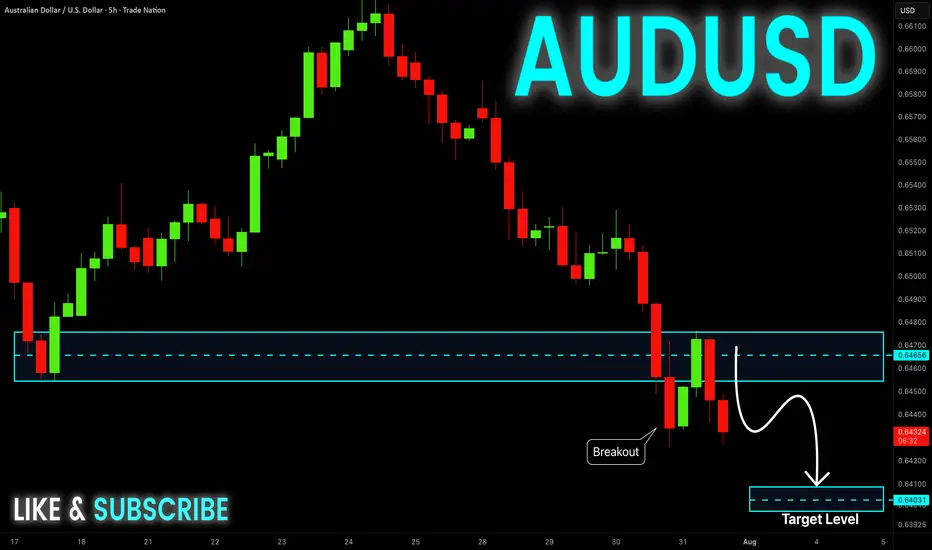
AUDUSD: Bearish Continuation is Highly Probable! Here is Why:
The charts are full of distraction, disturbance and are a graveyard of fear and greed which shall not cloud our judgement on the current state of affairs in the AUDUSD pair price action which suggests a high likelihood of a coming move down.
Disclosure: I am part of Trade Nation's Influencer program and receive a monthly fee for using their TradingView charts in my analysis.
❤️ Please, support our work with like & comment! ❤️
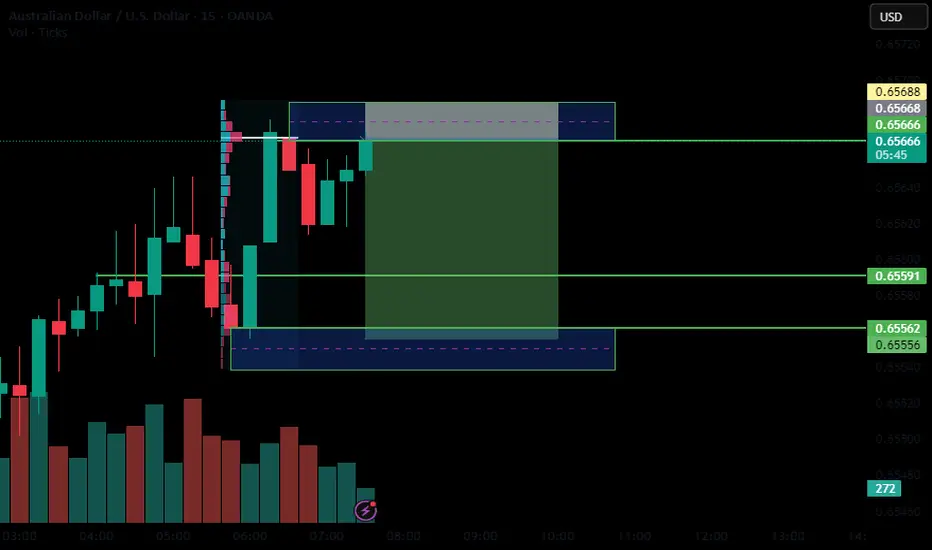
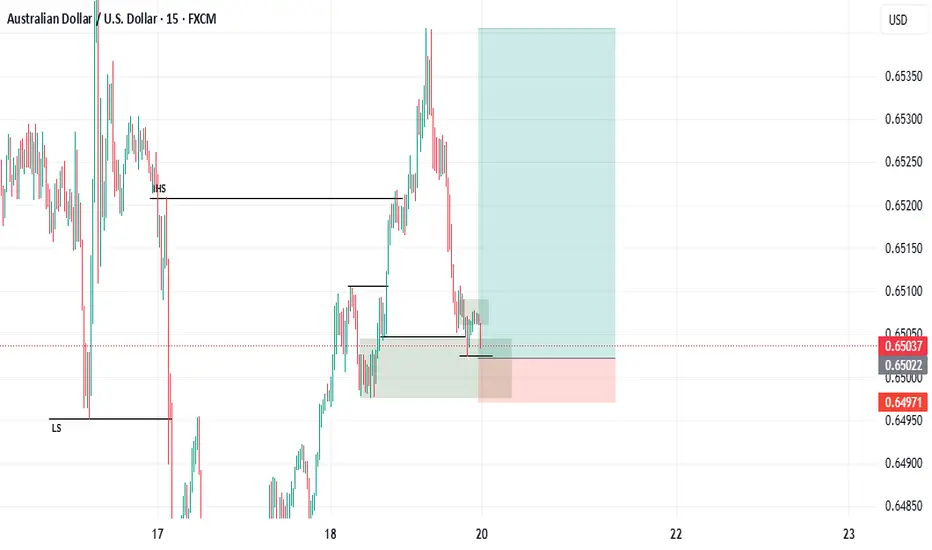
AUD/USD – 15m Demand📊 Trade Breakdown:
Pair: AUD/USD
Timeframe: 15 Minute
Bias: Bullish
Type: Demand Zone Rejection
Entry: 0.65264
Stop Loss: 0.65186
Take Profit: 0.65570
Risk-to-Reward: ~3R
⸻
📌 Key Confluences:
• Clean 15m demand zone formed after a sharp impulse move
• Strong bullish engulfing candle from demand
• Liquidity sweep to the left prior to demand forming
• Structure shift with higher highs and higher lows
• Previous resistance flipped to support at entry zone
• AUD strength showing on intraday sentiment across multiple pairs
⸻
⚙️ Trade Setup:
Entered long after price tapped into the refined 15m demand zone and printed a bullish rejection wick. SL placed just below the zone to avoid noise. TP set near a prior 15m supply area / liquidity sweep zone.
I’m watching for continuation on the next 15m-1h candle closures. If price breaks above 0.6544, expecting follow-through to 0.6557+.
⸻
🧠 Mindset:
Stayed patient waiting for price to come to me. No FOMO. Clear invalidation and clean R:R. Confidence in the setup due to structure, confluences, and reaction off the zone. Trusting the process and letting the trade breathe.
Trade Simple, Live Lavish

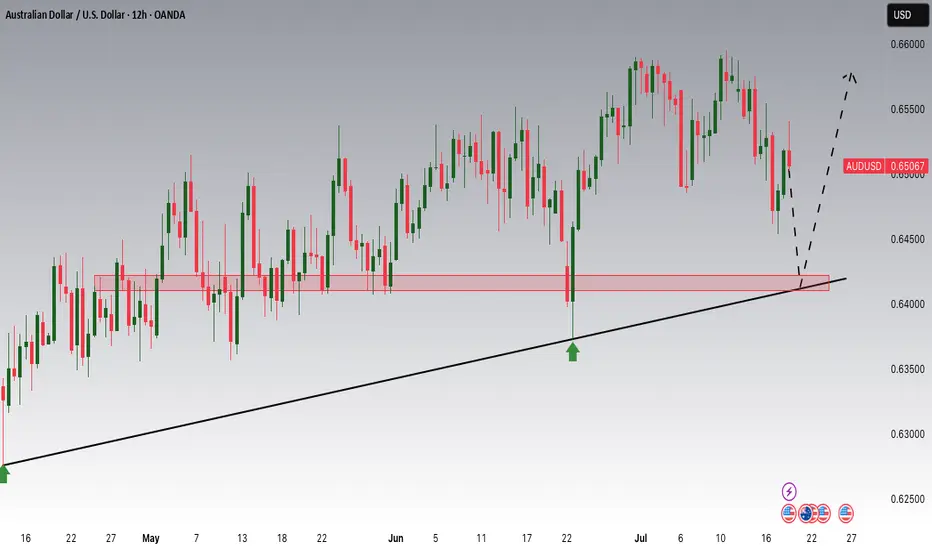
AUDUSD Potential UpsidesHey Traders, in tomorrow's trading session we are monitoring AUDUSD for a buying opportunity around 0.64200 zone, AUDUSD is trading in an uptrend and currently is in a correction phase in which it is approaching the trend at 0.64200 support and resistance area.
Trade safe, Joe.
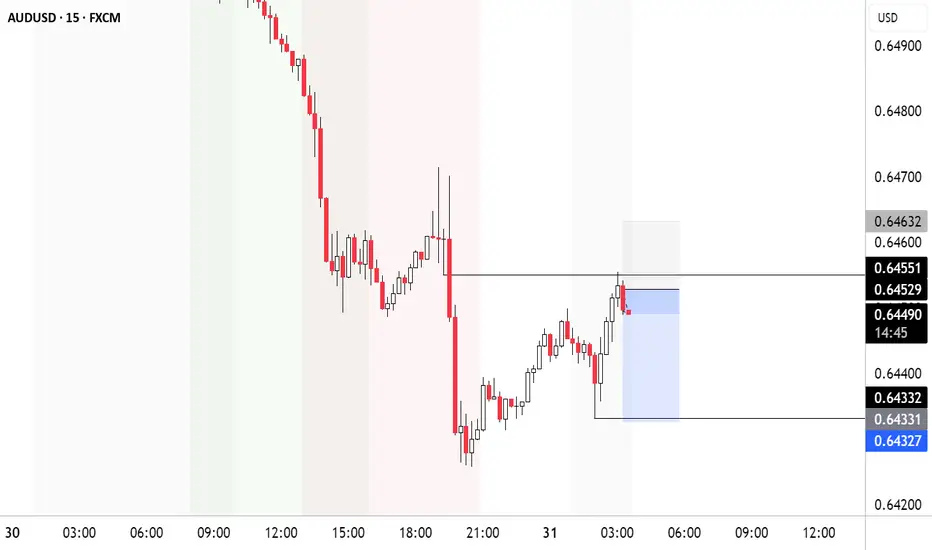
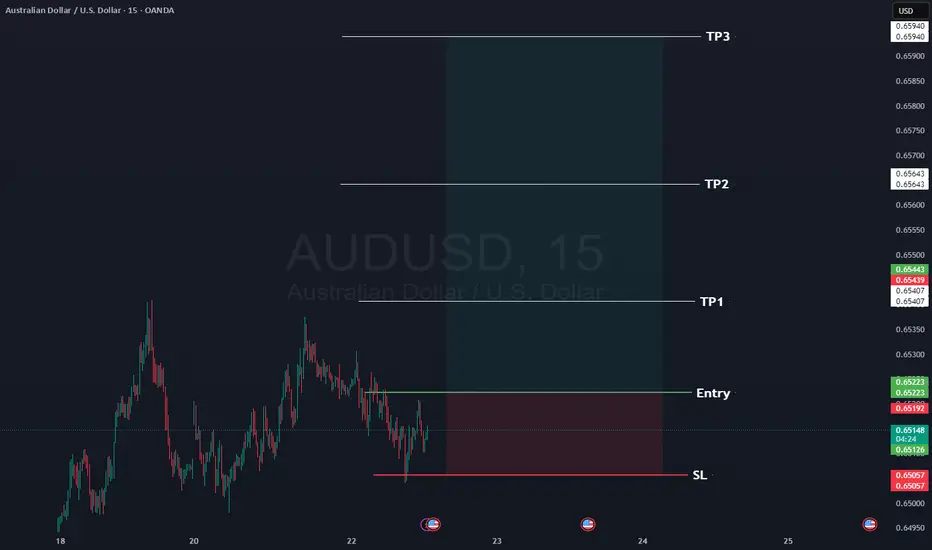
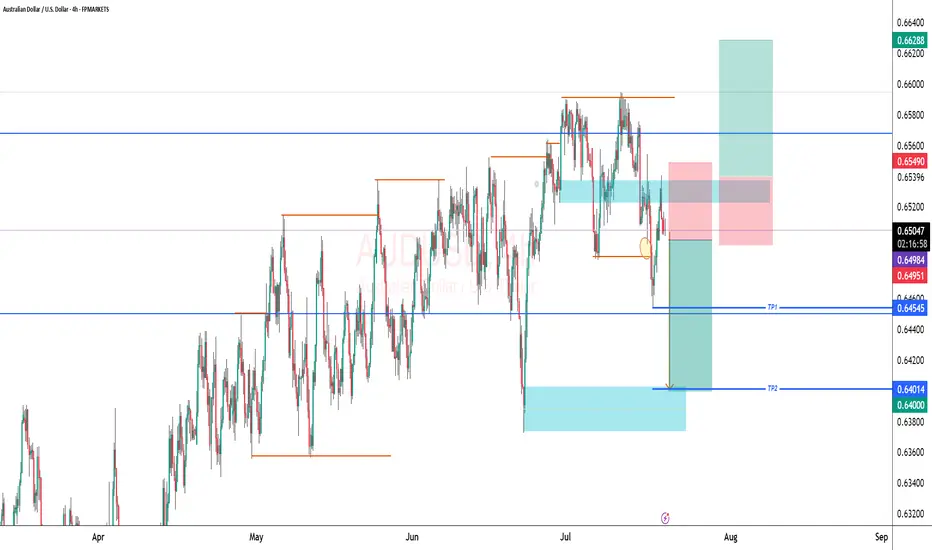
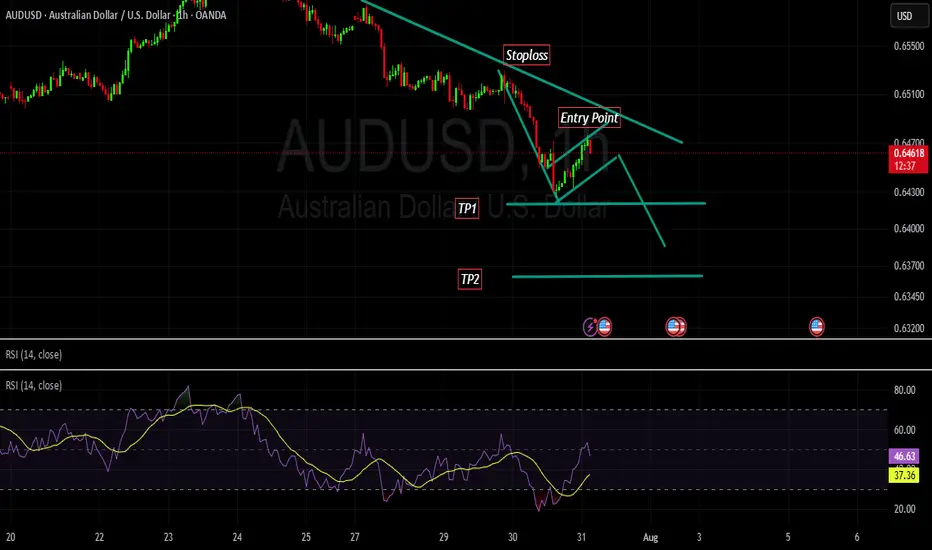
AUDUSD Here is our signal for AUDUSD
Occasionally we give a free signal, so here's AUDUSD long.
Rules:
1- Wait for the 15 minute to close with momentum above the entry, ideally we want a re-test of the entry.
2- at TP1 move your SL to entry.
3- If you want to close at TP2 then do so.
📊Entry: 0.65223
⚠️SL: 0.65057
✔️TP1: 0.65407
✔️TP2: 0.65643
✔️TP3: 0.65940
Happy Trading,
Sarah
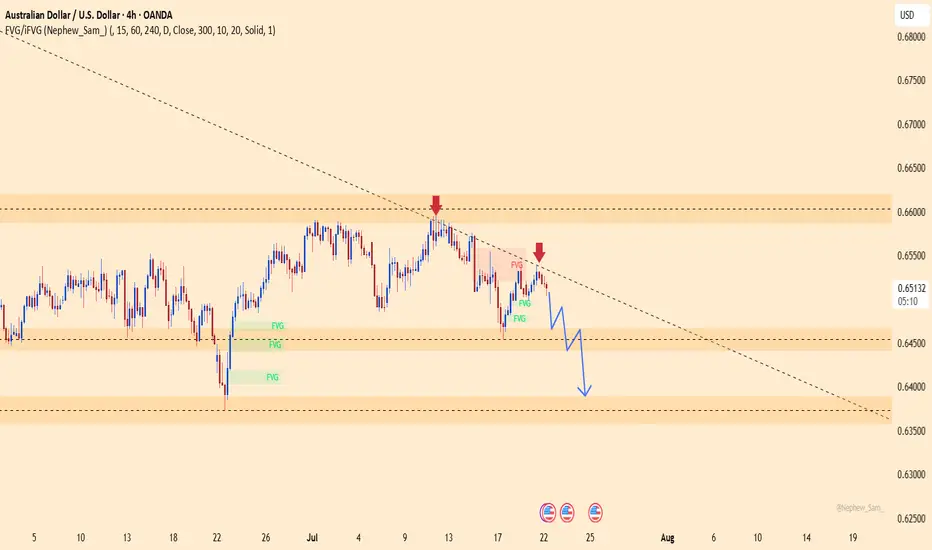
AUDUSD – Sellers taking over, the drop is on!This pair just got slapped hard at the descending trendline, right as it hit a familiar resistance zone. No more doubts – buyers are losing steam, and sellers are waiting to strike.
Market sentiment from Down Under is shaking, with weak economic signals piling up. Meanwhile, the mighty U.S. dollar is reclaiming the spotlight after gold’s flashy surge. The tide has turned!
Unless a miracle shows up, AUDUSD is set to dive deeper – and this is the perfect stage for traders who thrive on strong downtrends.
Sellers are in position – are you ready to join the ride?
I'm looking for potential buy setups after a consolidation.Those who are passionate about trading know that this is a tough business. What you have to understand is that the predictions people are making regarding the price movement directions are based on probabilities. There is no such thing as 100 percent direction in the market, and that is because the market can turn against you or your direction at any time it wants. The reason doesn't even matter; it could be the news of some geopolitical changes, oil cut production or war, or many other factors that could impact the financial market. If you have one or more good reasons that the price will follow a certain direction, all you have to do is take a small risk entry in your direction with a good risk-to-reward ratio and just wait and see how the market will perform. A trader could have 1 good reason or a few reasons why his bias is up or down. The reasons could be based on particular studies, past behavior, fundamentals, technical analysis, or certain observations. The important part for you to understand is that the market is in a continuously changing process; this means that yesterday's prediction, today, could be irrelevant. The market does not have to follow your analysis. You have to follow the market, observe its changes, and react accordingly to them! I hope some of you will find this helpful. Good luck!

AUDUSD BullishLooking at the chart displayed. I am looking for this bullish move to possibly happen.
Buy idea!Hello everyone. as you see market returned from middle of nowhere and we need an LFT zone. Lets go up. BE happy and have a wealthy life(wink)
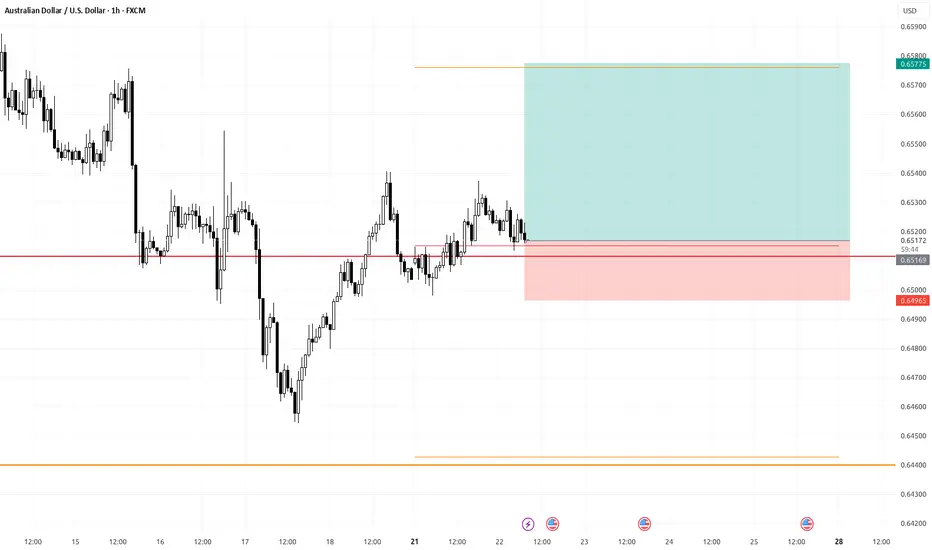
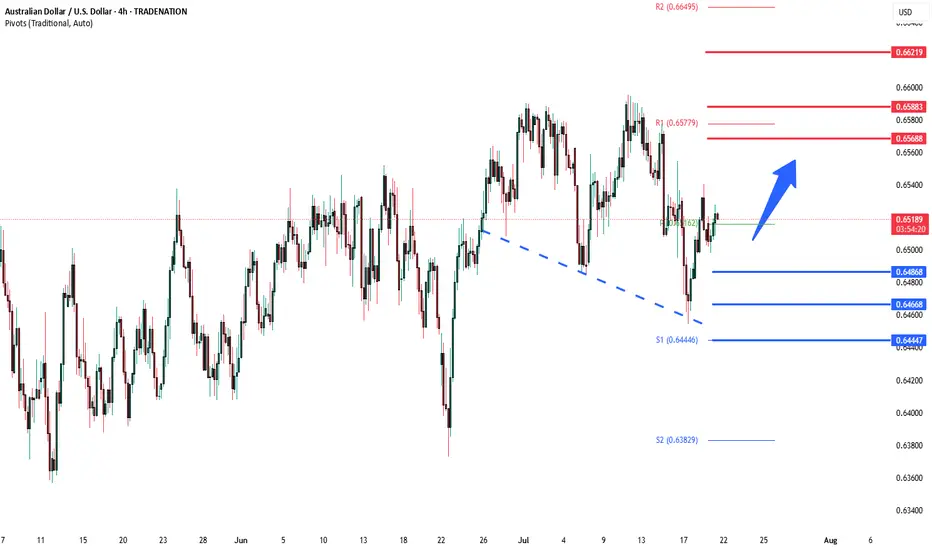
AUDUSD important support at 0.6465Trend Overview:
The AUDUSD currency price remains in a bullish trend, characterised by higher highs and higher lows. The recent intraday price action is forming a continuation consolidation pattern, suggesting a potential pause before a renewed move higher.
Key Technical Levels:
Support: 0.6465 (primary pivot), followed by 0.6445 and 0.6400
Resistance: 0.6570 (initial), then 0.6590 and 0.6625
Technical Outlook:
A pullback to the 0.6465 level, which aligns with the previous consolidation zone, could act as a platform for renewed buying interest. A confirmed bounce from this support may trigger a continuation toward the next resistance levels at 0.6570, 0.6590, and ultimately 0.6625.
Conversely, a daily close below 0.6465 would suggest weakening bullish momentum. This scenario would shift the bias to bearish in the short term, potentially targeting 0.6445 and 0.6400 as downside levels.
Conclusion:
AUDUSD maintains a bullish structure while trading above the 0.6465 support. A bounce from this level would validate the consolidation as a continuation pattern, with upside potential toward the 0.6570 area. A breakdown below 0.6465, however, would invalidate this view and suggest deeper corrective risk.
This communication is for informational purposes only and should not be viewed as any form of recommendation as to a particular course of action or as investment advice. It is not intended as an offer or solicitation for the purchase or sale of any financial instrument or as an official confirmation of any transaction. Opinions, estimates and assumptions expressed herein are made as of the date of this communication and are subject to change without notice. This communication has been prepared based upon information, including market prices, data and other information, believed to be reliable; however, Trade Nation does not warrant its completeness or accuracy. All market prices and market data contained in or attached to this communication are indicative and subject to change without notice.
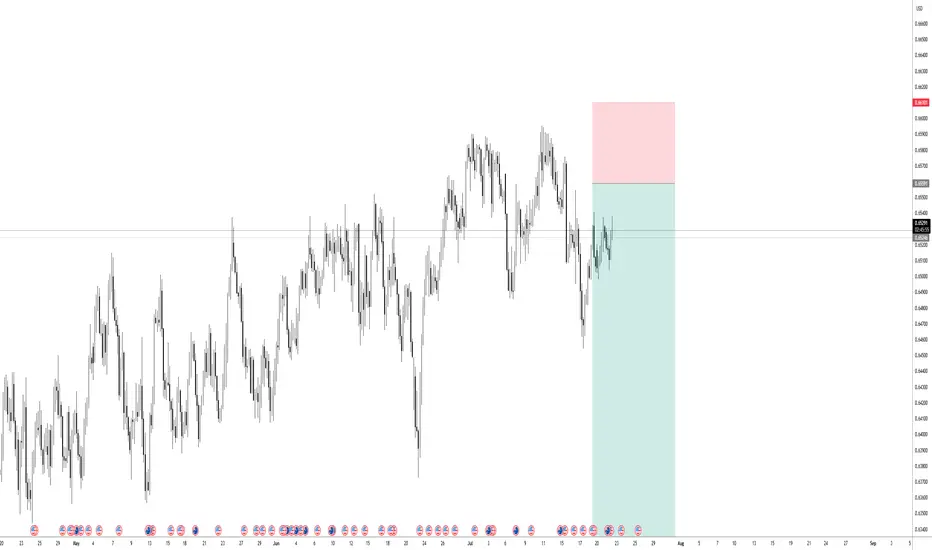
LOOKING FOR SHORTS ON AUD/USDWith Weekly time frame showing a strong downtrend then it is expected that lower timeframe aligns with it andso the Daily and 4HR are showing exactly that .
Double top formed and price trading in the area of our fib GOLDEN ZONE, We are expecting a decline in AUD potentially this upcoming week
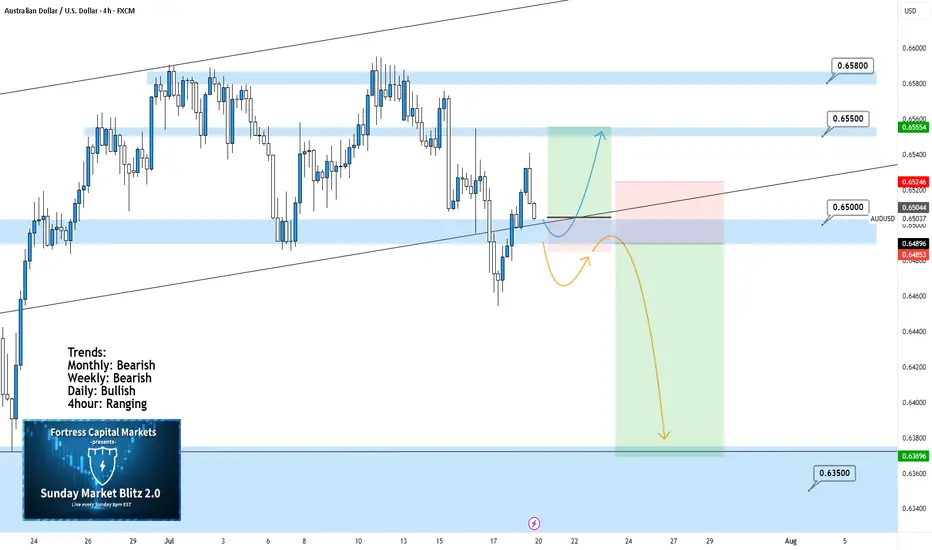
AUDUSD 4Hour TF - July 20th, 2025AUDUSD 7/20/2025
AUDUSD 4hour Neutral idea
Monthly - Bearish
Weekly - Bearish
Dailly - Bullish
4hour - Ranging
We’re looking at a fairly large range here on AU and although the higher timeframe suggests a potential bearish move, I am unsure until we have some clarity around 0.65000. Here are two scenarios that break down what could happen this week and how 0.65000 plays into it:
Range Continuation - Since late June we have seen price action establish this large range and stick to it (0.65800 Resistance & 0.65000 Support).
Currently, we can see price action attempting to break 0.65000 support but it has not done so yet. If we don’t break below 0.65000 early this week it is very likely we will see a rally into the top of the range.
Bearish Breakout - This is the setup we want to see play out this week as it presents a beauty of a trade.
For us to see AU as bearish on the 4hour we need to see a clear break below 0.65000 with a confirmed lower high below. If this happens look to target toward major support levels like 0.63500 area.
AUD/USDAUD/USD – Possible Correction Scenario Based on Volume Analysis
This idea presents a potential correction in AUD/USD, based on recent volume behavior suggesting a shift in market sentiment.
Following a strong move, volume has started to decline near the recent lows, hinting at possible seller exhaustion. This may open the path for a short-term bullish correction toward higher value areas.
📍 Entry: 0.64681
🎯 Target: 0.65050
🛑 Stop-loss: 0.64428
This is a possible scenario, not a guaranteed outcome. Always monitor price action and volume for confirmation.
Disclaimer: This analysis is for educational purposes only and does not constitute financial advice. Always do your own research and manage risk appropriately.
Ask ChatGPT

AUD-USD Will Go Down! Sell!
Hello,Traders!
AUD-USD is trading in a
Downtrend and the pair
Broke the key horizontal
Level of 0.6470 which is
Now a resistance then
Made a retest and a
Confident pullback which
Reinforces our bearish
Bias and makes us expect
A further bearish move down
Sell!
Comment and subscribe to help us grow!
Check out other forecasts below too!
Disclosure: I am part of Trade Nation's Influencer program and receive a monthly fee for using their TradingView charts in my analysis.
AUDUSD Outlook – From Bias to Execution Previous day closed bearish, leading to a sell bias, On the 1H, I then identified a familiar price action pattern, a rising wedge breakdown.
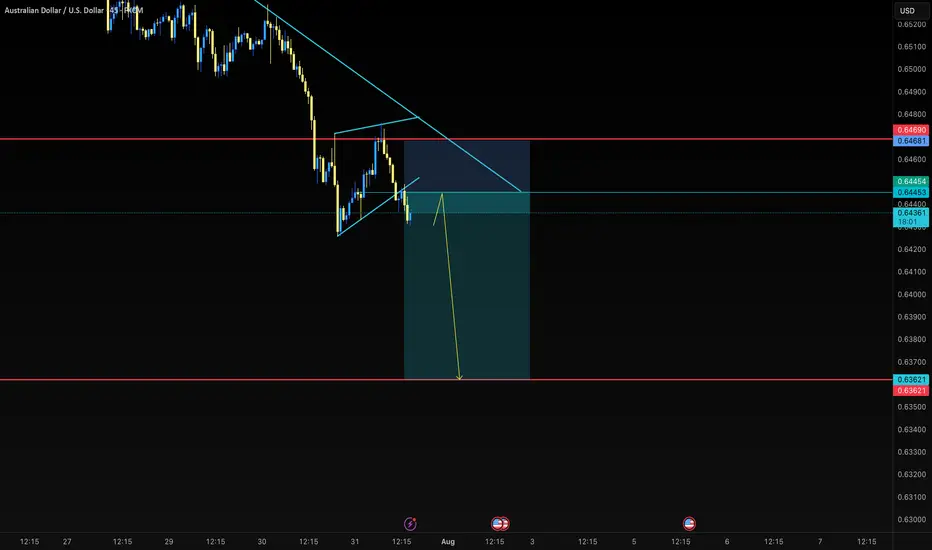
Aussie H4 | Bearish reversal off pullback resistanceBased on the H4 chart analysis, we can see that the price is reacting off the sell entry, which acts as a pullback resistance that aligns with the 23.6% Fibonacci retracement and could drop lower from this level.
Sell entry is at 0.6467, which is a pullback resistance that lines up with the 23.6% Fibonacci retracement.
Stop loss is at 0.6525, which is a pullback resistance that aligns with the 50% Fibonacci retracement.
Take profit is at 0.6389, which is a swing low support that aligns with the 138.2% Fibonacci extension.
High Risk Investment Warning
Trading Forex/CFDs on margin carries a high level of risk and may not be suitable for all investors. Leverage can work against you.
Stratos Markets Limited (tradu.com ):
CFDs are complex instruments and come with a high risk of losing money rapidly due to leverage. 65% of retail investor accounts lose money when trading CFDs with this provider. You should consider whether you understand how CFDs work and whether you can afford to take the high risk of losing your money.
Stratos Europe Ltd (tradu.com ):
CFDs are complex instruments and come with a high risk of losing money rapidly due to leverage. 66% of retail investor accounts lose money when trading CFDs with this provider. You should consider whether you understand how CFDs work and whether you can afford to take the high risk of losing your money.
Stratos Global LLC (tradu.com ):
Losses can exceed deposits.
Please be advised that the information presented on TradingView is provided to Tradu (‘Company’, ‘we’) by a third-party provider (‘TFA Global Pte Ltd’). Please be reminded that you are solely responsible for the trading decisions on your account. There is a very high degree of risk involved in trading. Any information and/or content is intended entirely for research, educational and informational purposes only and does not constitute investment or consultation advice or investment strategy. The information is not tailored to the investment needs of any specific person and therefore does not involve a consideration of any of the investment objectives, financial situation or needs of any viewer that may receive it. Kindly also note that past performance is not a reliable indicator of future results. Actual results may differ materially from those anticipated in forward-looking or past performance statements. We assume no liability as to the accuracy or completeness of any of the information and/or content provided herein and the Company cannot be held responsible for any omission, mistake nor for any loss or damage including without limitation to any loss of profit which may arise from reliance on any information supplied by TFA Global Pte Ltd.
The speaker(s) is neither an employee, agent nor representative of Tradu and is therefore acting independently. The opinions given are their own, constitute general market commentary, and do not constitute the opinion or advice of Tradu or any form of personal or investment advice. Tradu neither endorses nor guarantees offerings of third-party speakers, nor is Tradu responsible for the content, veracity or opinions of third-party speakers, presenters or participants.

AUDUSD - Sell Setup market is in bear trend with a series of LH and LL. currently market has retraced to a fib level of 0.5% which and continuing bear trend. there is no divergence and market is making a bearish channel with a bearish flag pattern intact.
we instantly enter into the market with our SL level above last LH and TPs as projected.
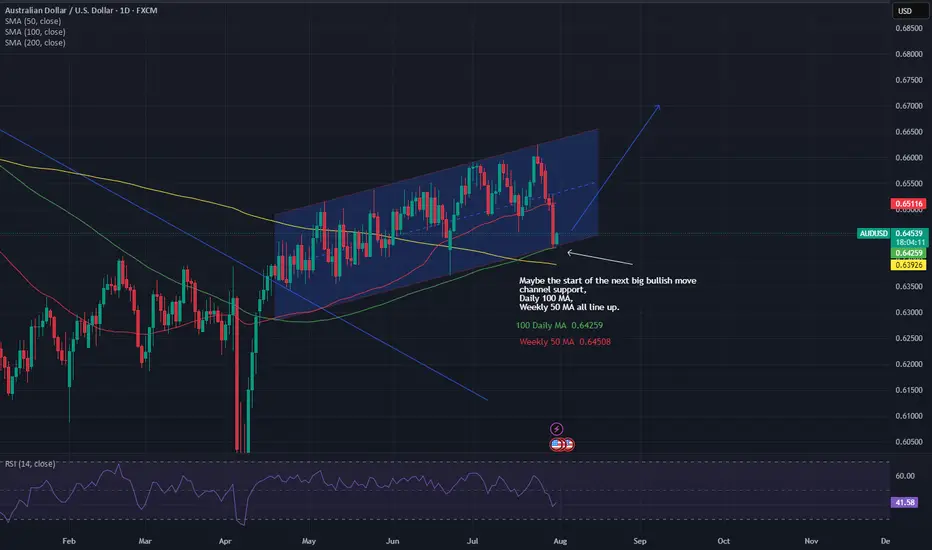
Could the next big AUD/USD Bullish up leg be readySimilar to NZD/USD look for the next big bullish up leg to start with channel support, Weekly 50 MA, Daily 100 Ma all lining up.
AU ASIA SESSIONI'm currently watching the sell-side liquidity to see if price makes a move in that direction. Given the current structure and momentum, this setup looks like a relatively low-risk opportunity heading into the Asia session. It’s not a guaranteed play, but the risk-to-reward looks favorable if we get confirmation. Let me know what you think about this one — always keen to hear a second perspective.