AUDUSD trade ideas
AUD/USD part 2.my trading journal continued.
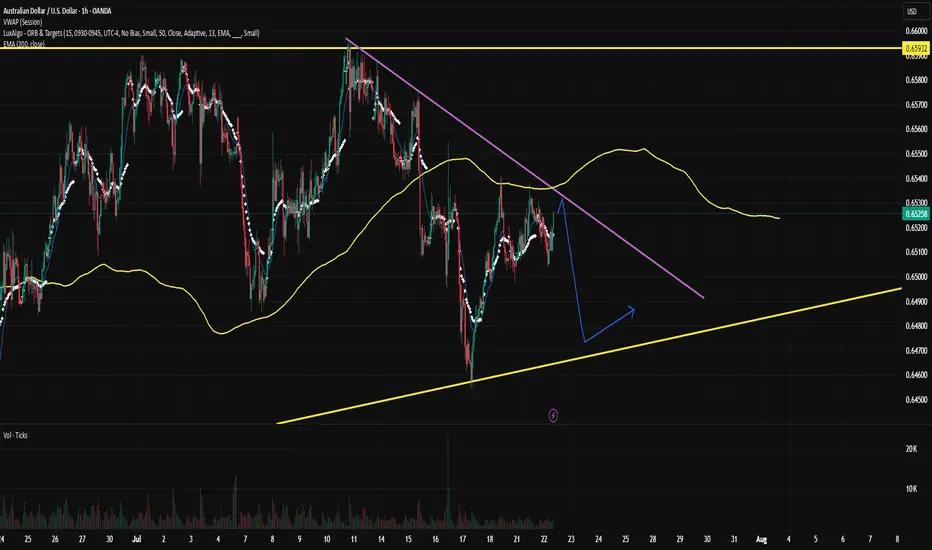
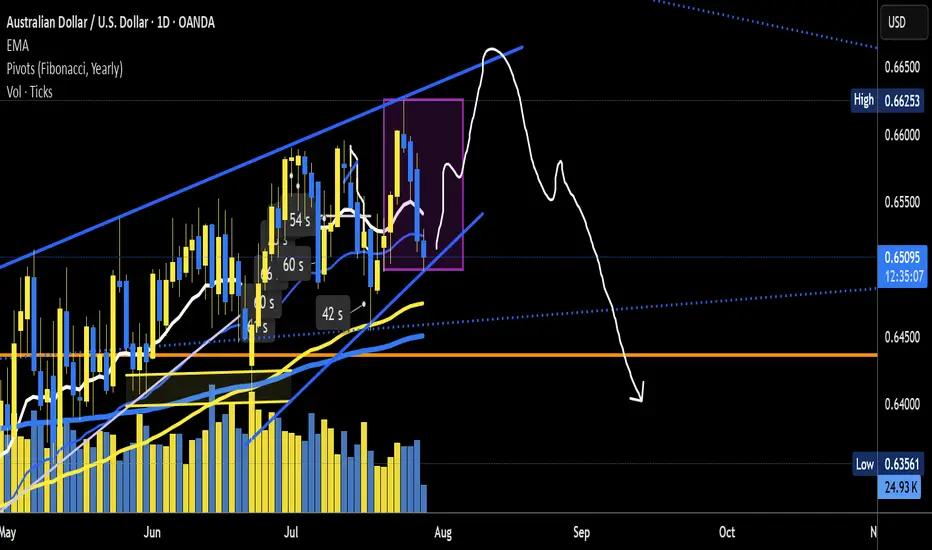
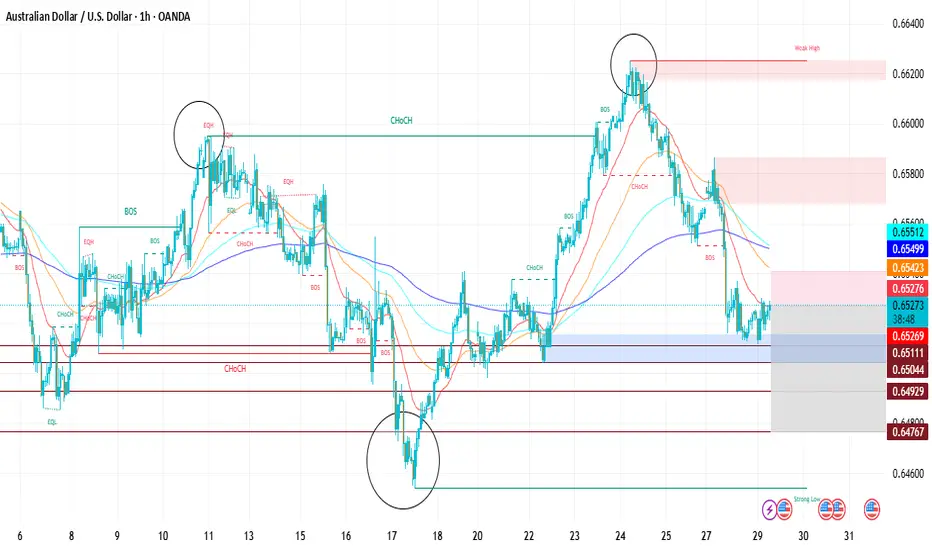
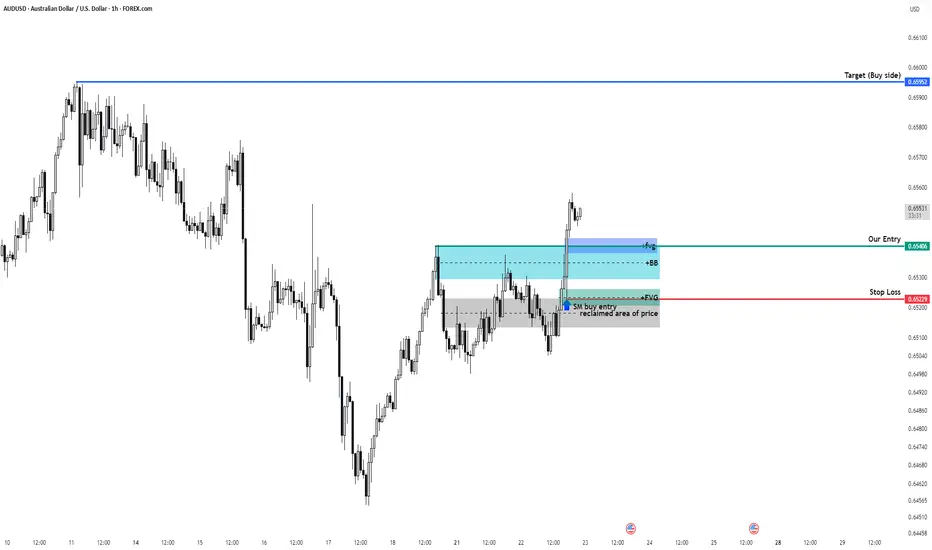
trend line of ascending triangle bottom appears to be holding. Road map still valid. looking for a entry point at end of 1 hour chart for leg up before a major downward move. (2 potential trades on the table).
remember today some big news out of US today. i final spike down on 5 minute is on the cards.

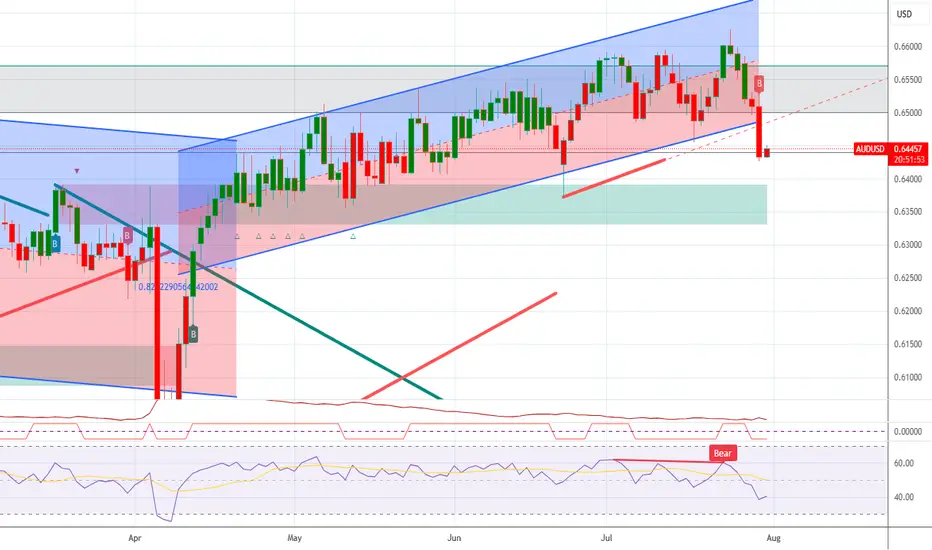
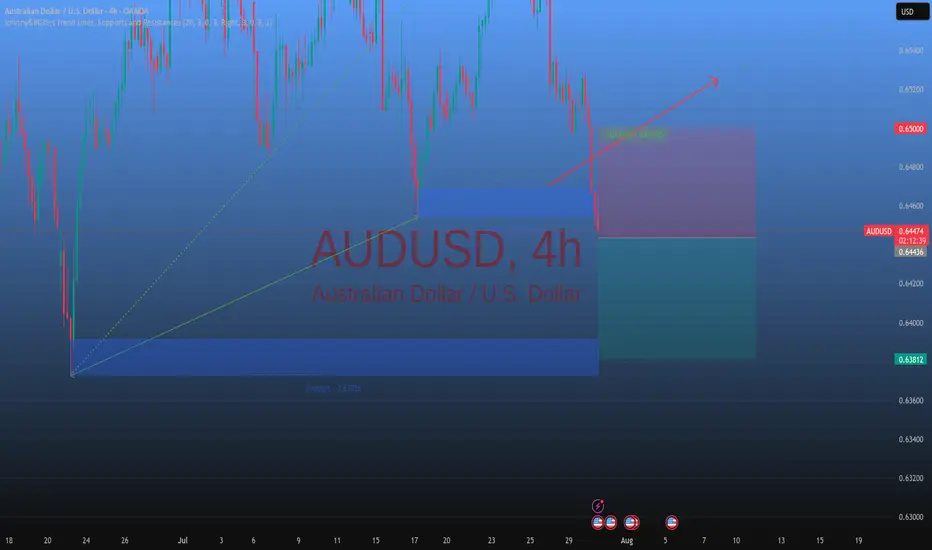
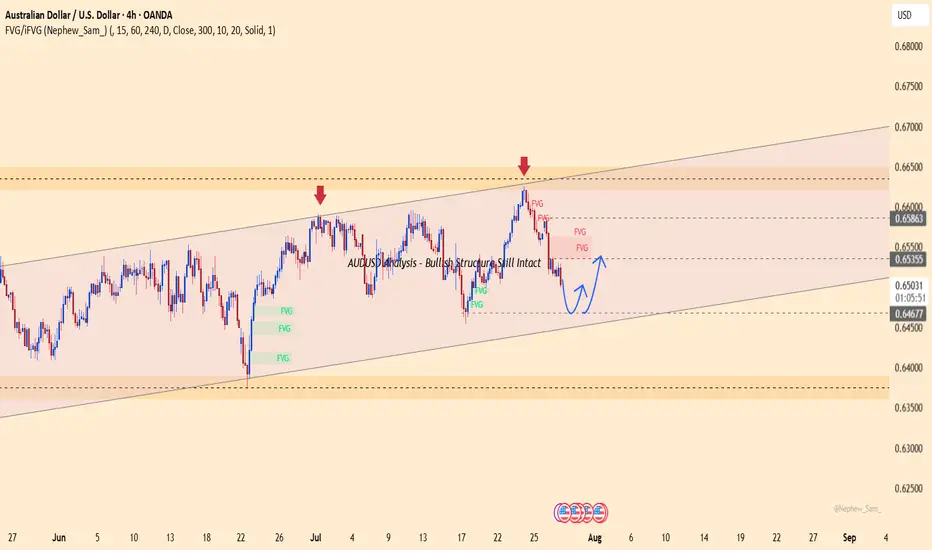
AUDUSD Analysis – Bullish Structure Still IntactAUDUSD is trading within a clear ascending channel on the H4 chart. After dropping from the FVG zone around 0.65800, price has reacted well to the lower boundary support near 0.64650.
Currently, price action suggests the potential formation of a short-term bottom. If this level holds and the pair rebounds, the next target could be the red FVG zone near 0.65400.
Recent Supporting News:
U.S. consumer confidence slightly weakened, causing the dollar to cool off — offering technical rebound support for AUD.
Trading Strategy:
Prefer short-term Buys near 0.64650 if a confirmed bounce appears, with target around 0.65400. Be cautious if price breaks below the ascending channel.
Do you think AUD will continue to rise within this bullish channel?
Daily AnalysisWe continue following our trade setup from Monday and looked into valid entries for the day

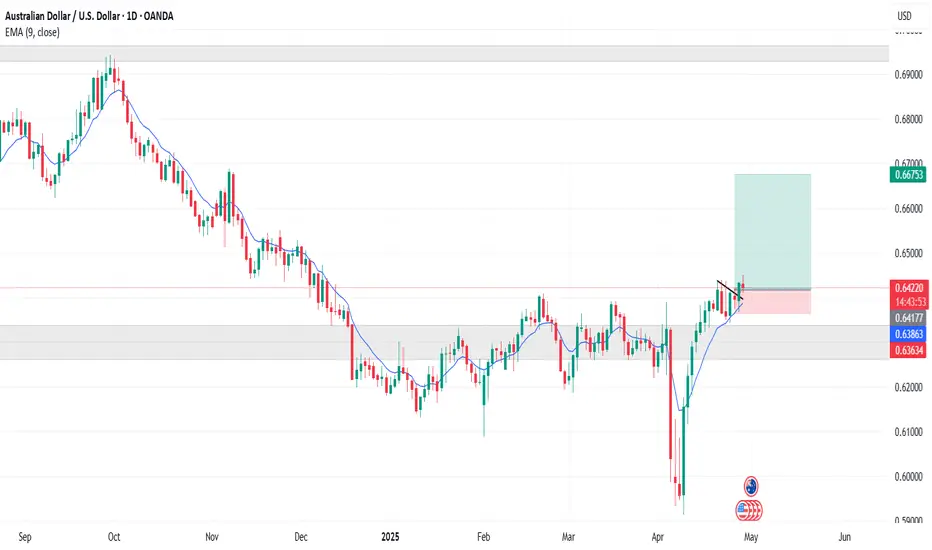
AUDUSD - BullishAUDUSD is Bullish on Fundamental Bias and Seasonal aslo support long position. Divergence can also be observed on RSI. Forming an Harmonic pattern so it looks like buyers are in a strong position
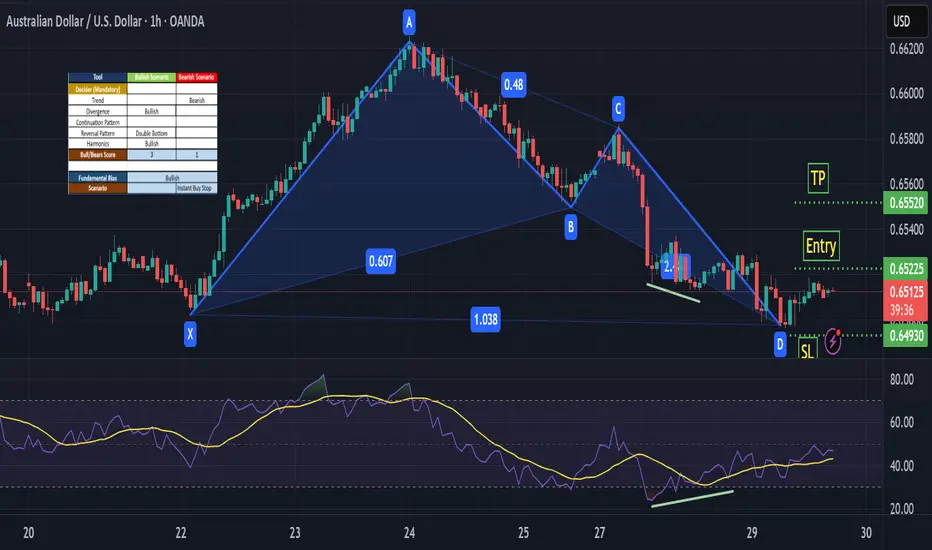
About to Buy AUDUSD waiting for retracementAfter retracing, put stop below wick and only buy if the candle closes
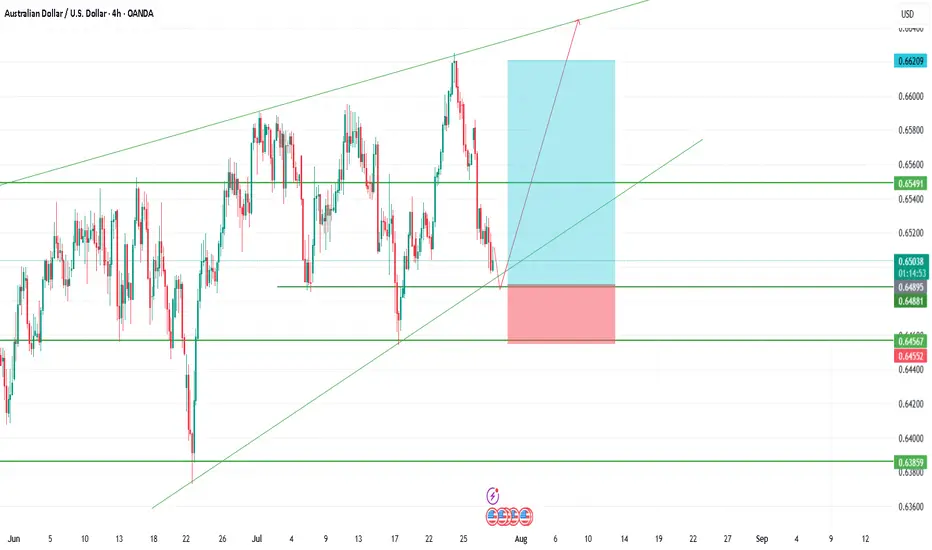
AUD/USD another leg up before down anticipatedroad map plotted. just entered bullish trade for a small leg up. SL to be moved to breakeven. anticipating a generous leg ABC leg down anytime as approaching upper blue trendline forming a ascending triangle. keep an eye out for refersal signals
daily outlook 7-29-25daily outlook 7-29-25 = in this outlook i show my friends what i am gonna trade for today.

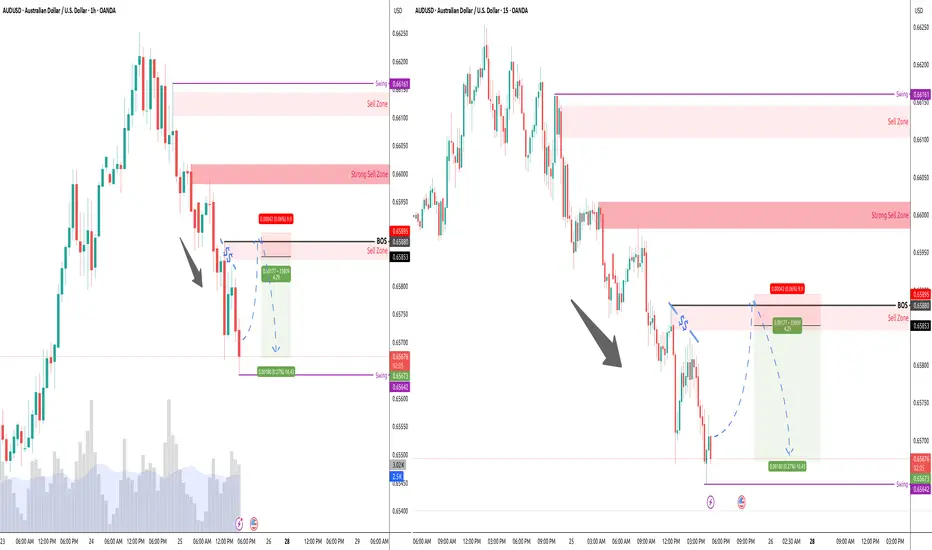
Trade Setup: AUDUSD – Short Opportunity Identified A fresh sel Trade Setup: AUDUSD – Short Opportunity Identified
A fresh sell opportunity on AUDUSD has been spotted, backed by bearish market structure, technical resistance, and macroeconomic sentiment favoring a downside move. AUDUSD is currently trading near a key resistance zone around 0.65250, where the price has previously failed to break higher.
The market has shown repeated rejections near this level, indicating potential for a bearish reversal.
The entry at 0.65239 is strategically positioned just below resistance, allowing traders to catch the move early before momentum builds.
The first target at 0.65150 is a short-term intraday support level and offers a quick, low-risk profit opportunity.
The second target of 0.65000 is a psychologically important level and a common magnet for price action in downward trends.
The third target at 0.64890 aligns with a previous swing low, making it a strong candidate for extended profit-taking if momentum continues.
The stop loss at 0.65340 is placed above the resistance and recent high to minimize losses while giving the trade enough room
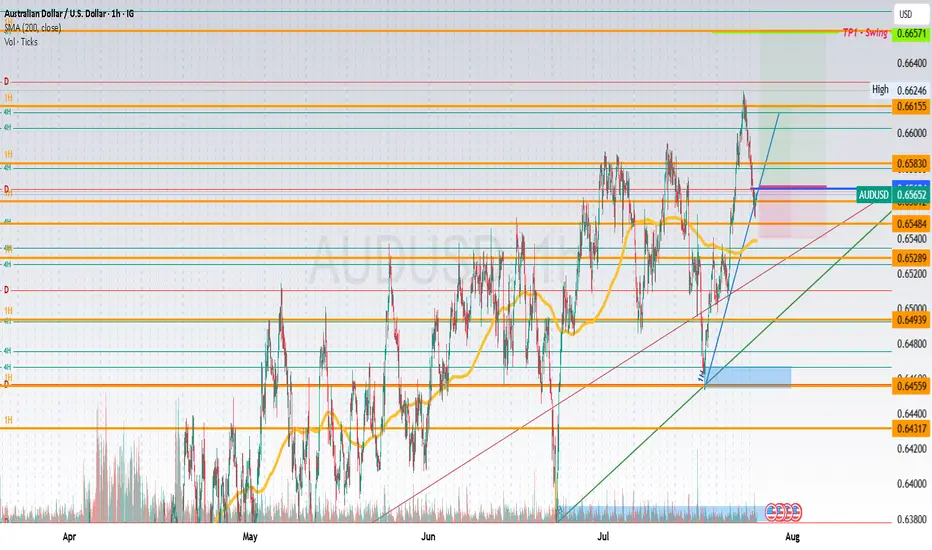
AU LongAUDUSD Entry
Entry @ break and retest of minor support/resistance and trendlines minor and 1H
TP1 where 1H and 4H PRZ share @ 0.66155 TP2 @ 0.66584
which also -27 on major structure fib
HH and HL showing on major structure, continuing the uptrend
Price retraced to 38.2, retesting 1H trendline
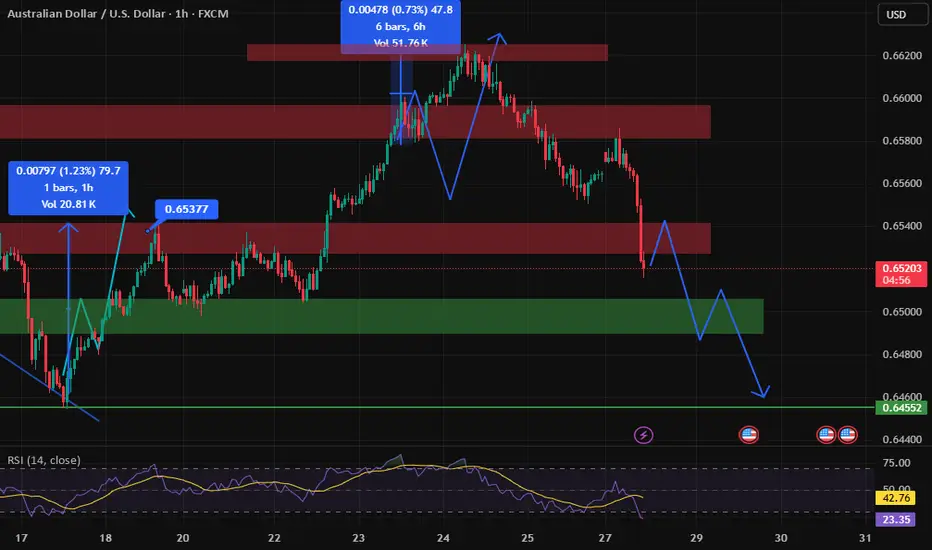
AUDUSD 60/15 Pullback ShortSeeing the market shifted from bull to bear. Looking for a pullback and short.
There is strong sell above, possible to quick probe that then drop.
Monitor.
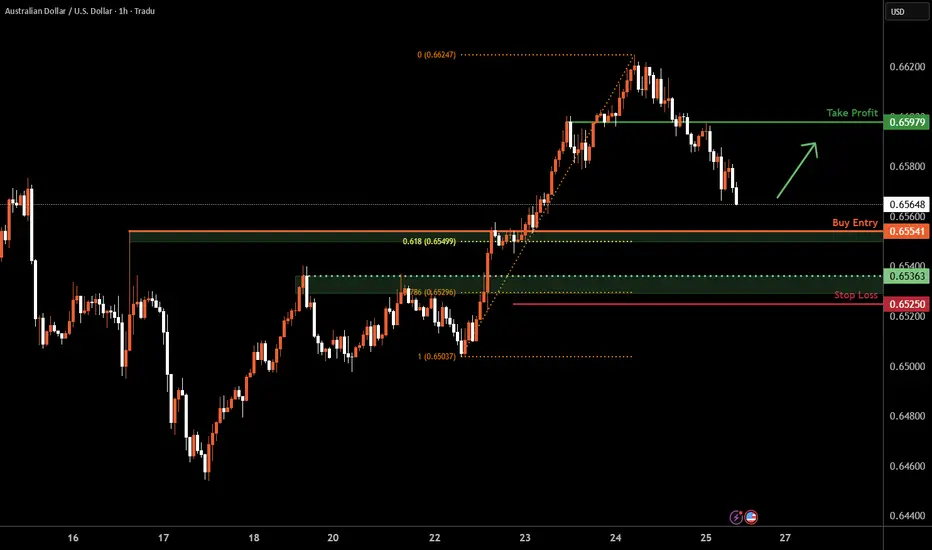
Aussie H4 | Falling toward a pullback supportThe Aussie (AUD/USD) is falling towards a pullback support and could potentially bounce off this level to climb higher.
Buy entry is at 0.6554 which is a pullback support that aligns with the 61.8% Fibonacci retracement.
Stop loss is at 0.6525 which is a level that lies underneath a pullback support and the 78.6% Fibonacci retracement.
Take profit is at 0.6597 which is a pullback resistance.
High Risk Investment Warning
Trading Forex/CFDs on margin carries a high level of risk and may not be suitable for all investors. Leverage can work against you.
Stratos Markets Limited (tradu.com ):
CFDs are complex instruments and come with a high risk of losing money rapidly due to leverage. 66% of retail investor accounts lose money when trading CFDs with this provider. You should consider whether you understand how CFDs work and whether you can afford to take the high risk of losing your money.
Stratos Europe Ltd (tradu.com ):
CFDs are complex instruments and come with a high risk of losing money rapidly due to leverage. 66% of retail investor accounts lose money when trading CFDs with this provider. You should consider whether you understand how CFDs work and whether you can afford to take the high risk of losing your money.
Stratos Global LLC (tradu.com ):
Losses can exceed deposits.
Please be advised that the information presented on TradingView is provided to Tradu (‘Company’, ‘we’) by a third-party provider (‘TFA Global Pte Ltd’). Please be reminded that you are solely responsible for the trading decisions on your account. There is a very high degree of risk involved in trading. Any information and/or content is intended entirely for research, educational and informational purposes only and does not constitute investment or consultation advice or investment strategy. The information is not tailored to the investment needs of any specific person and therefore does not involve a consideration of any of the investment objectives, financial situation or needs of any viewer that may receive it. Kindly also note that past performance is not a reliable indicator of future results. Actual results may differ materially from those anticipated in forward-looking or past performance statements. We assume no liability as to the accuracy or completeness of any of the information and/or content provided herein and the Company cannot be held responsible for any omission, mistake nor for any loss or damage including without limitation to any loss of profit which may arise from reliance on any information supplied by TFA Global Pte Ltd.
The speaker(s) is neither an employee, agent nor representative of Tradu and is therefore acting independently. The opinions given are their own, constitute general market commentary, and do not constitute the opinion or advice of Tradu or any form of personal or investment advice. Tradu neither endorses nor guarantees offerings of third-party speakers, nor is Tradu responsible for the content, veracity or opinions of third-party speakers, presenters or participants.
7.24 AUD/USD ADDED TO WATCHLIST👀 AUD/USD – Watchlist Setup (VMS Strategy)
Monitoring AUD/USD for a confirmed pullback into the marked S/R zone.
What we need to see next:
✅ A clean engulfing candle trigger
✅ Volume and momentum aligned in the trade direction
✅ Entry near the 50EMA, following full VMS criteria
📌 No predictions—just preparation. The setup either fits or it doesn’t.
Keep watching.

AUDUSDafter trap sellers came in range again on mtf. it show bull strength and a liquidity sweep on seller side. we can see a good movemntum on the upside.
make your own analysis before taking trade.
AUDUSD(20250724)Today's AnalysisMarket news:
U.S. President Trump continued to lash out at the Federal Reserve on Tuesday, but seemed to back off from the remaining plan to fire Chairman Powell. "I think he's doing a bad job, but he's going to be out of office soon anyway," Trump said in an exchange with reporters at the White House. "In eight months, he'll be out of office."
Technical analysis:
Today's buying and selling boundaries:
0.6580
Support and resistance levels:
0.6639
0.6617
0.6603
0.6558
0.6543
0.6521
Trading strategy:
Upward breakthrough of 0.6603, consider entering the market to buy, the first target price is 0.6617
Downward breakthrough of 0.6580, consider entering the market to sell, the first target price is 0.6558

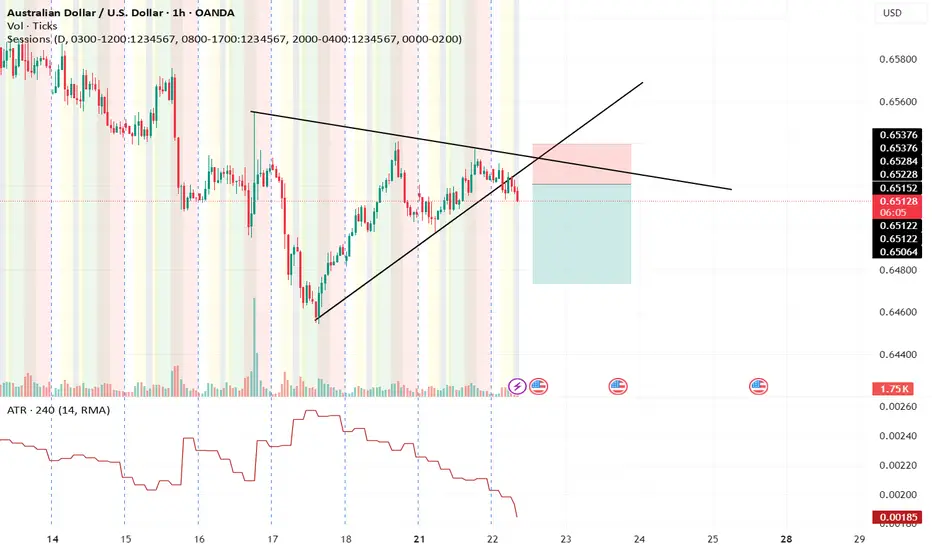
breakout idea1. Day high break
2. retest
3. ATR is increasing
4. price already return to bb
5. Planning to go long.
6. Waiting for confirmation candle
thanks

AUD USD short as it appears it seems there is a breakout don't rush to it it 90 percent of the time pull back to the original price yet i couldn't find better risk to reward ration on other prices lets see ...
Please note: This is for educational purposes only and not a trading signal. These ideas are shared purely for back testing and to exchange views. The goal is to inspire ideas and encourage discussion. If you notice anything wrong, feel free to share your thoughts. In the end, to learn is to share !
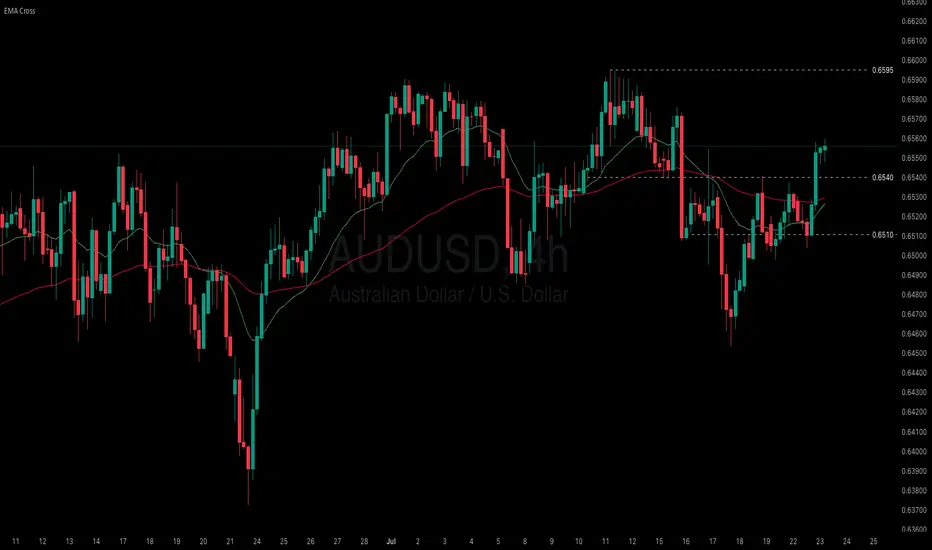
Australia faces a dilemma between inflation and labor slowdown
The RBA, in its latest meeting minutes, emphasized that the recent rate hold reflects a cautious and gradual approach toward achieving its inflation target. While the central bank noted the need for further data to confirm a decline in inflation, some Board members flagged rising unemployment as a signal of potential labor market softening. Bloomberg added that Australia’s export-driven economy remains vulnerable to tariff-related uncertainties, while private demand growth remains sluggish.
AUDUSD extended its uptrend after testing the low at 0.6455, reaching as high as 0.6560. Both EMAs narrow the gap, indicating a potential shift toward bullish momentum. If AUDUSD holds above both EMAs, the price could gain upward momentum toward the high at 0.6595. Conversely, if AUDUSD breaks below the support at 0.6540, the price may retreat toward 0.6510.