What is the key that makes you start trading?
Hello, traders.
If you "Follow", you can always get new information quickly.
Have a nice day today.
-------------------------------------
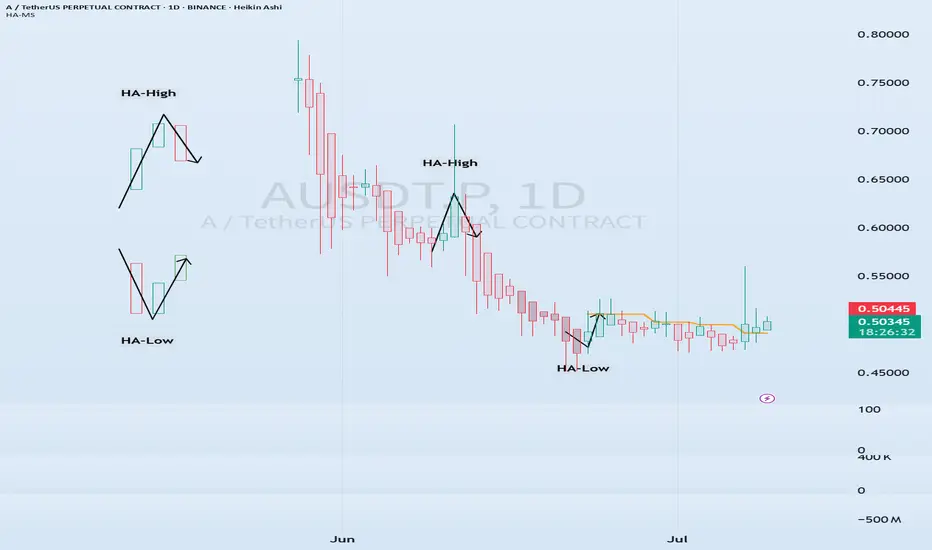
HA-Low, HA-High indicators are indicators created for trading on Heikin-Ashi charts.
Therefore, they are determined by Heikin-Ashi's Open, Close, and RSI values.
If the RSI indicator value is above 70 when the candle starts to rise and then falls on the Heikin-Ashi chart, the HA-High indicator is generated.
If the RSI indicator value is below 30 when the candle starts to rise and then falls on the Heikin-Ashi chart, the HA-Low indicator is generated.
Therefore, rather than judging the rise and fall with your eyes, you can judge the rise and fall transitions with more specific criteria.
If you look at a regular chart, you can see that there are many rise and fall transition points, unlike the Heikin-Ashi chart.
The Heikin-Ashi chart has the effect of reducing fakes.
Therefore, it has a higher reliability than judging with a regular chart.
The biggest disadvantage of the Heikin-Ashi chart is that it is difficult to know the exact values of the Open and Close values.
Therefore, the HA-Low, HA-High indicators are used to accurately and quickly identify the Open and Close values by indicating the rising and falling transition points of the Heikin-Ashi chart on a general chart.
-
The Heikin-Ashi chart uses the median.
Therefore, the HA-Low indicator corresponds to the median when it leaves the low range, and the HA-High indicator corresponds to the median when it leaves the high range.
If the HA-Low indicator is generated and then receives support, there is a high possibility that an upward trend will begin, and if the HA-High indicator is generated and then receives resistance, there is a high possibility that a downward trend will begin.
Therefore, the HA-Low, HA-High indicators are used in basic trading strategies.
However, since the HA-Low and HA-High indicators are intermediate values, if the HA-Low indicator resists and falls, there is a possibility of a stepwise decline, and if the HA-High indicator supports and rises, there is a possibility of a stepwise rise.
Therefore, to compensate for this, the DOM (60) and DOM (-60) indicators were used.
The DOM indicator is an indicator that comprehensively evaluates the DMI + OBV + MOMENTUM indicators.
When these indicators are above 60 or below -60, the DOM (60) and DOM (-60) indicators are created.
In other words, the DOM (60) indicator corresponds to the overbought range and indicates the end of the high point.
The DOM (-60) indicator corresponds to the oversold range and indicates the end of the low point.
Therefore, when the HA-Low indicator resists and falls, the actual stepwise decline is likely to start when it falls below DOM (-60).
On the other hand, when the HA-High indicator is supported and rises, the actual step-up trend is likely to start by rising above DOM (60).
This compensates for the shortcomings of the HA-Low and HA-High indicators.
-
There is no way to be 100% sure in all transactions.
Therefore, if the motivation to start a transaction is clear, it is only worth challenging the transaction.
Finding that motivation and deciding how to start a transaction that suits your investment style is the trading strategy and the core of trading.
-
Thank you for reading to the end.
I wish you successful trading.
--------------------------------------------------
AUSDT.P trade ideas
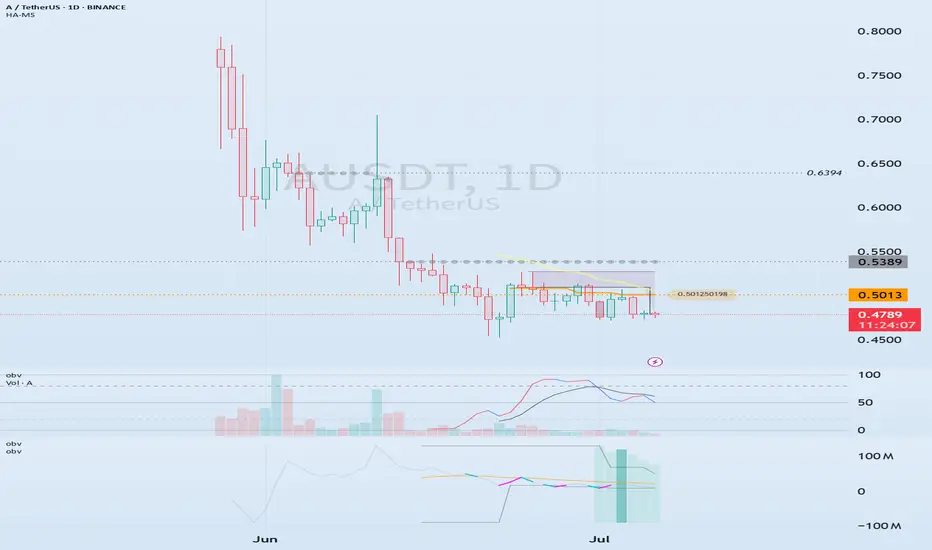
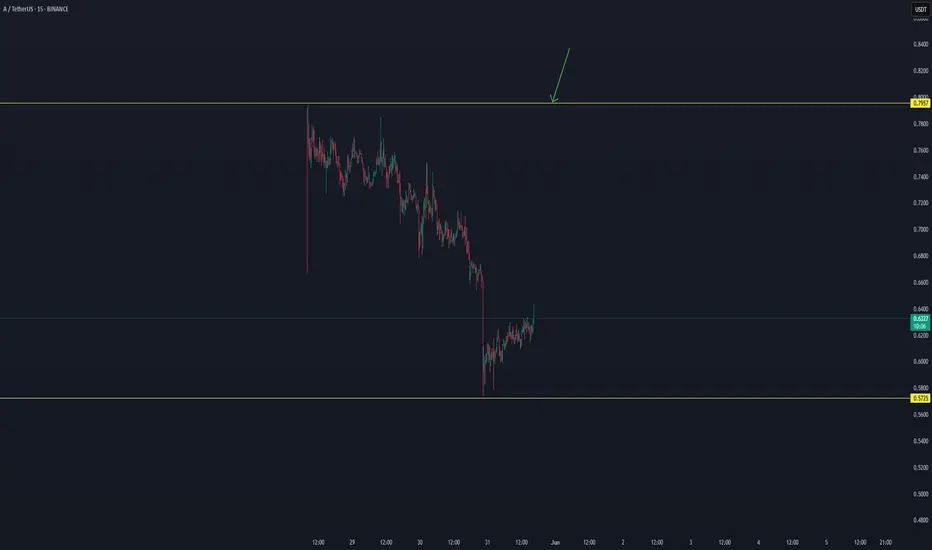
EOS -> Vaulta : (0.5013 support is the key)
Hello, traders.
If you "Follow", you can always get new information quickly.
Have a nice day today.
-------------------------------------
EOS switched from banking to blockchain during the network reorganization.
(AUSDT 1D chart)
The key is whether it can rise to around 0.5013 and receive support.
If not, it is likely to show a step-down trend.
-
(4h chart)
In terms of day trading,
Support range: 0.4942-0.4822
Resistance range: 0.5959-0.6394
We need to see whether it can receive support and rise in the above range.
However, since the M-Signal indicator of the 1D chart is passing around 0.5013, it is important to see how the volume profile formed around this area and 0.5389 will rise.
-
Thank you for reading to the end.
I hope you have a successful trade.
--------------------------------------------------
- Here is an explanation of the big picture.
(3-year bull market, 1-year bear market pattern)
I will explain the details again when the bear market starts.
------------------------------------------------------
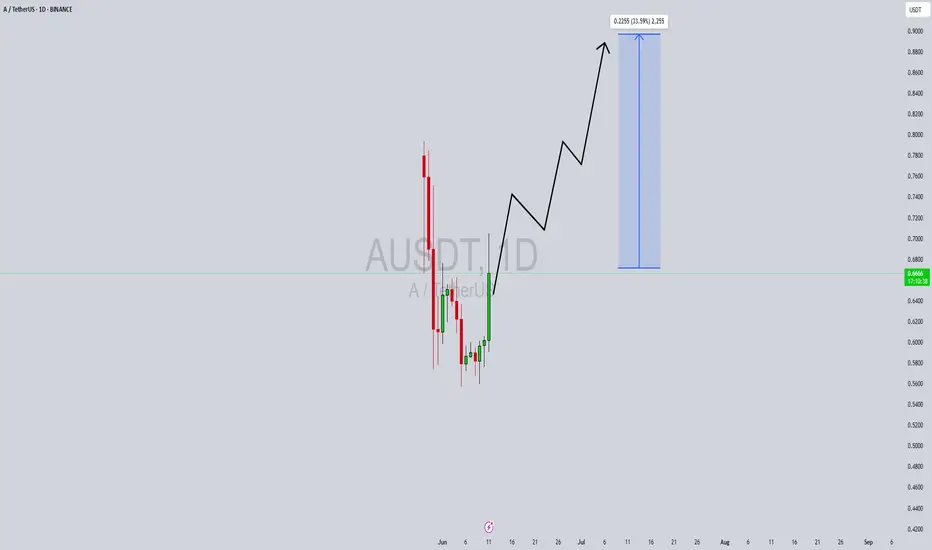
AUSDT Forming Bullish ReversalAUSDT is showing early signs of a bullish reversal, supported by increasing volume and strong recovery candlesticks after a steep decline. The chart suggests a consolidation phase has completed, and the asset is preparing for a potential continuation to the upside. Although this setup may not be as aggressive as others, the market structure implies that a healthy gain of 20% to 30%+ could be realistic in the short term. Traders looking for a balanced risk-reward scenario may find this pair appealing.
What stands out about AUSDT is the strong buying interest that has recently emerged, with the price bouncing back from its lows on notable volume. This could be an indication of accumulation by smart money or early positioning before a breakout. If this momentum continues, the price may establish a steady uptrend with a series of higher highs and higher lows, signaling continued bullish sentiment.
As the broader market conditions stabilize and liquidity flows back into promising altcoins, AUSDT could benefit from increased visibility and investor interest. While the expected gain isn't extreme, the gradual upward movement makes this an attractive play for swing traders and investors who prefer steadier, technically sound setups.
With market momentum shifting and technical indicators aligning for a breakout, AUSDT is worth watching in the coming days. Price action will likely respect the projected levels outlined on the chart, making it a timely candidate for a short-to-mid-term bullish setup.
✅ Show your support by hitting the like button and
✅ Leaving a comment below! (What is You opinion about this Coin)
Your feedback and engagement keep me inspired to share more insightful market analysis with you!
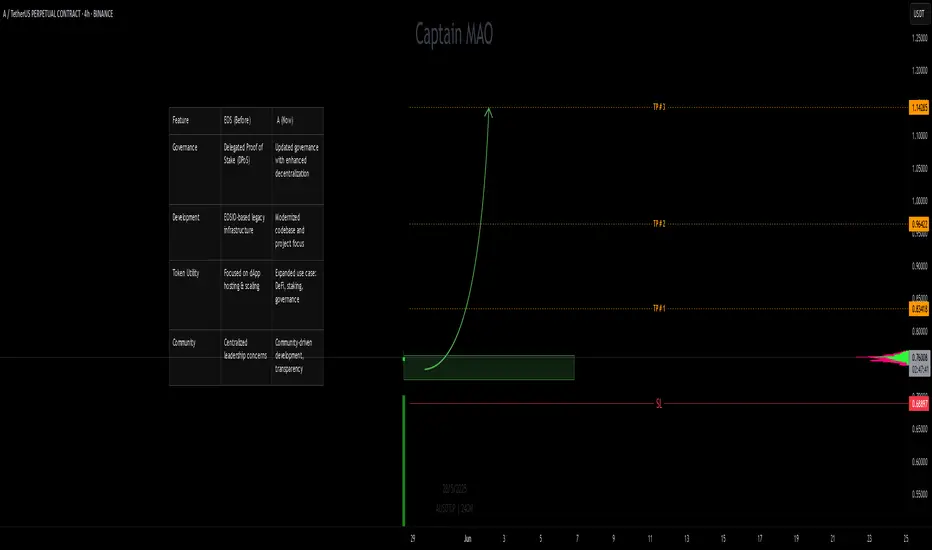
A/USDT (Formerly EOS/USDT) – What’s Changed & Why It MattersWe're watching a fresh opportunity emerge under the new A/USDT trading pair, which recently rebranded from EOS/USDT. While the ticker has changed, it's more than just a name swap—this shift marks a significant evolution in the underlying project. Here's what traders and investors need to know:
* A/USDT is the continuation of the EOS/USDT pair, following a project-wide rebranding aimed at signaling a broader strategic pivot.
* The rebranding reflects changes in governance, tokenomics, and roadmap priorities that differentiate “A” from the legacy EOS ecosystem.
Rebrands can be powerful catalysts—especially when they come with real structural improvements. A/USDT represents a fresh chapter, and while it carries EOS’s legacy, it's positioning itself as something more agile and forward-looking.