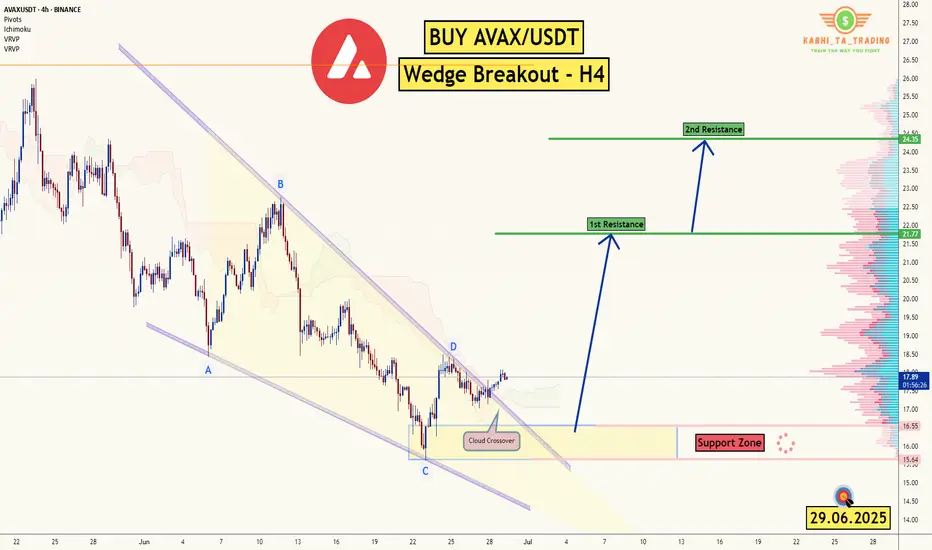
AVAX/USDT - H4 - Wedge Breakout (29.06.2025)The AVAX/USDT pair on the H4 timeframe presents a Potential Buying Opportunity due to a recent Formation of a Wedge Breakout Pattern. This suggests a shift in momentum towards the upside and a higher likelihood of further advances in the coming Days.
Possible Long Trade:
Entry: Consider Entering
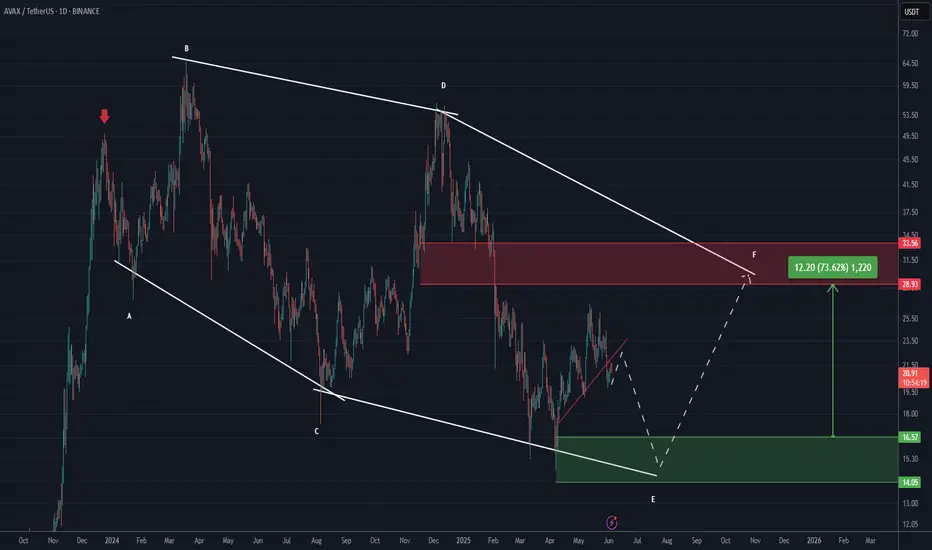
AVAX Analysis (1D)From the point where we placed the red arrow on the chart, it seems a correction has begun.
This correction appears to be a Diametric pattern, and wave E does not seem to be complete yet. It's expected that wave E will finish within the green zone.
The target could be the red box area.
A daily ca
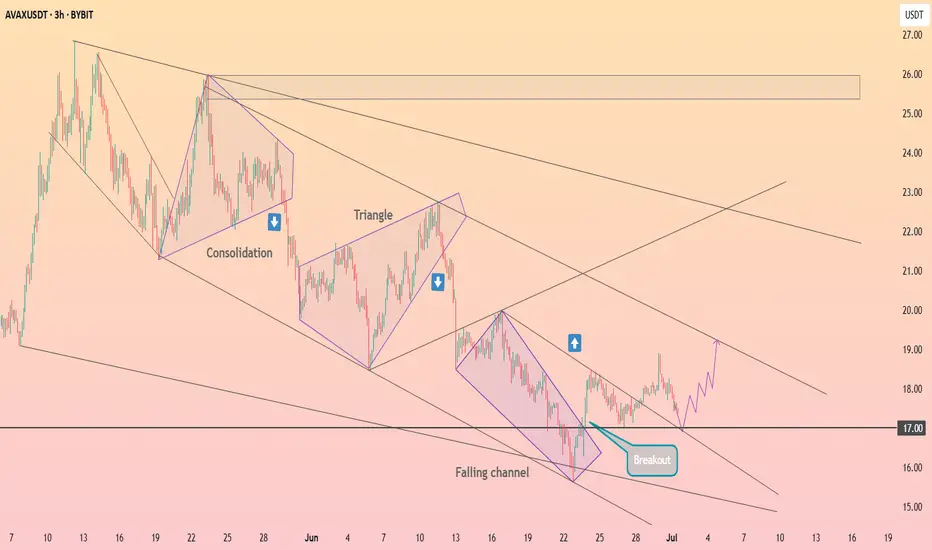
HolderStat┆AVAXUSD seeks to retest $17BINANCE:AVAXUSDT is pushing upward after a breakout from the falling channel structure, reclaiming the $17 support area. The short-term projection points toward $19, with upside potential toward $22 if the channel resistance breaks. Momentum is building from the breakout zone.
AVAX (Avalanche) Breakout? Here’s My Trade Plan.📊 Market Breakdown: AVAX/USDT (Avalanche)
Currently monitoring AVAX/USDT, and both the daily and 4-hour timeframes are showing a clear bullish break in market structure — a key signal that the momentum may be shifting to the upside.
That said, I’m not jumping in just yet. I’m only looking for long

Crypto Jungle: Where Whales Feast and You’re the SnackHere’s the harsh truth: whales and market makers are robbing you blind. They create hype around garbage altcoins, meme coins, and straight-up shitcoins. You, the hardworking retail investor, buy the dream—they dump the bag.
While you're stuck holding worthless tokens, they’re off buying Bitcoin, go

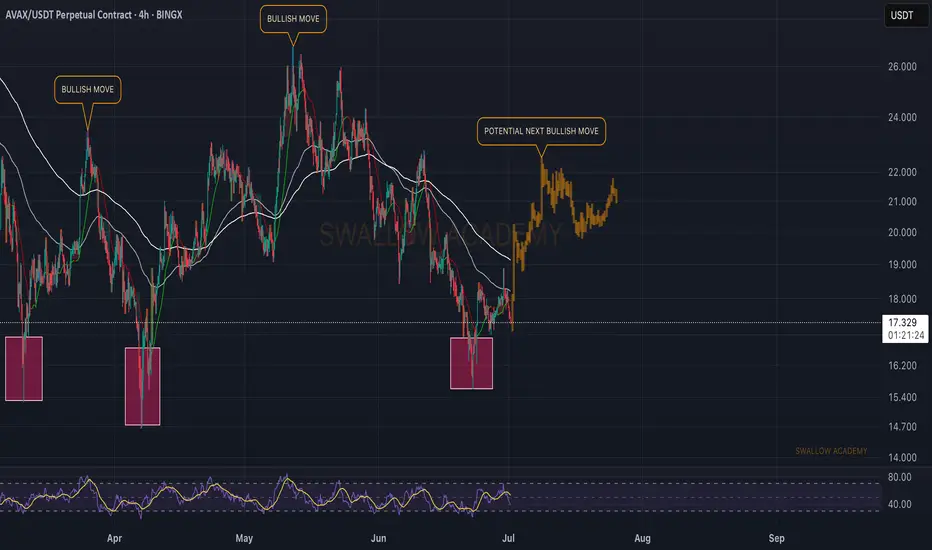
Avalanche (AVAX): Signs of Upcoming Bullish MovementWe noticed a similar pattern, where each time after liquidity hunting near a local support area, we were entering into the next buyside movement, which might indicate that we are about to enter another one pretty soon.
We are looking for upward movement from this region, which would lead the RSI i
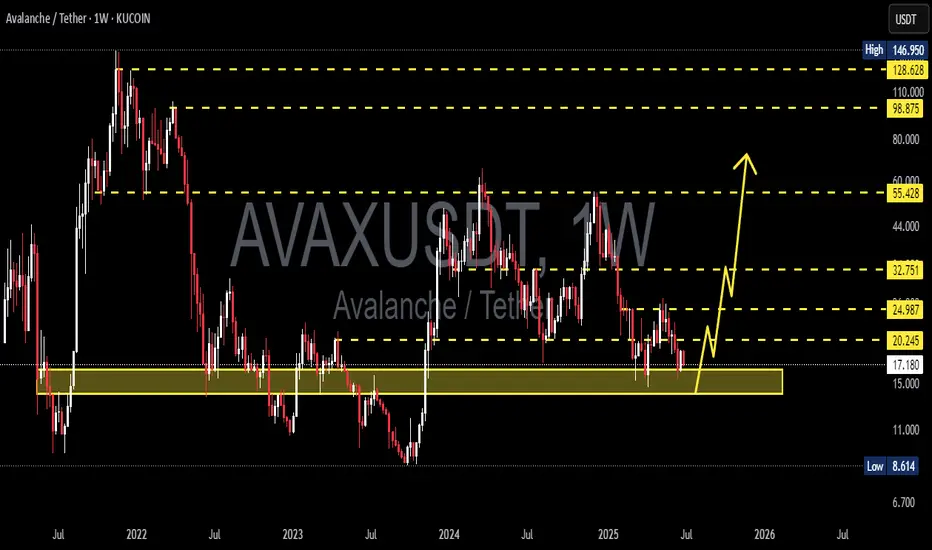
AVAX/USDT Weekly Reversal Zone — Major Support Holding
🟨 CRITICAL ZONE (Key Support Area)
AVAX is currently trading within a major demand zone between $13.5–17.5, a historically strong support area that previously acted as the base for significant upward movements. Multiple weekly candles show rejection from this level, indicating buyer interest.
📊 P
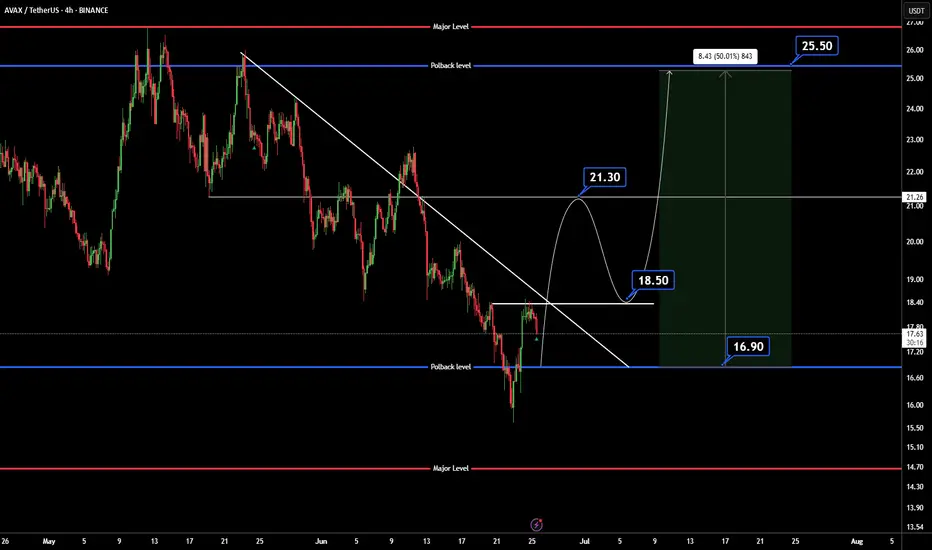
AVAXUSDTWe are bear-trend but wait for break trendline and pollback to 18.50$.
BINANCE:AVAXUSDT
Support: 16.90
Resistance: 18.50 - 21.30 - 25.50
⚠️Control money management.
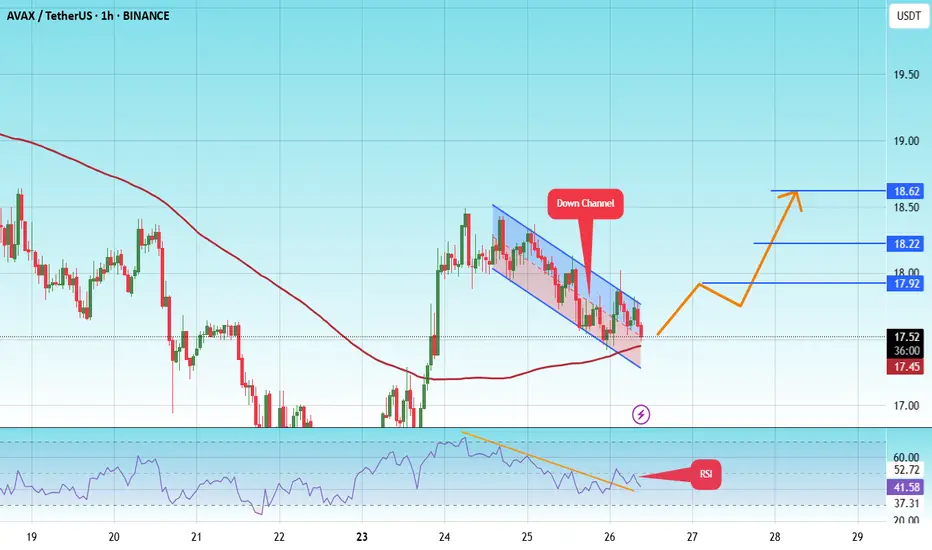
#AVAX/USDT#AVAX
The price is moving within a descending channel on the 1-hour frame and is expected to break and continue upward.
We have a trend to stabilize above the 100 moving average once again.
We have a downtrend on the RSI indicator that supports the upward move with a breakout.
We have a support
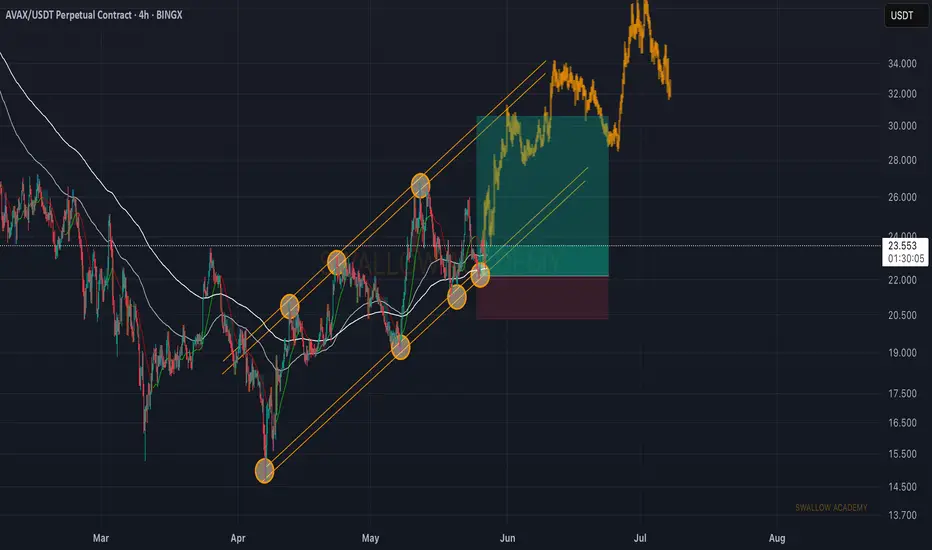
Avalanche (AVAX): Price In Bullish Trend | Might Pump SoonAvalanche had another bounce from the bullish trend where we are getting more and more confirmation of the possible bounce that we might be seeing from here. There is not much to say but as long as we stay inside that bullish trend, we are good for long.
Swallow Academy
See all ideas
Summarizing what the indicators are suggesting.
Oscillators
Neutral
SellBuy
Strong sellStrong buy
Strong sellSellNeutralBuyStrong buy
Oscillators
Neutral
SellBuy
Strong sellStrong buy
Strong sellSellNeutralBuyStrong buy
Summary
Neutral
SellBuy
Strong sellStrong buy
Strong sellSellNeutralBuyStrong buy
Summary
Neutral
SellBuy
Strong sellStrong buy
Strong sellSellNeutralBuyStrong buy
Summary
Neutral
SellBuy
Strong sellStrong buy
Strong sellSellNeutralBuyStrong buy
Moving Averages
Neutral
SellBuy
Strong sellStrong buy
Strong sellSellNeutralBuyStrong buy
Moving Averages
Neutral
SellBuy
Strong sellStrong buy
Strong sellSellNeutralBuyStrong buy
Displays a symbol's price movements over previous years to identify recurring trends.