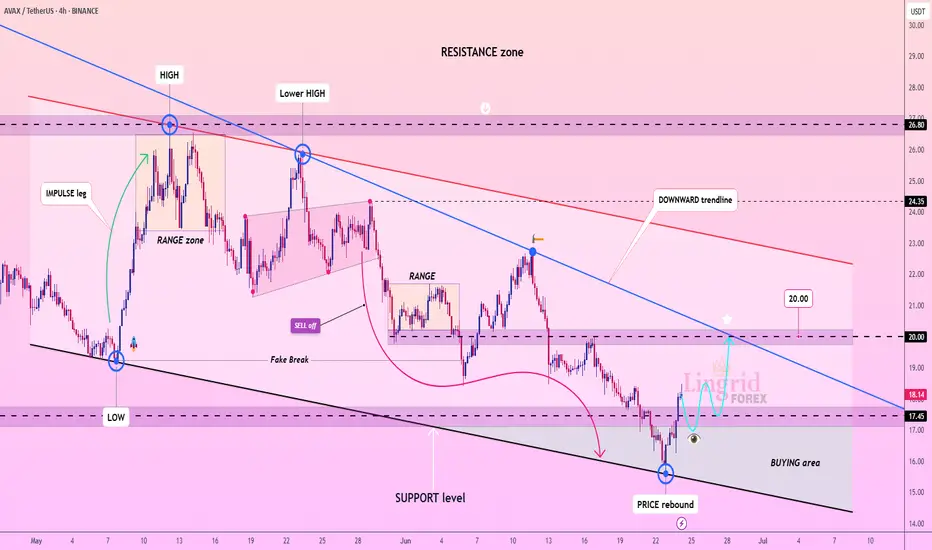
Lingrid | AVAXUSDT strong REBOUND from the SUPPORT zoneCRYPTOCAP:AVAX is rebounding from the lower boundary of its descending channel after a deep sweep into the buying area near 17.00. The price formed a local bottom and is attempting to reclaim the 17.45–18.50 resistance band, hinting at early bullish intent. If buyers sustain this recovery, a test o
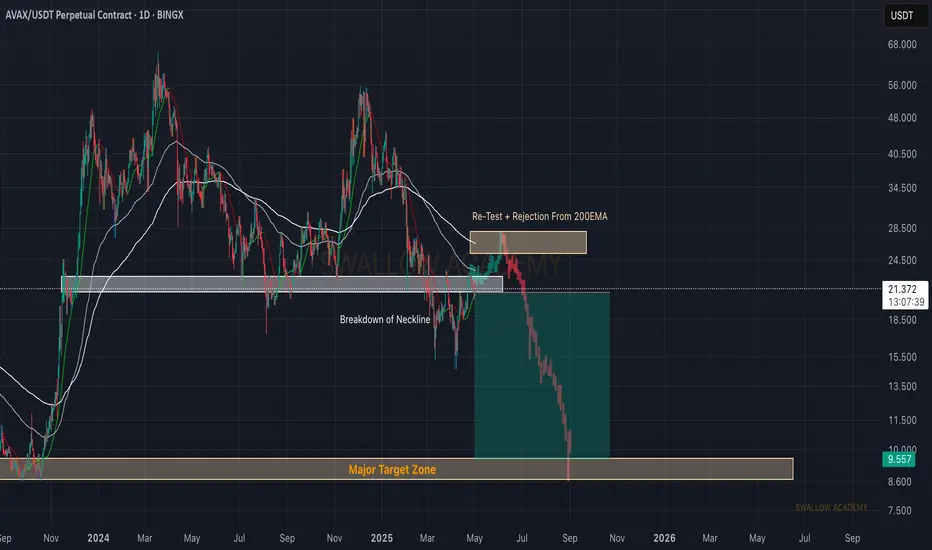
Avalance (AVAX): Re-Testing Neckline Zone | Possible Short?Avalanche coin is showing weakness near the neckline, which is where we have been aiming to see a quick upward liquidity hunt, but then we did not see it.
So our game gameplan has not changed a bit; we still want to see a bigger correction on the coin and we will keep this view as long as the pric
Crypto Jungle: Where Whales Feast and You’re the SnackHere’s the harsh truth: whales and market makers are robbing you blind. They create hype around garbage altcoins, meme coins, and straight-up shitcoins. You, the hardworking retail investor, buy the dream—they dump the bag.
While you're stuck holding worthless tokens, they’re off buying Bitcoin, go

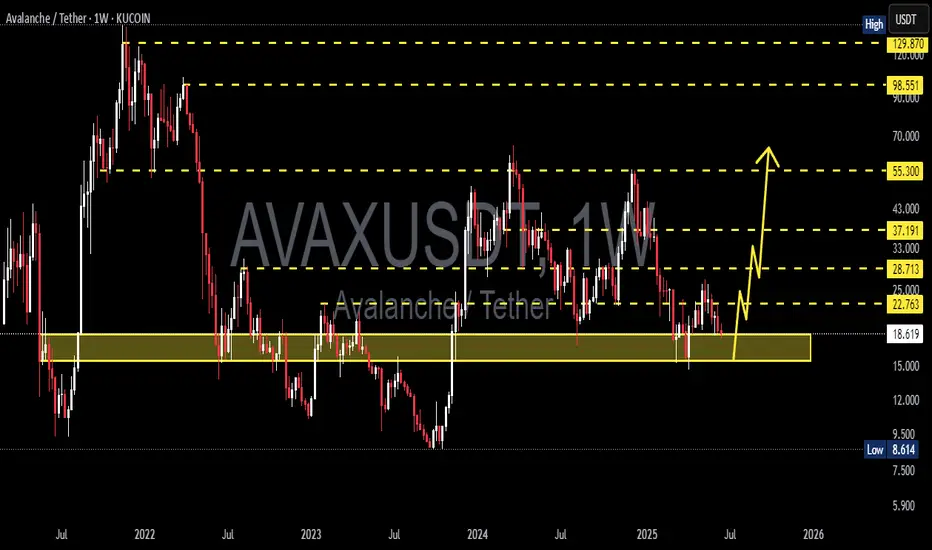
AVAX PLAN FOR 2025 H2 🔥 CRYPTOCAP:AVAX long setup (1D) 🚀
✅ Entry Zone: $14.50 – $16.50 (macro support)
🎯 Targets
• TP-1: $34.00 (’24 supply block)
• TP-2: $46.00 (descending-trend tap)
⛔ Stop-Loss
Daily close < $13.00
📊 Thesis
HyperSDK mainnet → 100 K+ TPS subnets ⚡
Durango Warp Messaging brings native cross-su

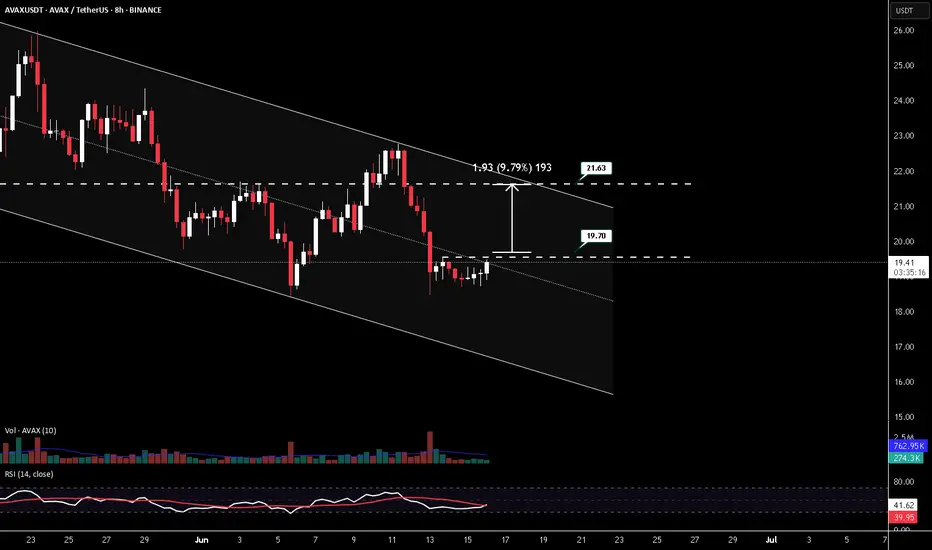
AVAXUSDT LONG POSITIONENTRY: 19.70
TAKE PROFİT : 21.63
STOP LOSS : 1/3
Do not use high leverage!
Remember cash management (planning)!
Please follow the stop-loss rule!
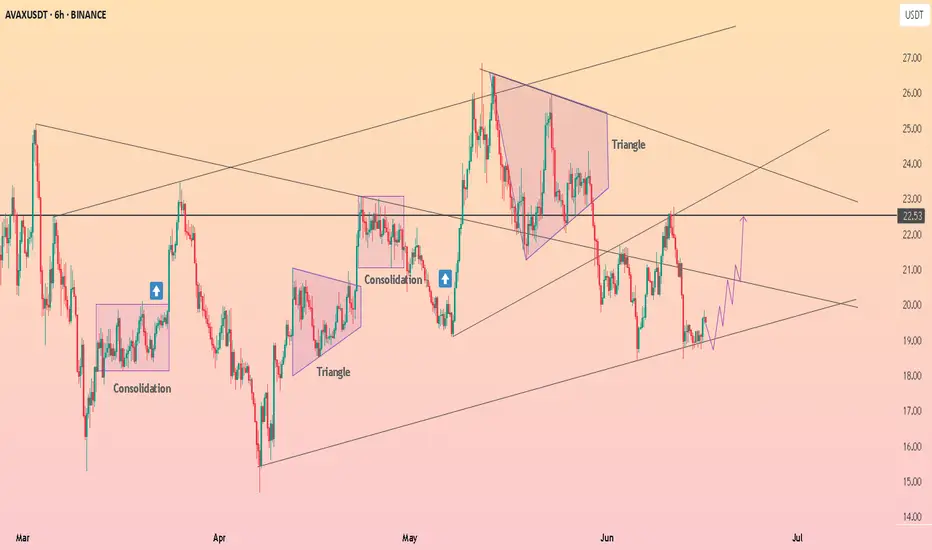
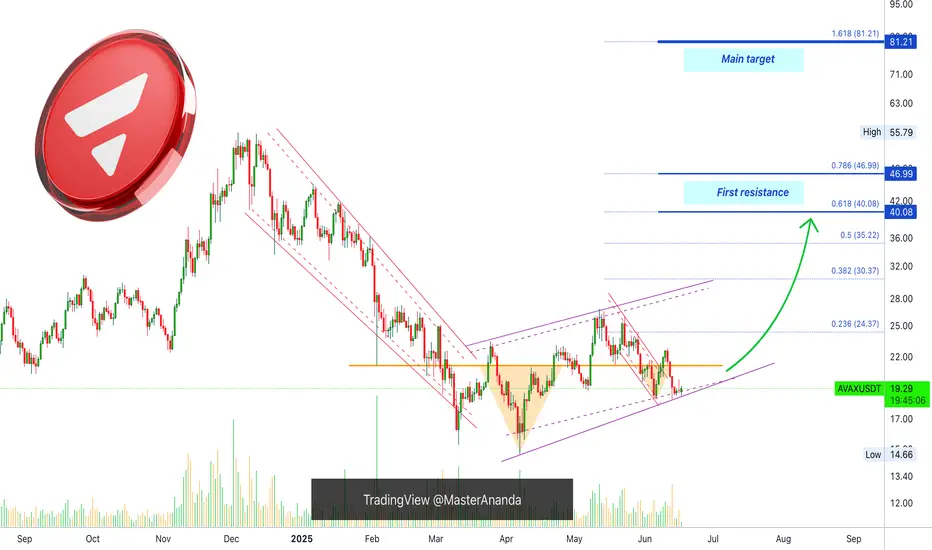
HolderStat┆AVAXUSD held the trend lineBINANCE:AVAXUSDT is rebounding from the 19 support after a falling-wedge break, flipping the pullback into bullish continuation. Holding the trend-line keeps Avalanche pressed north; clearing 22.8 unlocks 25 and fresh-highs narrative 📈
They want AVAX to look weak down here Everyone’s staring at the recent drop like it’s collapse. I see rotation into discount. AVAX is tagging the 0.786 retracement (17.27) — the same level that Smart Money builds into before it reclaims value.
Breakdown of the move:
The range top at 26.86 marked the premium; we’ve now delivered deep i

AVAXUSDT 1W AnalysisAVAX ~ 1W Analysis
#AVAX Buy from here if you still have confidence in this coin with a short term target of at least 20%+, long term target $55
Avalanche, The Money Tree; Great Entry Price & TimingWhat's the first thing you consider when looking at a chart? What is the first thing that catches your attention?
When you take the leap, how confident do you feel that your conclusions are correction? Do you doubt yourself? I don't.
The first I look at are the candles and the chart structure. Lat
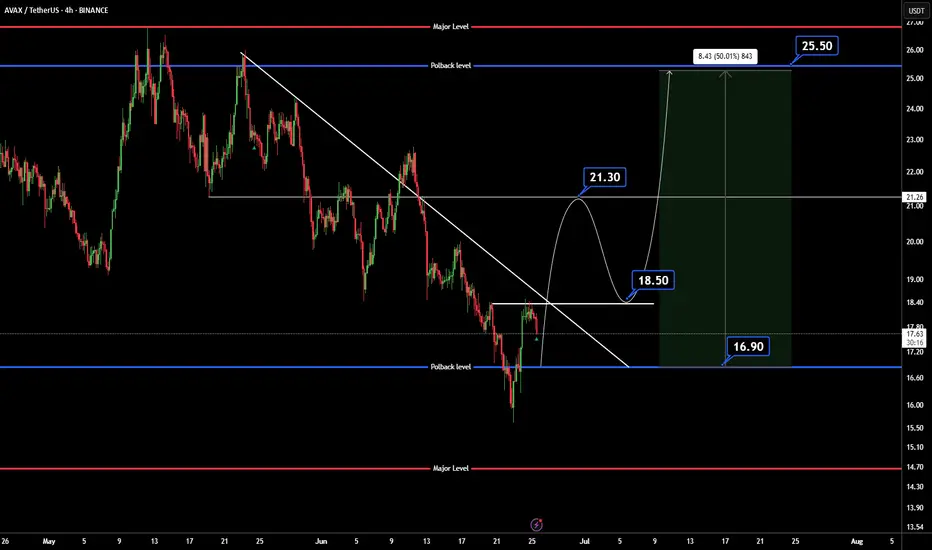
AVAXUSDTWe are bear-trend but wait for break trendline and pollback to 18.50$.
BINANCE:AVAXUSDT
Support: 16.90
Resistance: 18.50 - 21.30 - 25.50
⚠️Control money management.
See all ideas
Summarizing what the indicators are suggesting.
Oscillators
Neutral
SellBuy
Strong sellStrong buy
Strong sellSellNeutralBuyStrong buy
Oscillators
Neutral
SellBuy
Strong sellStrong buy
Strong sellSellNeutralBuyStrong buy
Summary
Neutral
SellBuy
Strong sellStrong buy
Strong sellSellNeutralBuyStrong buy
Summary
Neutral
SellBuy
Strong sellStrong buy
Strong sellSellNeutralBuyStrong buy
Summary
Neutral
SellBuy
Strong sellStrong buy
Strong sellSellNeutralBuyStrong buy
Moving Averages
Neutral
SellBuy
Strong sellStrong buy
Strong sellSellNeutralBuyStrong buy
Moving Averages
Neutral
SellBuy
Strong sellStrong buy
Strong sellSellNeutralBuyStrong buy
Displays a symbol's price movements over previous years to identify recurring trends.