Avax Up to 27 % Or Dump to 16% !?Diamond Pattern Analysis
After breaking the upward trendline, a downward movement can be expected. The first target is $44 and the second target is $35.
If the downward trendline breaks, an upward movement towards higher numbers can be expected. The first target is $69 and the second target is $81.
It is crucial to set a stop-loss because this pattern doesn't always work accurately.
Remember, this is solely an analysis, and your profit and loss are your own responsibility.
AVAXUSDT trade ideas

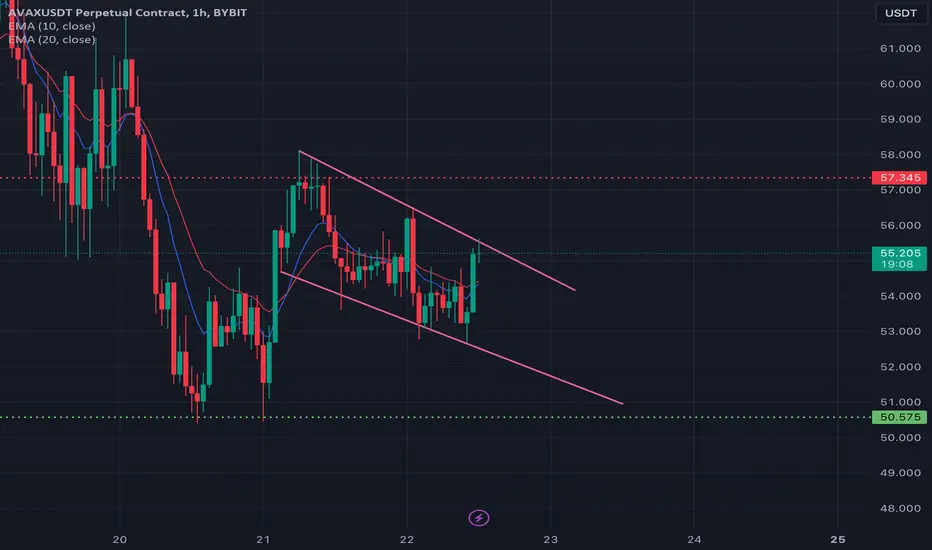
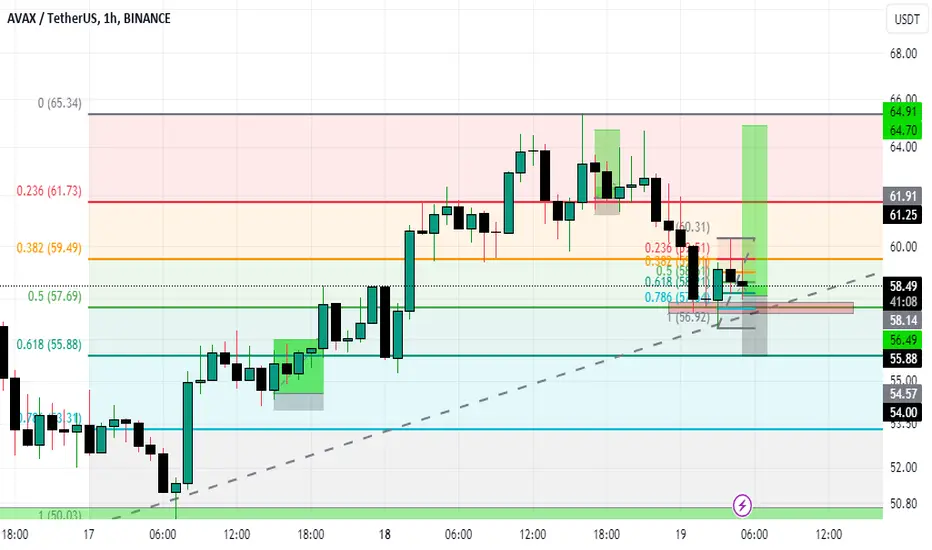
FALLING WEDGE FORMING? A falling wedge pattern is a bullish chart pattern that usually forms during a downtrend, indicating a potential reversal. If AVAX (Avalanche) is forming a falling wedge pattern, traders may look for opportunities to enter bullish positions. Here's a trade idea based on this scenario:
AVAX Falling Wedge Bullish Trade Idea:
Pattern Observation:
AVAX has been in a downtrend, characterized by lower highs and lower lows.
A falling wedge pattern is forming, marked by converging trendlines sloping downward.
The falling wedge pattern typically indicates a weakening downtrend and potential bullish reversal.
Personally i may consider entering at 0.618 (53.765)
or
Just wait for pattern to breakout
AVAXUSDTmy entry on this trade idea is taken from a point of interest below an inducement.. I extended my stoploss area to cover for the whole swing as price can target the liquidity there before going as i anticipate.. just a trade idea, not financial advise

t h e a v a l a n c h e🗻last few ideas:
---
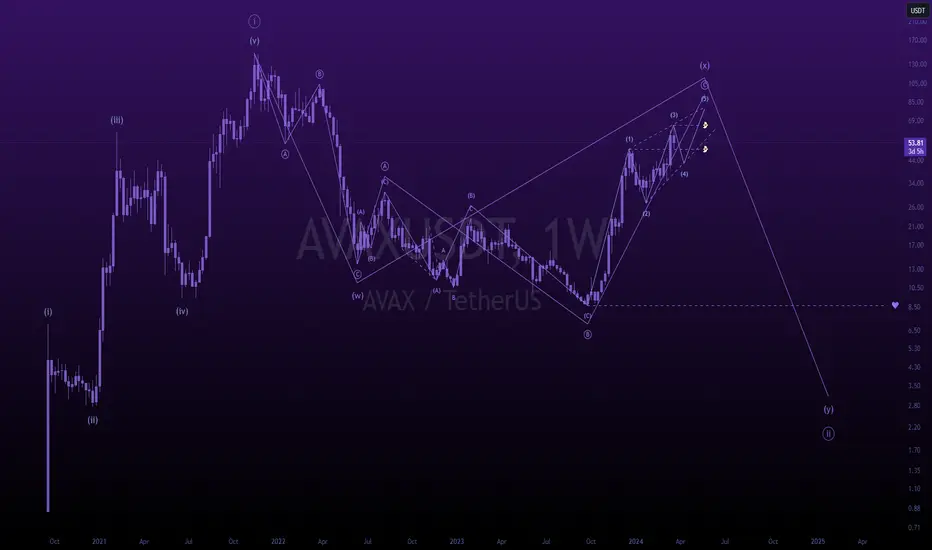
you know why they call it the avalanche?
because when it falls, it falls hard.
you ever try stopping an avalanche?
well you can't.
that's what comes next.
t h e a v a l a n c h e.
---
avax is working on a macro double zig-zag, and is poised for a large push down in the months ahead. we could easily stay lingering around at these heights for awhile, but when it breaks, it'll take everything, quickly.
---
🍒

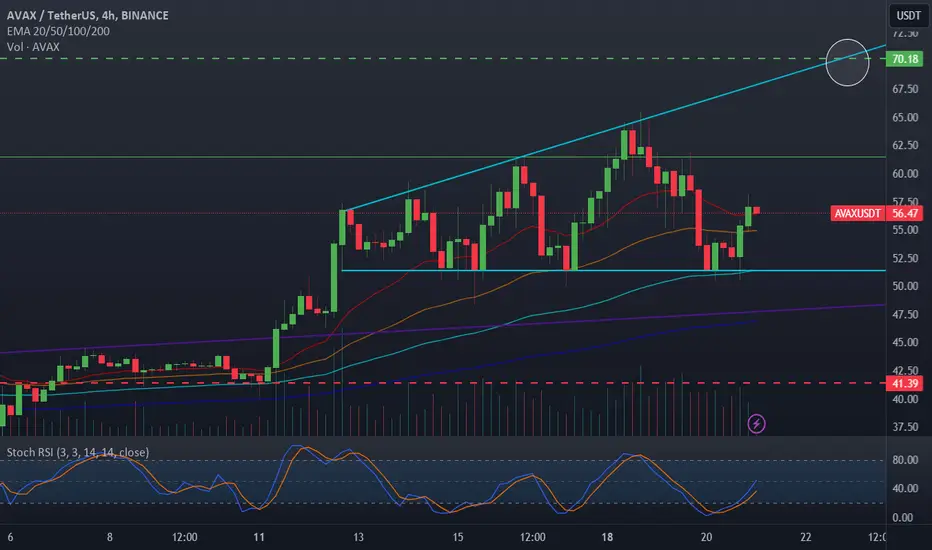
AVAX Megaphone updateAVAX decided to push to the upside and I am glad that I averaged on that bottom support line. I will admit once the fed dovishness arrived I did deploy the rest of my stables into AVAX and INJ before liftoff. I had been DCAing a few select alts including AVAX on this latest flushout.
-My bags have been packed, but I did get some tokens at a discount by selling more volatile setups like JOE into stables last week
-70$ is the more likely direction here as this megaphone expands, I expect a test to the top teal line within 3-4 days here, this invalidates my temporary bearishness, this is also why daily and weekly charts reign supreme
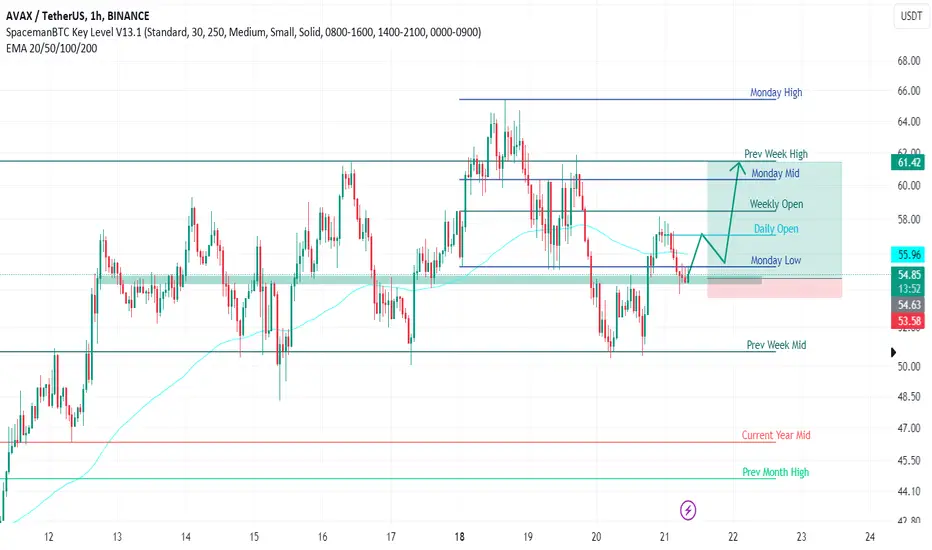
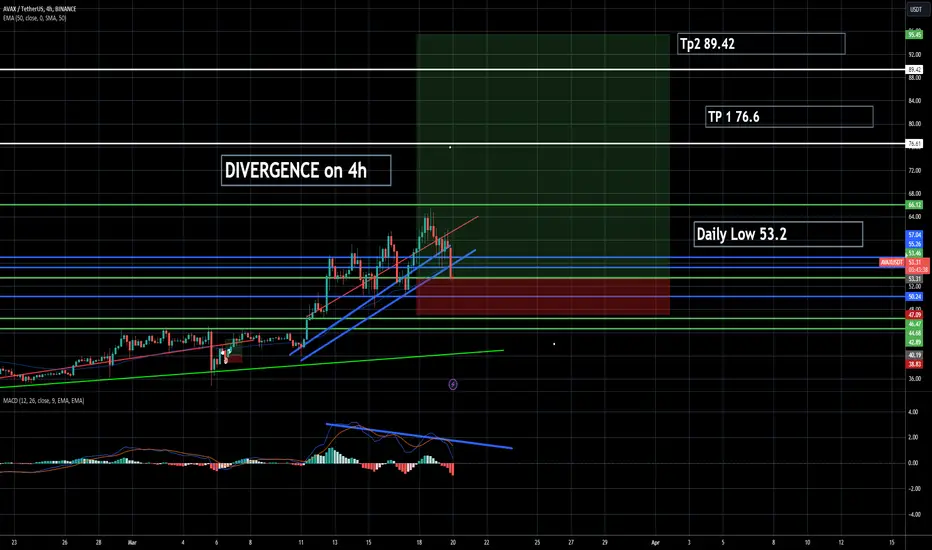
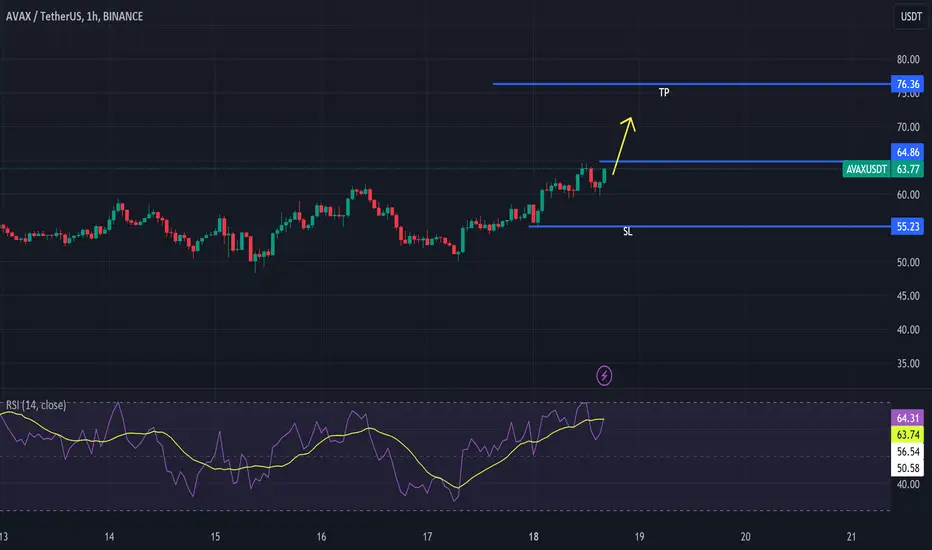
AVAX Long IdeaI've just got into Avax and my last trade I had in it I took from 38 to 56 and now since it hit the daily low of 53.2 and im expecting some rejection here and as you can see in the post those are my long position ideas for TP. this is not financial advice and as always trade responsibly.
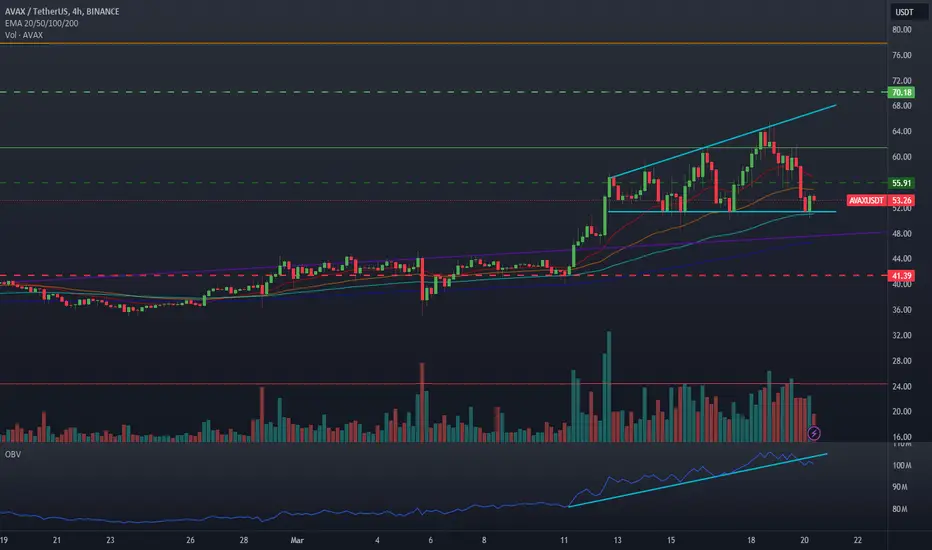
Avax expansion of volatilityAvax had a really powerful move recently before this downturn in BTC. My short term target was hit, which generally means I stop buying for a bit as a local top is likely in. I have taken this opportunity to average in on this base, this expanding wedge or asymmetrical megaphone presents a problem though. Note the break of OBV to the downside, if this is not just a flush this is bearish. Given that this is just a 4-hour chart we could see more downside to the purple long-term trend line. If BTC really dumps I think we could see 41$ again.
-In summary, I am very conflicted on direction here, BTC decides where we go. An expanding pattern such as this means more volatility than we have seen.
-A high of 70 if AVAX depegs from BTC
-A low of 41 with a more likely retest of 48 is most likely.
AVAXUSDT - In Bullish TrendAVAXUSDT is trading in bullish trend making higher highs and higher lows.
Where does it go?(AVAXUSDT W)BINANCE:AVAXUSDT The expected target is visible on the chart. If a second target is provided, it is likely to be achieved.
AVAX Pice Update
The price is moving up in a channel pattern, but it's facing resistance at the trendline. If it breaks above and then retests the trendline, it's usually a bullish sign. However, if it fails to break through, it could mean a possible market correction.

avax short hello Traders, here is the full analysis for this pair, let me know in the comment section below if you have any questions, the entry will be taken only if all rules of the strategies will be satisfied. I suggest you keep this pair on your watchlist and see if the rules of your strategy are satisfied. Please also refer to the Important Risk Notice linked below.
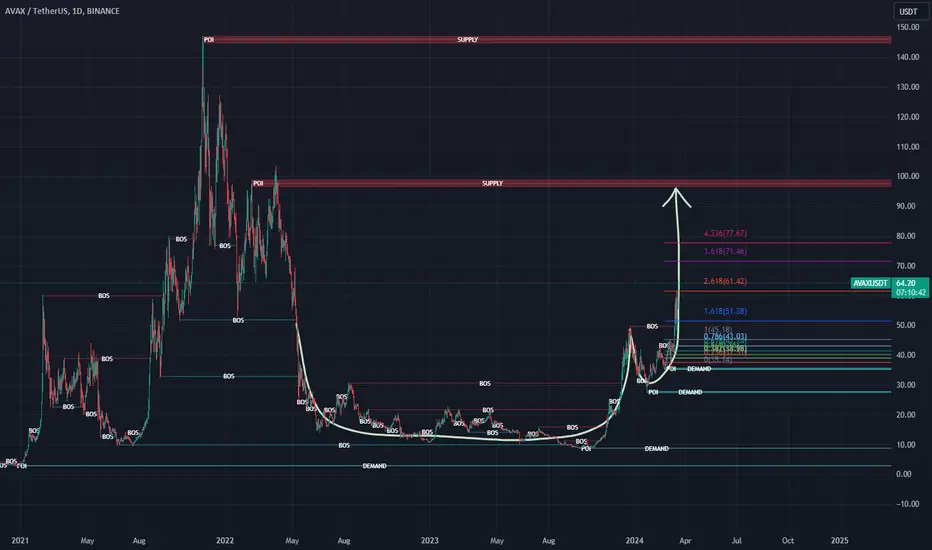
AVAX - Target $100 - 49% increase - Cup and handle break outHello, AVAX looks to break out from a cup and handle pattern and can potentially increase up to $100 which is an increase of approx. 49%.

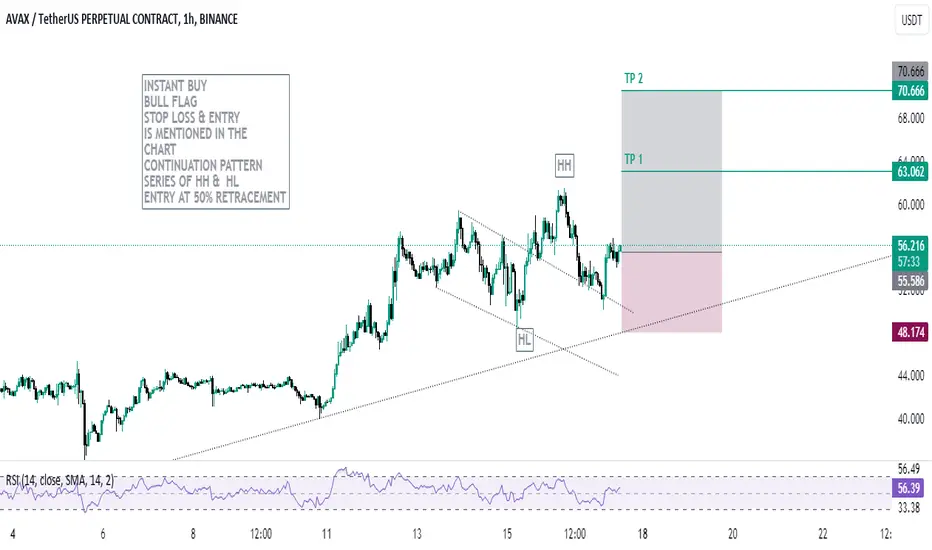
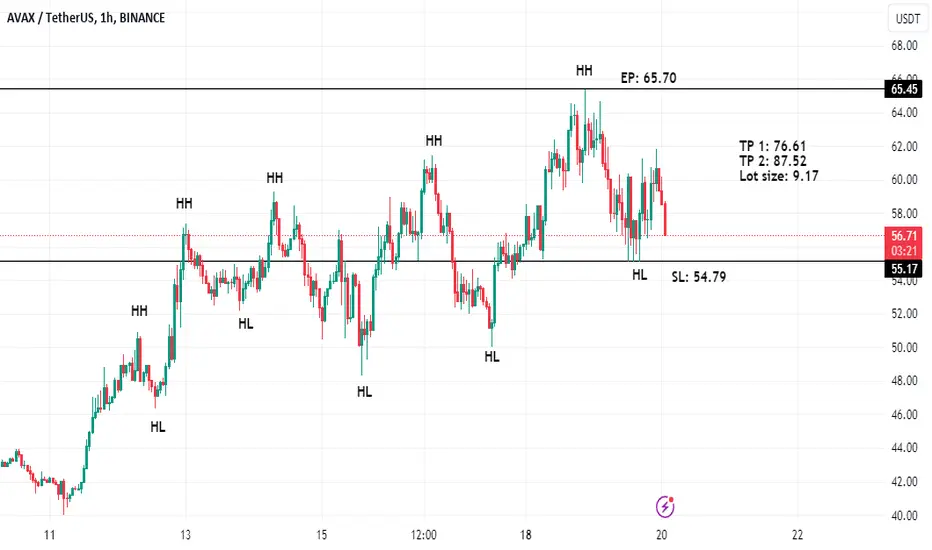
AVAX USDTAVAX USDT is showing beautiful pattern of HH and HL.
TP and SL are placed.
What do you guys think, will this tp hit?
AVAXUSDT Next Target $100AVAXUSDT broke through its resistance and is now aiming for $100. Traders are excited about the surge and expect it to keep going up. With this momentum, AVAXUSDT could soon hit its target, making a big move.Despite AVAXUSDT’s upward push towards $100, it’s essential to maintain a stop loss strategy.
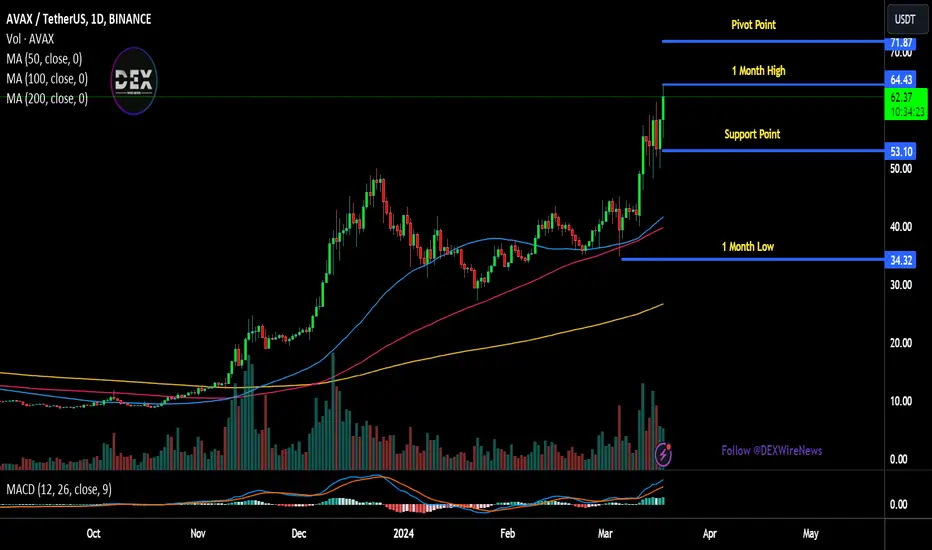
AVAXUSDT (1D Chart) Technical analysis
AVAXUSDT (1D Chart) Currently trading at $61
Buy level: Above $58
Stop loss: Below $47
TP1: $70
TP2: $80
TP3: $90
TP4: $100
Max Leverage 3x
Always keep Stop loss
Follow Our Tradingview Account for More Technical Analysis Updates, | Like, Share and Comment Your thoughts

Avalanche Price Rallies 12% Amid Binance AnnouncementThe cryptocurrency market is abuzz with excitement as Avalanche ( CRYPTOCAP:AVAX ) experiences a remarkable surge of nearly 12%. This surge coincides with a strategic announcement from Binance, the leading crypto exchange, signaling a significant shift in market dynamics.
Binance's Endorsement Fuels Momentum:
The surge in CRYPTOCAP:AVAX price underscores the growing confidence of investors, propelled by Binance's latest move. With the introduction of a USDC-margined AVAX Perpetual Contract offering up to 75x leverage on its Futures platform, Binance aims to enhance trading options and user experience, stimulating trading activity and liquidity for $AVAX.
Expanding Trading Options:
Scheduled for March 20, 2024, Binance's USDC-margined CRYPTOCAP:AVAX Perpetual Contract opens new avenues for traders, enabling them to capitalize on increased leverage options. The 10% promotional trading fee discount until April 3, 2024, further incentivizes trading, while the Multi-Assets Mode feature provides flexibility across multiple margin assets.
Binance's Strategic Commitment:
Binance's endorsement through the introduction of the CRYPTOCAP:AVAX Perpetual Contract underscores its strategic commitment to expanding offerings and meeting user needs. By providing access to CRYPTOCAP:AVAX trading with enhanced leverage options, Binance reinforces its position as a key player in the crypto market.
Impact on Market Sentiment:
Binance's endorsement signals a vote of confidence in Avalanche's potential, driving positive market sentiment and investor interest. With increased access to CRYPTOCAP:AVAX trading and favorable trading conditions, demand for CRYPTOCAP:AVAX is poised for further upticks, potentially driving its price higher.
Avalanche Foundation's Board Expansion:
In addition to Binance's announcement, the recent expansion of the Avalanche Foundation's board has bolstered market sentiment. These developments underscore the growing significance of CRYPTOCAP:AVAX within the cryptocurrency ecosystem, attracting attention from investors and enthusiasts alike.
Current Status and Future Outlook:
As of writing, Avalanche ( CRYPTOCAP:AVAX ) price surged to $62.52, marking a significant gain of 12.73% with a monthly increase of around 50%. With trading volume holding steady and the potential for further upticks, CRYPTOCAP:AVAX continues to capture the attention of investors, positioning itself as a promising asset within the cryptocurrency market.
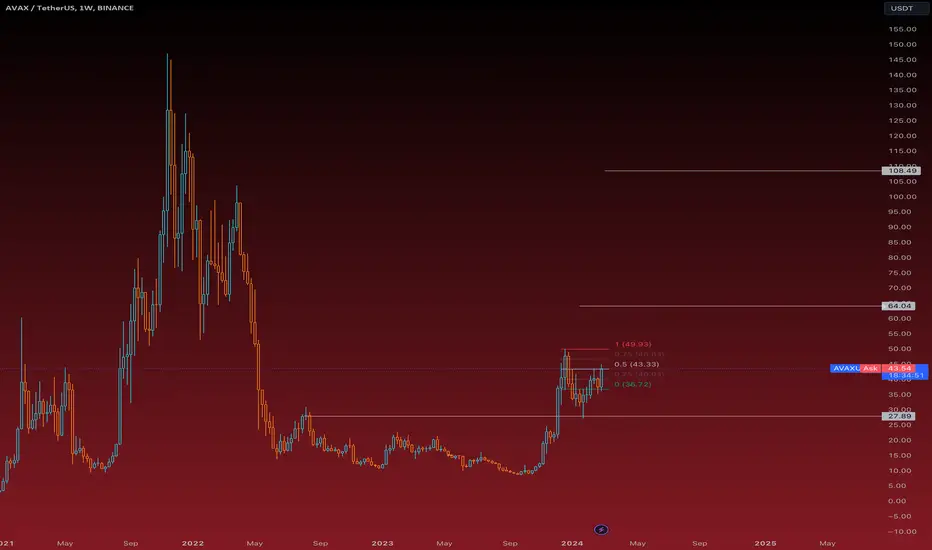
AVAX weekly room to runAVAX following sol has very strong momentum but is a bit behind in momentum. I redrew a full Fibonacci on the monthly and Avax approaches the golden momentum fib sooner than much of the market. My short-term price target has been smashed. I still await a correction and am very exposed to the market regardless of direction. I have stables ready to deploy if we get a harsh correction on BTC before mid April which has been my thesis.
-Next target 70$ short-term
-Medium term 86$
-Yearly, a retest of 130 or all-time-high territory

AVAX - Possible targets Long term we are bullish for avax, we do expect higher prices of minimum $60.
Having said that, this can happen in a number of ways, and we have a plan for all of them.
We currently own avax after buying at $16 and again at $23 after the breakout we collected some profits at $40 and the rest we are keeping for the next tp at $60 and lastly $100.
For now avax is holding the current level and we expect a bounce soon after some accumulation in the area shown between $35.6 and $40. We are staying long and possibly accumulating in this zone for now, there is nothing suggesting that we might break below.
If we do break below, confirm the breakdown and follow through, then we expect another 35% drawdown that would bring us back to the $22 level. If this happens most people will be bears and calling for even lower prices, we however will be accumulating even more provided that there are no macro bear signs in the total chart or btc.
So the strategy is clear, above 35/36 we are bullish and expect higher prices, below that we expect the price to fall to $22.
On the 4h a break below $40 might also give us a chance to enter with a leveraged long. This scenario would come into play if the break below $40 would be weak and stay above $35, if we then broke back above $40 and backtested it as support we would count it as a failed breakdown and a great chance to long to $60. If that does happen we will update the community and hopefully post on here.
I hope this gives you clarity. Good luck!

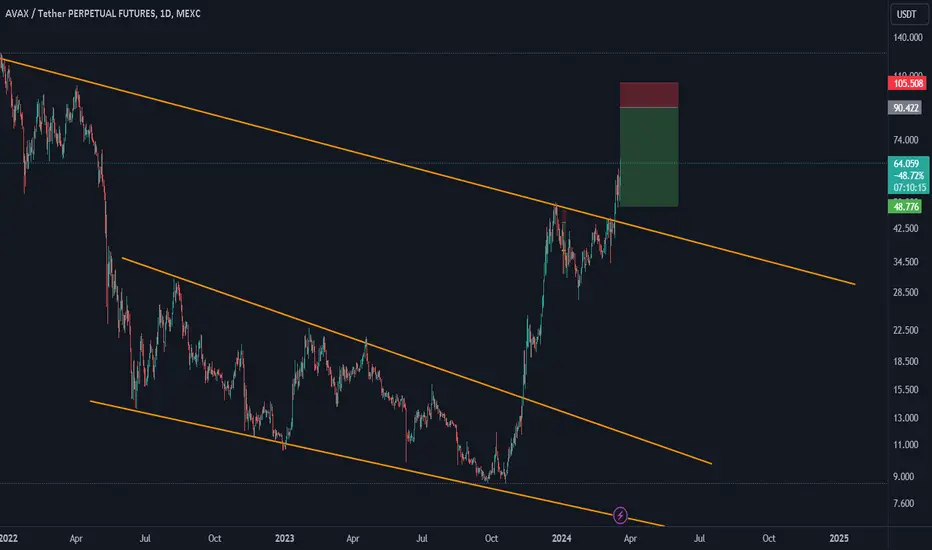
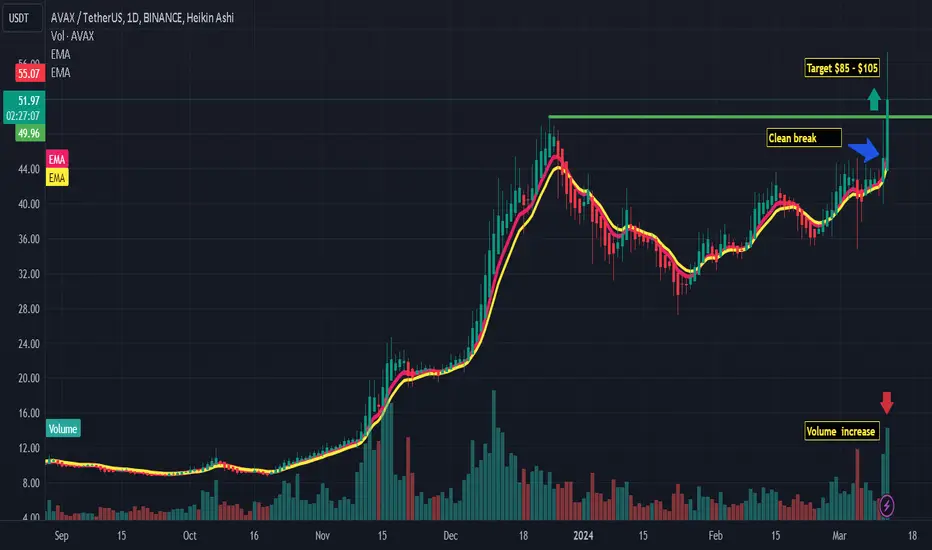
AVAXUSDT $AVAX $AVAXUSD #AVAXUSDT - Clean break, surging higher Break above the TL indicative of continuation of trend. expect continuation to target levels:
> TL 1 = $70 (High Probability)
> TL 2 = $85 (Very Likely)
> TL 3 = $105 (Possible)
Not financial advice. #dyor
AVAXUSDT LONG SETUP AVAXUSDT is showing a continuation pattern known as bull flag series of higher highs and higher lows and also a perfect trendline support