AVAXUSDT Trend Analysis | Will Volume Confirm the Next Big Move?AVAXUSDT Trend Analysis | Will Volume Confirm the Next Big Move?
🔍 Let’s break down the AVAX/USDT setup, examining its technical structure and mapping out key opportunities as it gears up for a decisive move.
⏳ Daily Overview
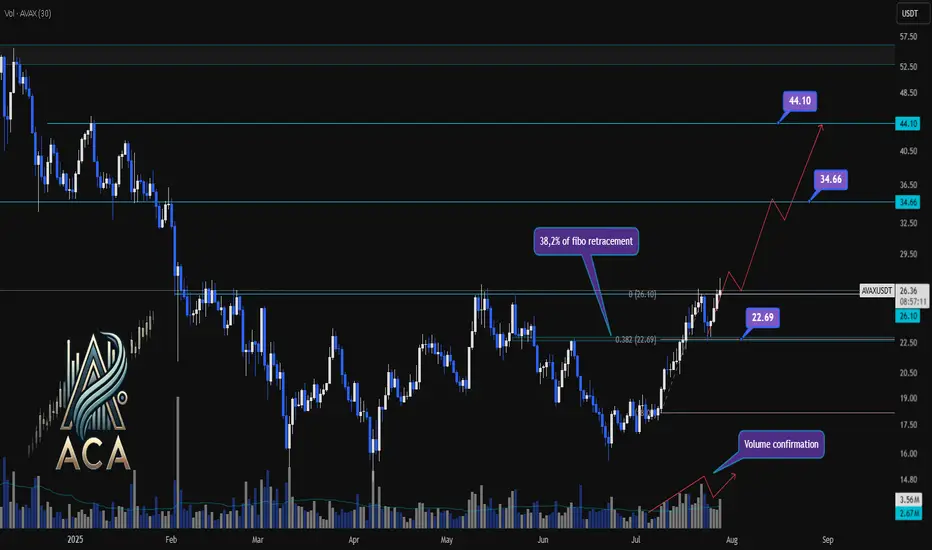
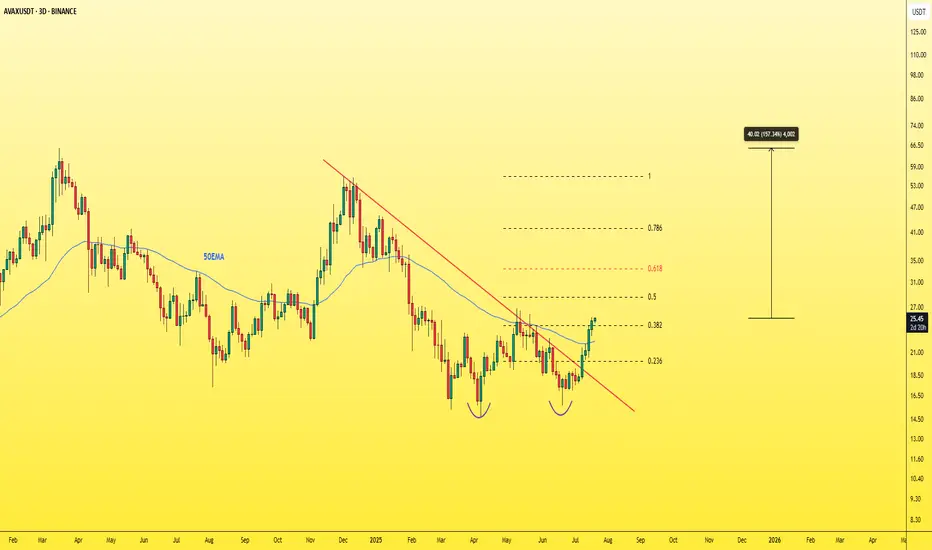
AVAXUSDT has been exhibiting a bullish structure, recently reacting to the 0.382 Fibonacci retracement level (around 22.69USDT) where price paused for a correction. This correction was technically healthy, as it occurred with declining volume, while upward impulses were marked by notable volume surges—signaling strong bullish participation and confirming accumulation phases.
🔺 Bullish Scenario:
The next area to watch is the resistance at 26.10USDT, which has acted as a major barrier in recent trading sessions. A decisive daily close above this level—preferably supported by a clear uptick in volume—would confirm breakout momentum and set the stage for further advances.
Upon confirmation, the chart points to medium- and long-term targets at 34.66USDT and eventually 44.10USDT. These levels are derived from key Fibonacci extensions and historic price reactions, offering logical take-profit zones for trend-following strategies.
📊 Key Highlights:
- 0.382 Fibonacci level (22.69USDT) acted as a reaction zone and healthy correction point.
- Volume profile validates trend: increased buying volume during upswings, decreased volume on dips.
- 26.10USDT is the next crucial resistance for confirmation.
- Breakout (with volume) opens path to 34.66USDT and 44.10USDT targets.
- Failure to clear 26.10USDT could result in consolidation or another retest lower.
🚨 Conclusion:
All eyes are on the 26.10USDT resistance. Wait for a clear daily close and volume confirmation before considering entries. A breakout above this level could propel AVAXUSDT towards higher Fibonacci targets, while a rejection may prompt another retest of prior supports or consolidation.
Stay sharp and plan your trades with discipline!
AVAXUST trade ideas
AVAX Massive Move Coming!Price is at a strong bottom — one of the best buying zones. Just need a break above $27 to confirm the move.
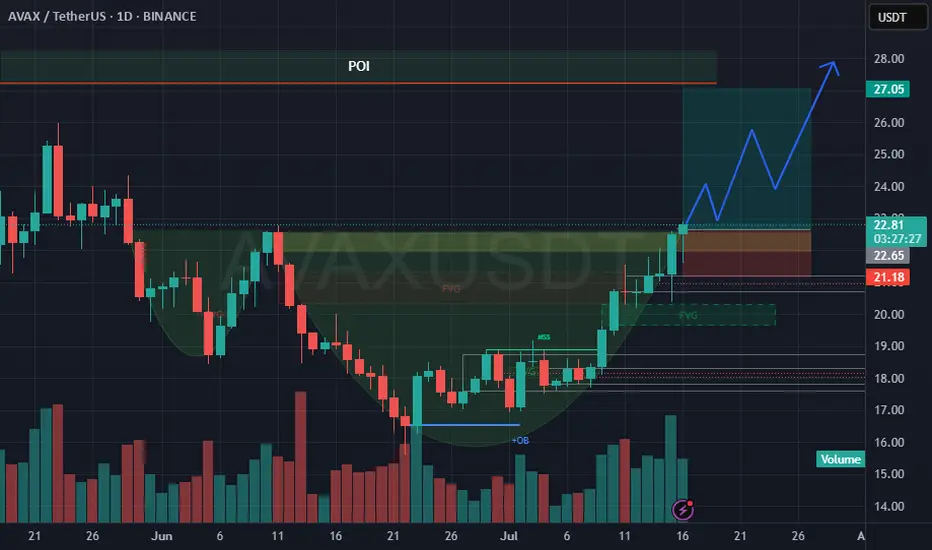
LONG ON $AVAXThe AVAX/USDT chart presents a bullish continuation setup supported by a completed cup formation, bullish market structure shift (MSS) and fair value gap (FVG) fills. With rising volume on the right side of the cup and a clean break above recent resistance, the market shows clear signs of institutional interest and buyer strength. The price is approaching a Point of Interest (POI) near $27, which is likely to serve as a target zone or temporary supply barrier.
A long trade setup is valid between $21.50 and $22.60 which aligns with the retest of the FVG zone, previous structure breakout and early handle development. Stop loss should be placed at $20.9, protecting the setup from invalidation while maintaining a strong risk-reward profile. Target levels include $24.50 (TP1) for an early exit, $26.80 (TP2) near the POI base and $27.05\$27.20 (TP3) at the top of the expected move. R:R range from 2:1 up to 5:1 depending on point of entry.
To execute, traders should watch for bullish confirmation on lower timeframes (1H–4H) within the entry zone, such as a bullish engulfing candle, BOS or a volume-backed rejection. A scaling entry strategy can improve average price and partial profit-taking at key levels ensures the position remains protected as the trade unfolds. Overall, the structure, volume, and Smart Money signals support a high-probability long from the $21.50\$22.60 range toward the $27 POI.
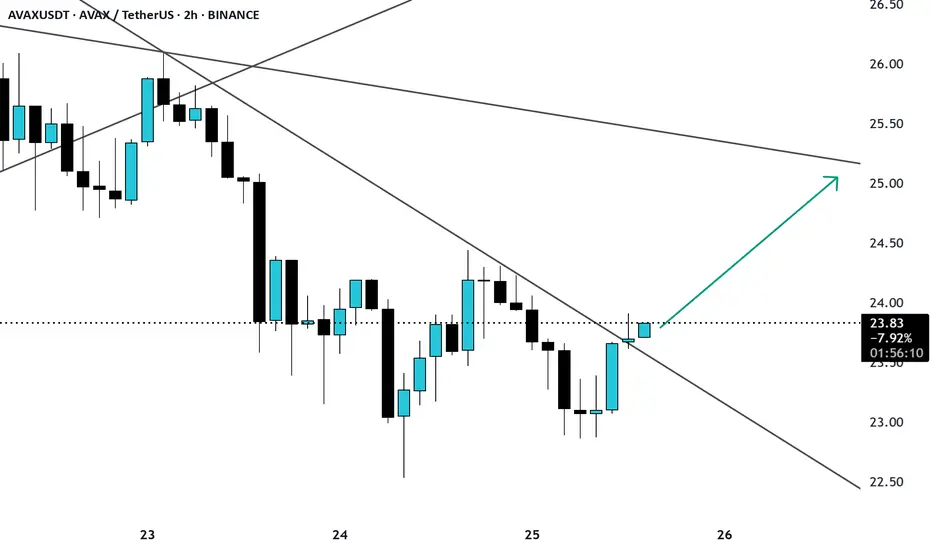
AVAX break of trendline resistance AVAX/USDT is showing a strong breakout attempt on the 2H timeframe, breaking above a descending trendline after multiple rejections from the $23.00 zone.
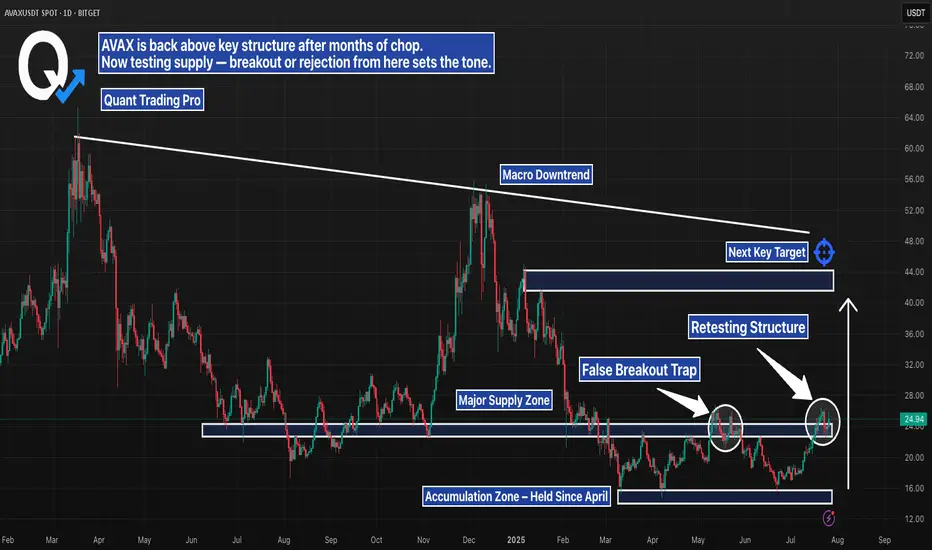
AVAX Daily – Breakout or Another Trap?AVAX just pushed into a major supply zone, testing structure that’s capped price since early 2024. After months of chop and accumulation, bulls have finally reclaimed key support — but the real test is happening now.
Here’s the setup:
– Retesting structure after first rejection
– Sitting below a clear macro downtrend line
– Above an accumulation zone that held for months
– Next key target sits near $40–44, with confluence from prior highs and trendline resistance
This is the kind of move that either builds serious momentum — or turns into another trap. Wait for confirmation. Volume and reaction here will say everything.
#AVAX #Altcoins #CryptoBreakout #SupplyZone #TrendlineResistance #TechnicalAnalysis #QuantTradingPro #PriceAction
Avalanche corrected from resistance ┆ HolderStatBINANCE:AVAXUSDT broke below $27.6 and is testing $25.9. Breakdown may open $24.5. Bears remain in control.

AVAXUSDT.P – High-Risk/Reward Short Setup | Smart Money Play (1H📉 AVAXUSDT.P – High-Risk/Reward Short Setup | Smart Money Play (1H)
🔍 Trade Type: Short
🕐 Timeframe: 1-Hour (1H)
📊 Entry Trigger: Change of Character (CHoCH) after Equal Highs
🎯 Target: 20.298
🛑 Stop Loss: 25.573
💰 Risk/Reward Ratio: 9.79
📌 Trade Breakdown:
This AVAX short was taken based on Smart Money Concepts, using a combination of liquidity structures and market psychology:
✅ Key Confluences:
Equal Highs (EQL) formed above internal structure – clear inducement/liquidity pool.
CHoCH confirmed as price broke below a major internal low → bearish intent confirmed.
Retracement into Bearish Order Block in the Premium Zone offered an optimal entry.
Strong follow-through from institutional selling after liquidity grab.
🧠 Why I Took This Trade:
This setup offered a clean narrative:
Liquidity above = taken
Internal structure = broken
OB in premium = respected
Imbalance/fair value gap below = price magnet
This alignment made it a high-confluence short with an excellent R:R ratio.
🎯 Target Zone (20.298–20.953):
This area contains unmitigated demand and prior support. I anticipate price to:
Tap into this zone to rebalance price inefficiency
Potentially react from there (watch for reversal setups)
⚠️ What I'm Watching:
Possible reaction around 21.793 support – consider partial profits
Maintain awareness of higher timeframe trend (H4/D1)
Volume shift or bullish CHoCH may signal exit before TP

CryptoTrade: AVAXUSD Long Trade with SL and TPCOINBASE:AVAXUSDT Long Swing Trade, with my back testing of this strategy, it hits multiple possible take profits, manage your position accordingly.
This is good trade, don't overload your risk like greedy, be disciplined trader.
I manage trade on daily basis.
this is good trade, lets see, don't be greedy, risk what you can afford.
Use proper risk management
Looks like good trade.
Lets monitor.
Use proper risk management.
Disclaimer: only idea, not advice
Avalanche broke through the $26 level ┆ HolderStatBINANCE:AVAXUSDT is consolidating just beneath the $33 resistance after reclaiming a prior range high. Price action is forming a classic bull flag while higher lows continue to support the structure. A breakout above $33 could confirm bullish continuation toward $35 and $36. Momentum remains strong as long as the $31.5 support holds, making AVAX one of the key watchlists this week.
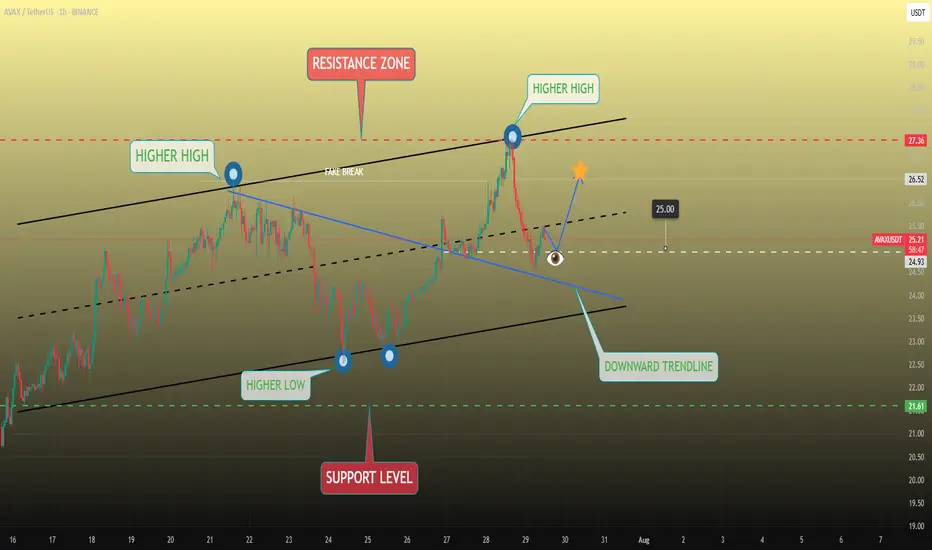
AVAXUSDT Corrective Move In The MarketAVAXUSDT
retraced sharply from the 27.34 resistance zone after making a higher high but found support above the descending trendline. The recent corrective move has paused at a key structure level near 24.96, hinting at potential bullish continuation. A breakout above this local resistance could trigger a rally toward the 26.50–27.34 target zone. Momentum builds as long as price remains above the trendline and higher low structure.
📈 Key Levels
Buy zone: 24.80 – 25.30
Buy trigger: Break and hold above 25.30
Target: 26.50
Invalidation: Close below 24.00
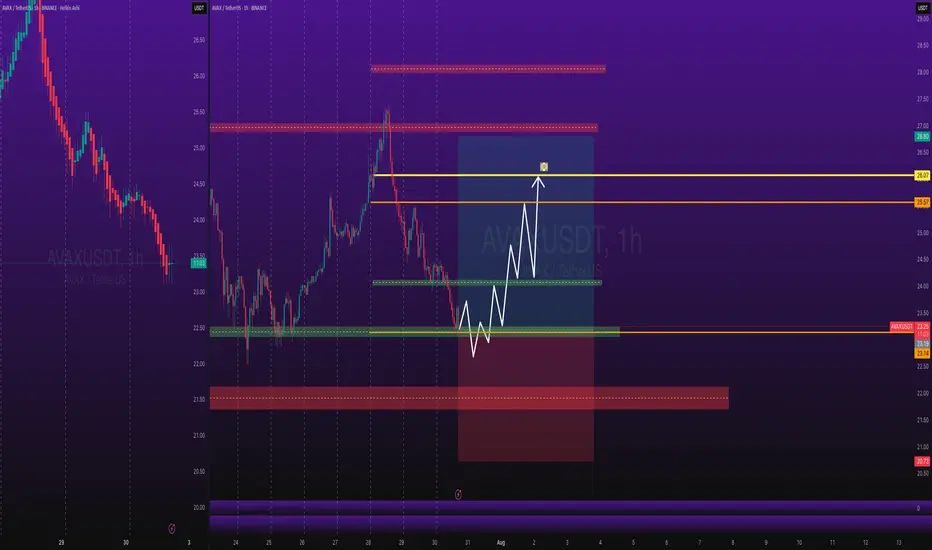
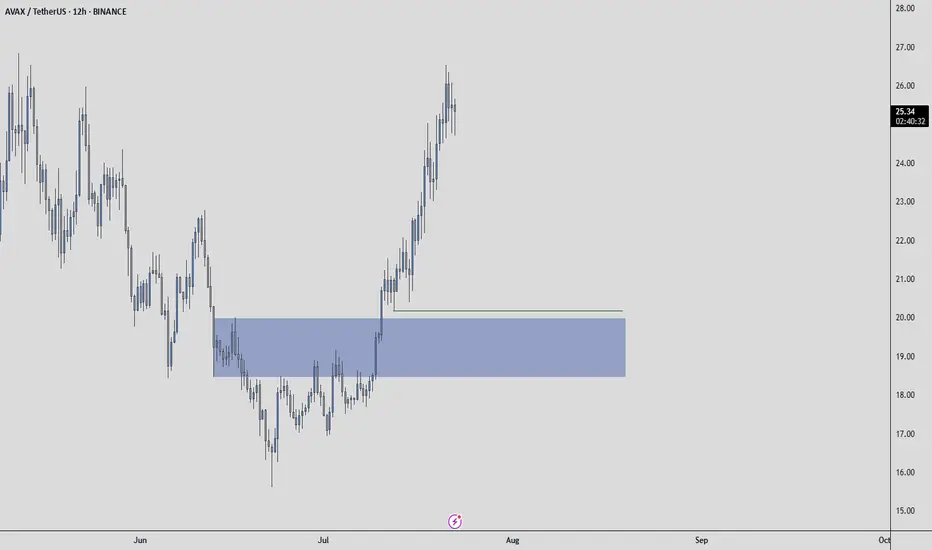
AVAXUSDT: Mid-Term AnalysisThe blue box under liquidity may do the job.
📍 Plan
If price drops into the blue box:
✅ Watch for footprint absorption (buyers stepping in)
✅ Look for CDV support or bullish divergence
✅ Confirm with a structure reclaim before entry
⚡ Reminder
No chasing. No forcing trades.
If the setup aligns, I’ll take it with clear risk.
If not, I’ll wait.
The right price, or no trade.
AVAX Long Swing Setup – Waiting for Support RetestAVAX has been rallying for two straight weeks, showing strong momentum. We’re watching for a healthy pullback into the $22.50–$24.00 support zone to position for continuation. If this zone holds, the risk/reward setup favors bulls with clear upside targets.
📌 Trade Setup:
• Entry Zone: $22.50 – $24.00
• Take Profit Targets:
o 🥇 $27 – $29
o 🥈 $33 – $35
o 🥉 $40 – $44
• Stop Loss: Daily close below $20.50
AVAX/USDT Trade Setup: Bullish Bias with Fibonacci Targets🚀 AVAX/USDT Avalanche is currently in a strong bullish trend 🔼. On the 4H chart, price is pulling back slightly 📉, and I’m watching for momentum to pick up and break above the current range high 📊—that’s where I’ll be looking for the next entry.
🎯 My bias remains long, and in the video I break everything down in detail:
🔍 Price action
🧱 Market structure
📈 Overall trend
📍 Stop loss placement (below the previous swing low)
🎯 Targeting key Fibonacci levels
I also go over my exact Fibonacci settings and how I use them to frame the trade.
This is not financial advice ❌💼

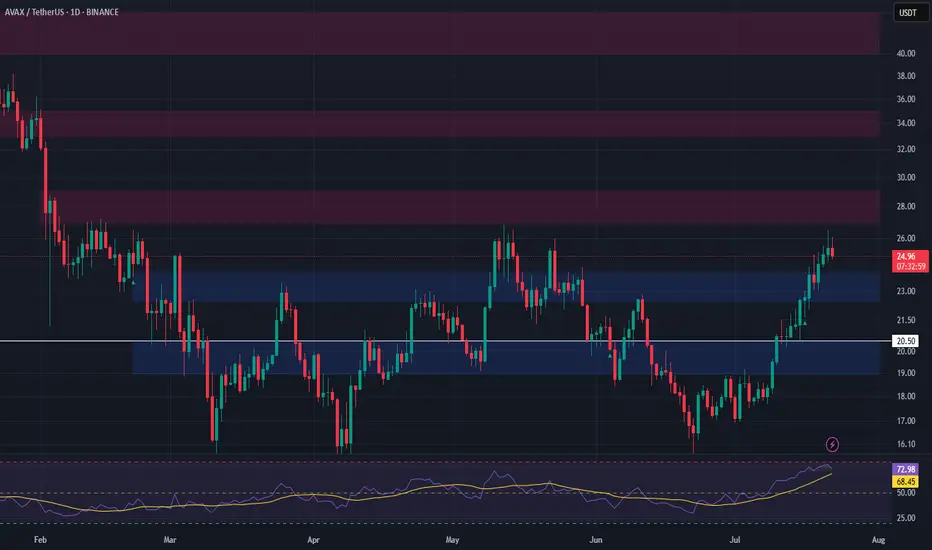
AVAX Analysis (1W)AVAX is currently attempting to form a double bottom pattern, which could signal a strong bullish reversal if confirmed. Earlier this week, AVAX made an effort to break down the key support/resistance zone, but it lacked the necessary volume to succeed.
If AVAX manages to reclaim the resistance area around $27 or higher, and confirms the breakout with a daily candle retest, the minimum target sits at $32.
However, if AVAX fails to break through resistance, there’s potentially an even better buying opportunity in the lower timeframes—a demand zone between $20 and $20.6.
I believe altcoins will offer another chance to catch up while prices are still far below their future valuations.
-S Wishes you the best in luck.

Avax Tests Key Resistance at 27 for the Third TimeAvax is once again testing the 27 resistance level. The first attempt lasted over a week, and the second one held for a couple of days, but in both cases, Avax failed to break through. This time, however, it has stronger support from market-wide momentum.
Bitcoin has reached 120,000, Ethereum is posting sharp gains, and most notably, Chainlink (LINK) has already broken through its own resistance. Avax and LINK have shown a high degree of correlation, nearly 89% over the past two months. This strong relationship, while occasionally fluctuating, has been in place for several years.
A breakout for Avax may take time, but it now has more momentum and supportive conditions behind it. Still, as long as the 27 resistance holds, bulls should approach with caution before entering long positions.
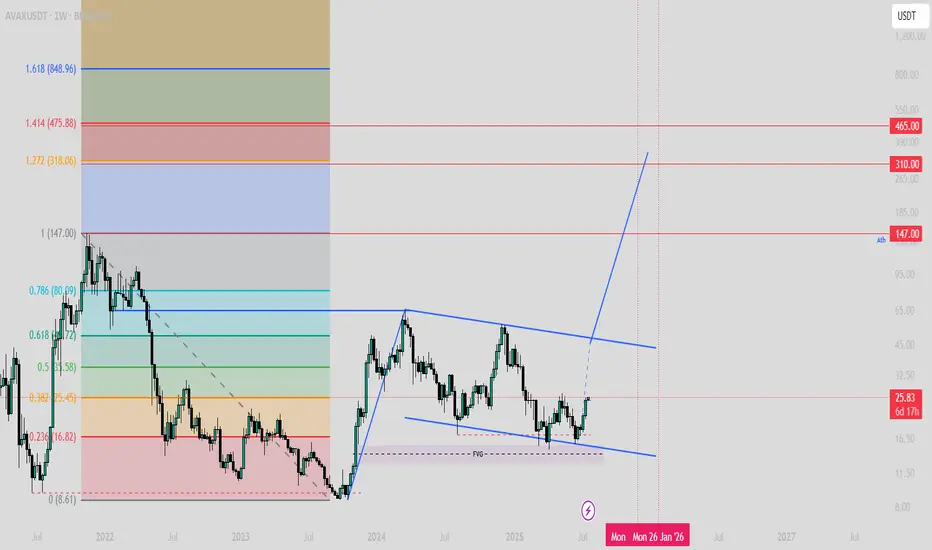
$AVAX Bullish Flag Target will be $310 (12X from here!)Bullish double bottom makes the reversal structure clearer.
After breaking the channel the first target will be the previous ATH and the next will be 1.272 of fibo which is around $310!
#Avalanche (AVAX) Setup | Can Subnets Ride the ETF Wave?📌 Coin: AVAX (Avalanche)
💰 Buy Levels:
✅ First Entry: $25.00
✅ Second Entry: $22.00
✅ Third Entry: $19.00
🛑 Panic / SL Level: Weekly close below $17.00
🧠 Fundamental Analysis (FA) – In Short
*️⃣ Sector: Layer 1 / Modular Smart Contract Platform
*️⃣ Use Case: Avalanche is a high-performance blockchain enabling scalable, low-latency dApps, tokenized assets, and Web3 games through custom subnets.
*️⃣ Tech: Uses Avalanche consensus across three chains (X/P/C), delivering near-instant finality, sub-second transaction speed, and flexible design.
*️⃣ Narrative Fit: Strong narrative alignment with RWA (Real World Assets), Web3 Gaming, and future ETF inclusion due to institutional activity.
*️⃣ Enterprise Adoption: Already used by JPMorgan pilot programs, Citi, Deloitte, MasterCard, and more — making it one of the few real-world-tested chains.
*️⃣ Unique Angle: Subnets allow permissioned chains, native gas tokens, and fully custom blockchains — ideal for both DeFi and enterprise.
📊 Tokenomics & Market Data
(As of July 2025)
🪙 Current Price: ~$23.30
🧾 Market Cap: ~$9B
🔢 Rank: Top 15
🧮 Circulating Supply: ~395M AVAX
🔒 Max Supply: 720M AVAX
🔥 Deflationary Mechanism: AVAX burn from fees, reducing long-term supply
🛠️ Validator Rewards: Distributed through staking + subnet usage
🎯 Bull Market Target (Realistic)
Target Range: $48 – $65
*️⃣ Based on prior cycle resistance, subnet growth, and DeFi/gaming recovery.
🚀 Mega Bullish Target (Speculative Top)
Target Range: $95 – $135+ $200
*️⃣ Avalanche is at the front of RWA tokenization, already powering platforms like Intain, and involved in enterprise pilots with Citi, JPMorgan, and Mastercard.
*️⃣ If RWA becomes the core crypto narrative, Avalanche’s modular subnet design could drive institutional adoption at scale.
*️⃣ While not yet in ETFs, its technical credibility + enterprise presence makes it a top candidate for future L1 ETF exposure or crypto asset baskets.
*️⃣ Combine institutional flow + Web3 gaming + subnet scaling, and you get a realistic path to triple-digit price discovery.
✅ Final Take
🧠 Avalanche is a technically mature Layer 1 with real-world traction and modular scaling via subnets — giving it strong utility and upside.
we ask Allah reconcile and repay
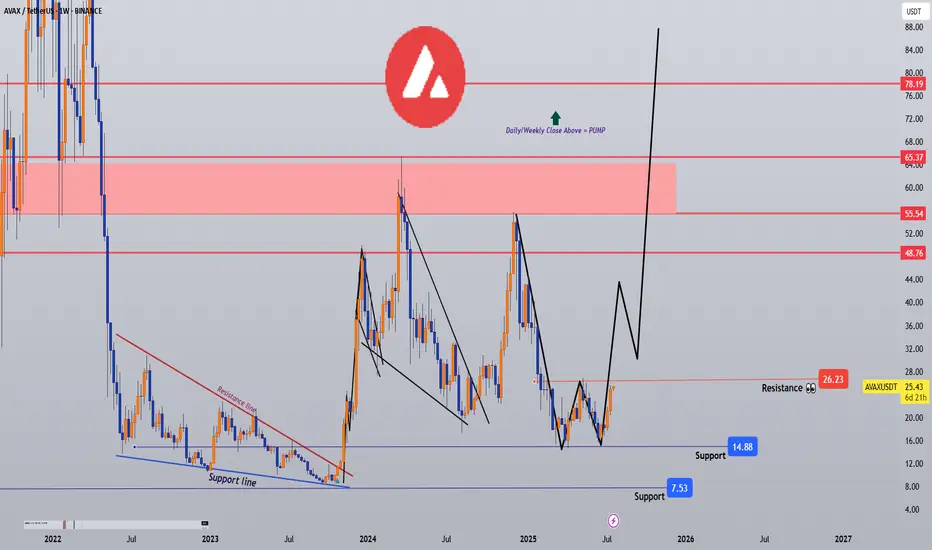
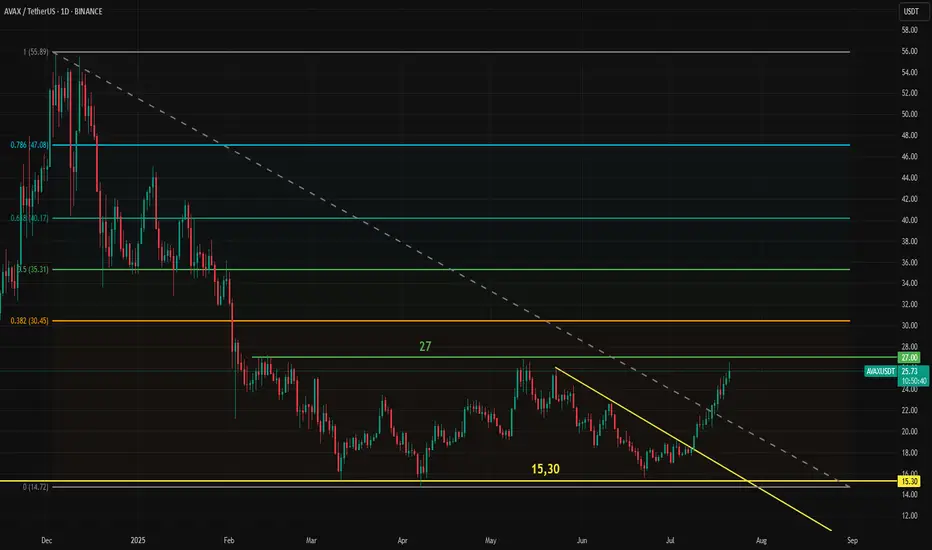
AVAXUSDT - THE real treasure must be hunted!Let's not forget about CRYPTOCAP:AVAX — it's one of the must-have assets in any crypto portfolio.
Currently trading at a discounted price after dropping from its previous top at $55, AVAX now shows strong bullish potential with plenty of upside ahead.
🚀 Key bullish signs:
-Successfully broke through multiple resistance levels, including the 0.382 Fibonacci retracement, 50 EMA, and the main descending trendline.
-A daily close above the 26$ level is a very positive signal.
With a solid project, reliable fundamentals, and low risk compared to potential reward, this could be a highly profitable opportunity.
Don’t sleep on it.🎯
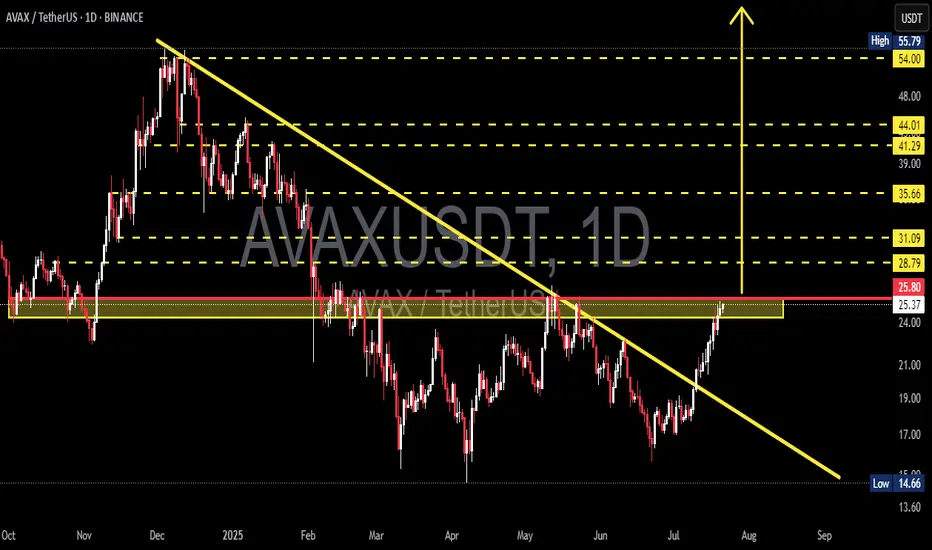
AVAX/USDT Massive Trend Reversal: Breakout from 8-Month DowntrenAVAX has just delivered one of its most technically significant moves in recent months. After spending over 8 months trapped under a descending resistance line, price action has finally broken free — suggesting a potential trend reversal and the beginning of a much larger bullish phase.
🧠 Pattern & Structure Breakdown:
📌 Descending Trendline Breakout
AVAX had been forming a descending triangle pattern, characterized by consistent lower highs and a horizontal support zone between $14.66 – $22. The recent bullish breakout from this structure, accompanied by strong volume, is a highly encouraging sign for bulls.
📌 Accumulation Zone Identified
The yellow zone on the chart ($14.66 – $22) has proven to be a strong demand zone where buyers consistently stepped in. The recent rally originates from this base, indicating possible institutional accumulation.
📌 Critical Horizontal Resistance at $25.80
Price is now testing the $25.80 resistance zone, which historically acted as a supply area. A successful daily close and confirmation above this level would officially flip the structure bullish.
📈 Bullish Scenario – Multi-Level Upside Targets:
If AVAX confirms the breakout above $25.80, these are the key bullish targets ahead:
🎯 Target 1: $28.79 – minor resistance & potential short-term TP zone
🎯 Target 2: $31.09 – previous price equilibrium
🎯 Target 3: $35.66 – key pivot from past market structure
🎯 Target 4: $41.29 and $44.01 – heavy historical supply zones
🎯 Target 5 (measured move): $54.00 to $55.79 – the projected breakout target from the descending triangle pattern
This move would represent a full technical recovery if AVAX aligns with broader market sentiment and Bitcoin remains stable or bullish.
📉 Bearish Scenario – Pullback Risks:
On the flip side, if price fails to sustain above $25.80 and gets rejected:
⚠️ A retest of $24.00 – $22.00 is likely
⚠️ If that zone breaks down, next support lies at $19.00 – $17.00
⚠️ A loss of the $17 level may trigger a return to the critical low near $14.66
This would invalidate the bullish breakout and return AVAX into a sideways or downward consolidation phase.
🔍 Additional Technical Insights:
✅ Volume is steadily increasing — showing renewed buying pressure
✅ Indicators like RSI and MACD (if applied) are likely showing bullish divergence
✅ Overall altcoin sentiment is improving, providing a tailwind for AVAX's potential breakout continuation
🧩 Final Thoughts:
AVAX is at a pivotal moment in its medium-term price structure. The breakout above the long-term downtrend line is a strong technical shift. A confirmed breakout and hold above $25.80 could trigger a multi-week or multi-month rally targeting $40 – $55+.
However, traders should be cautious of possible pullbacks and manage risk accordingly — especially as resistance zones from previous structures are being tested.
#AVAX #AVAXUSDT #CryptoBreakout #TechnicalAnalysis #Altcoins #BullishCrypto #DescendingTriangle #ReversalPattern #AVAXAnalysis
AVAX | Full Analysis Here is the top-down analysis for AVAX as requested 🫡
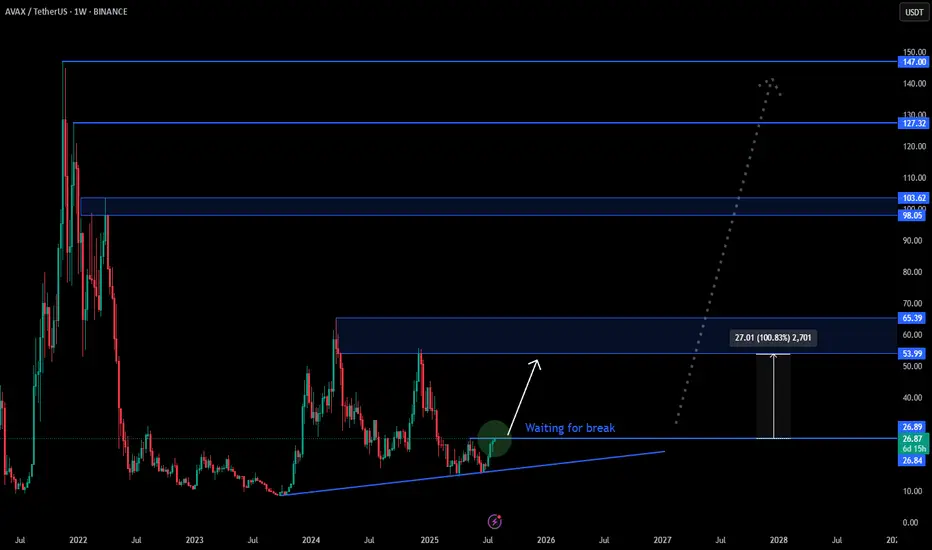
Weekly Timeframe:
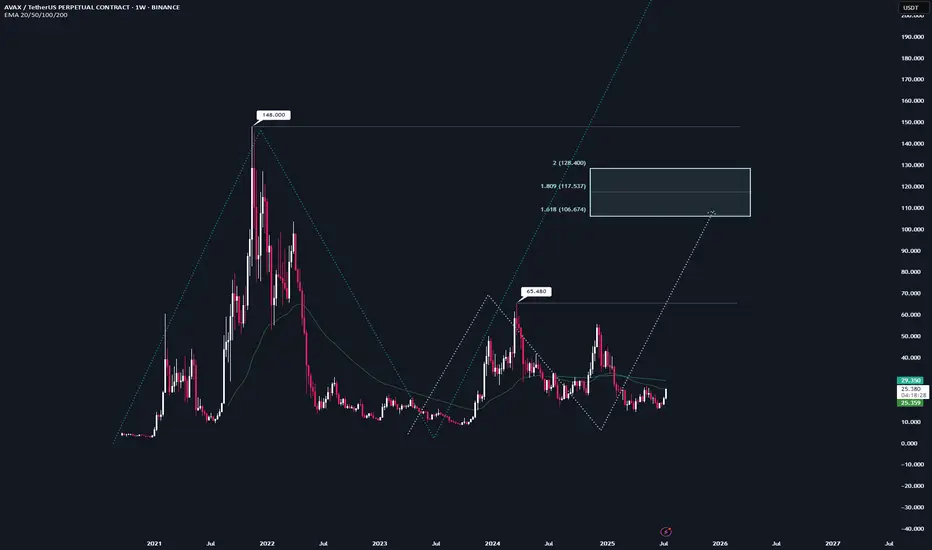
We currently have two potential bullish structures on the weekly chart, but neither has been activated yet.
The first one (light turquoise) will be activated once we break the local high at $65. Until then, there's no valid trade setup. This sequence has it target range at $106–128.
The second structure (turquoise) gets activated once we break the all-time high at $148. It then targets the $242–298 range, which also represents my conservative bull run targets for $AVAX.
On the weekly chart, the strategy is to HODL. I wouldn't buy at this point, and I definitely wouldn't sell—because if we see another altcoin season (which in my view is nearly guaranteed), there's no reason AVAX shouldn't reach its targets around $242.
I would personally start taking profits at $106, then again at $148, and be fully out at $242.
Daily chart:
Here we have a potential structure that will be activated once we break the recent high at $26.
From that point on, according to the rulebook, every pullback into the B–C correction level (Fib 0.5–0.667) becomes a tradable opportunity.
Local Priceaction:
Three days ago, we successfully broke through the bearish reversal zone (red) and reached the bullish target zone (turquoise).
Now, every pullback into the B–C correction area becomes a valid long entry. If the price turns around and reaches that area again, I’ll trade each level with a stop-loss just below the next key level.
--------
Thats the my full Analysis for CRYPTOCAP:AVAX , hope it was helpful if yall have anymore questions feel free to ask, and if you want me to do another analysis for any other pair just comment down below.
Thanks for reading❤️
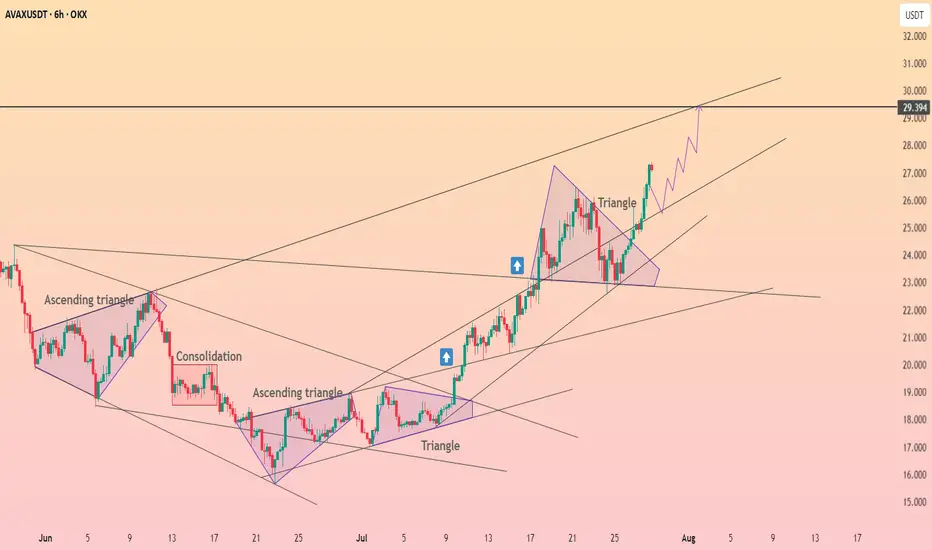
AVAX USDT BreakoutsAvax breaking out of multiple resistances and triangle patterns. Very strong bull action up ahead.
AVAX/USDT Trade Setup (1H Timeframe)🚀 AVAX/USDT Trade Setup (1H Timeframe)
Just entered this trade earlier around 25.03 USDT after seeing good momentum build-up.
Support zone I’m watching: 24.30–24.45, aligned with 1H EMA
Resistance area: 28.00, but I'm locking partials near 26.50 in case it slows down
RSI was still comfy at 66.99, not yet overbought
Volume steady, candles pushing clean = signs of strong trend continuation
Stop loss is at 24.676 for safety if momentum shifts.
📌 Plan:
Trail my stop behind swing lows
Watch RSI — if it hits 80+, I’ll start scaling out
Targeting 2.1 RR ratio, just keeping it consistent
This is not a hype play — price broke structure and retested properly. If volume stays solid, I’m letting it run.
This isn’t financial advice — just sharing what I’m seeing.
**Risk Management First – Not Financial Advice**

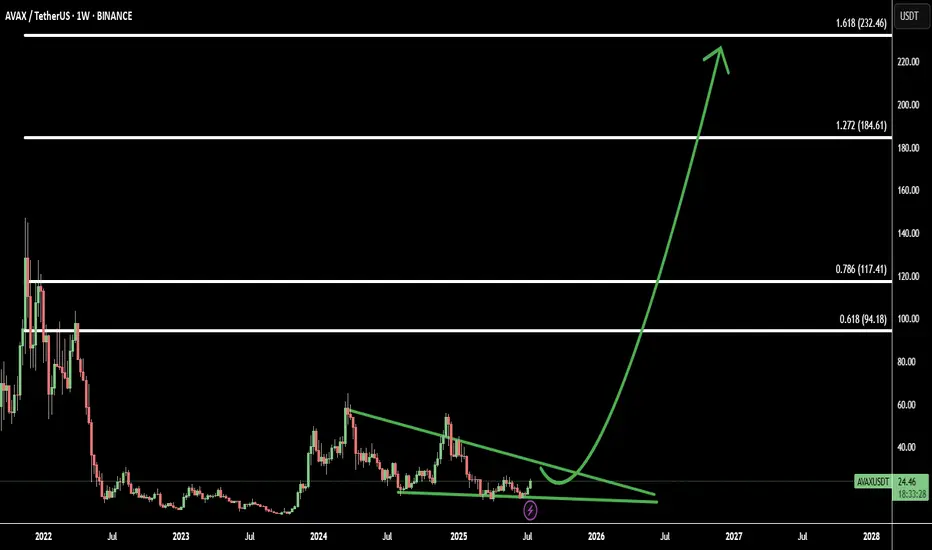
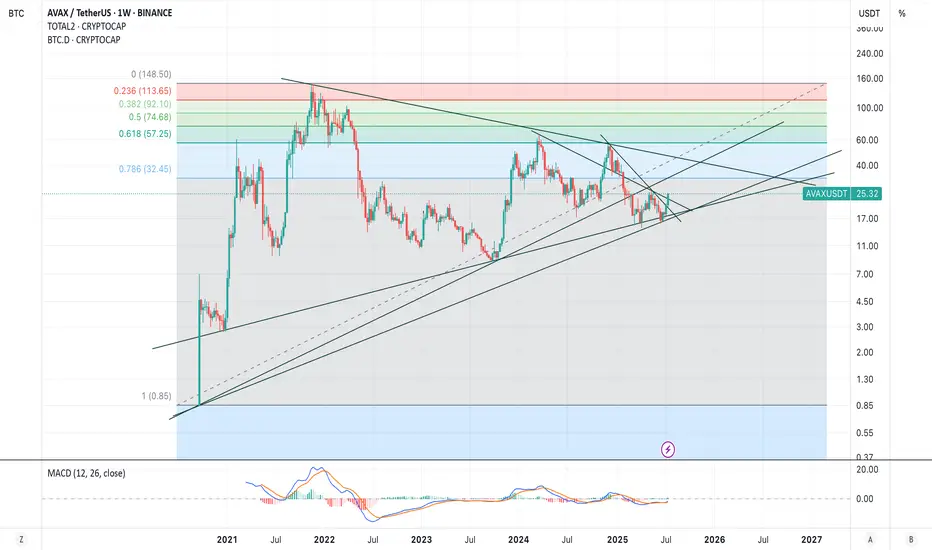
AVAX Breakout from Falling Wedge: Tracking 4 Fibonacci TargetsAvalanche (AVAXUSD) has broken out of a falling wedge pattern on the weekly timeframe, signaling a potential shift from bearish consolidation to a bullish continuation phase. The breakout is a strong technical signal often associated with trend reversals.
Using Fibonacci extensions from the breakout base, I’ve mapped out 4 critical target levels:
Target 1: 0.618 Fib – first major resistance after breakout - 94.18
Target 2: 0.786 Fib – deeper retracement and strong reaction zone - 117.41
Target 3: 1.272 Fib – full extension, potential profit-taking point - 184.61
Target 4: 1.618 Fib – aggressive upside target for extended rally - 232.46
These levels align with historical price structure and may act as magnets for bullish momentum if volume confirms the breakout.