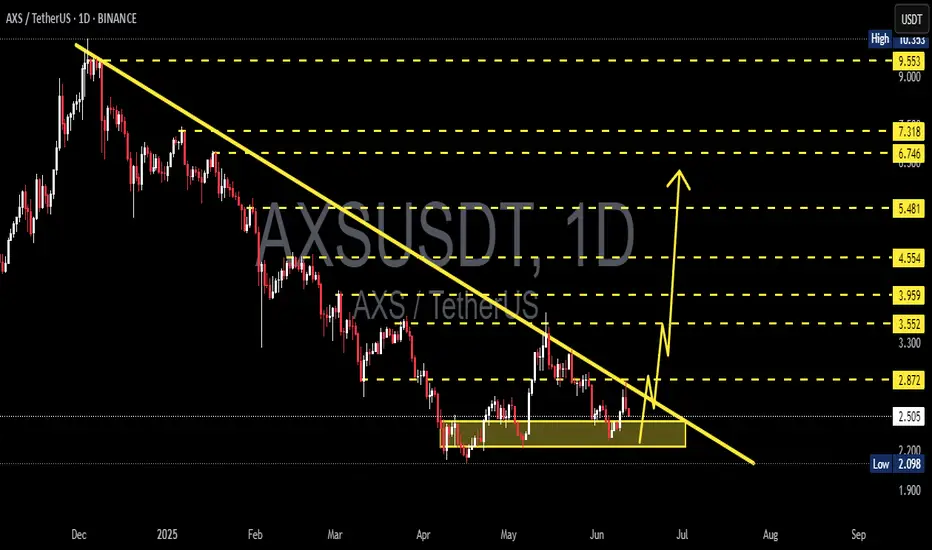
AXSUSDT 1D Analysis AXS ~ 1D Analysis
#AXS Buy gradually from here if you still have confidence in this coin with a short term target of at least 15%++
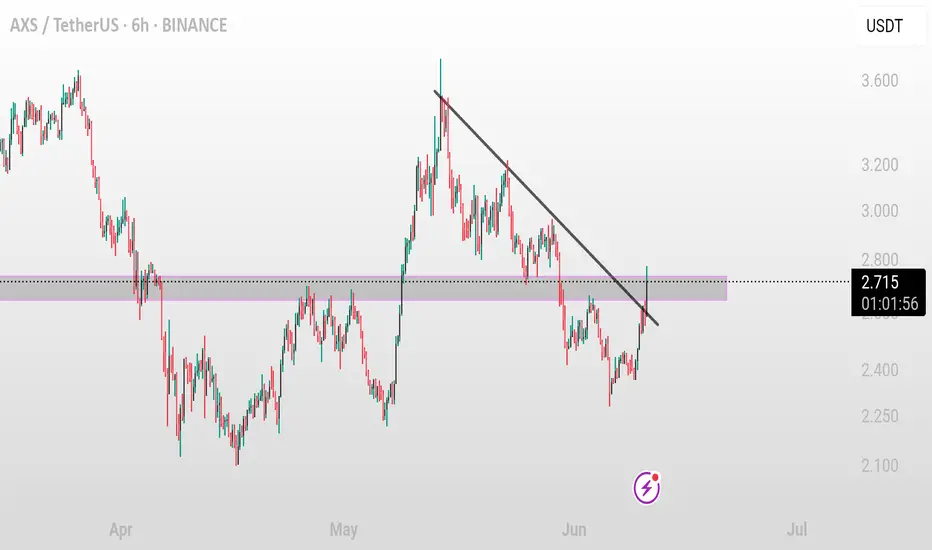
AXS/USDT (6H) – Downtrend Resistance Test in Progress AXS/USDT (6H) – Downtrend Resistance Test in Progress
Pattern: Descending Trendline Breakout
Timeframe: 6-Hour ⏱️
Pair: AXS/USDT 💱
Published: June 11, 2025 📅
Technical Overview:
AXS/USDT is approaching a key descending trendline that has capped price action since early June. Price is testing thi
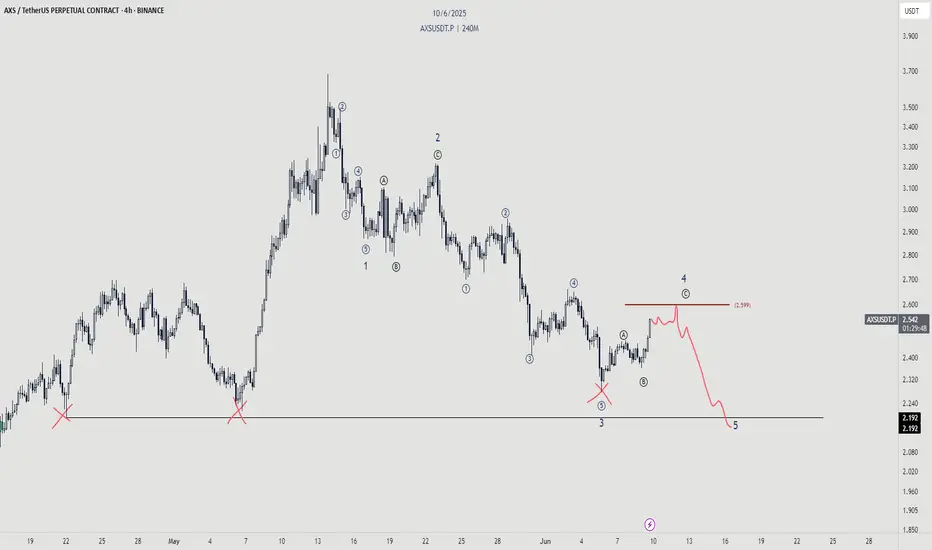
AXS - Dont be faked outWhile the bounce is nice, we should not forget about the real trend here.
We're still bearish overall and there is a shit ton of liquidity to be taken out. Don't be blinded
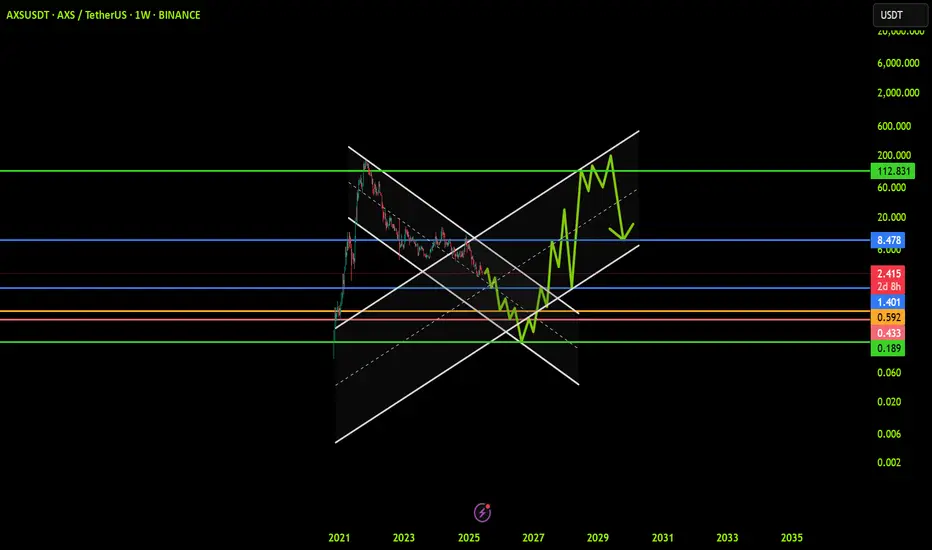
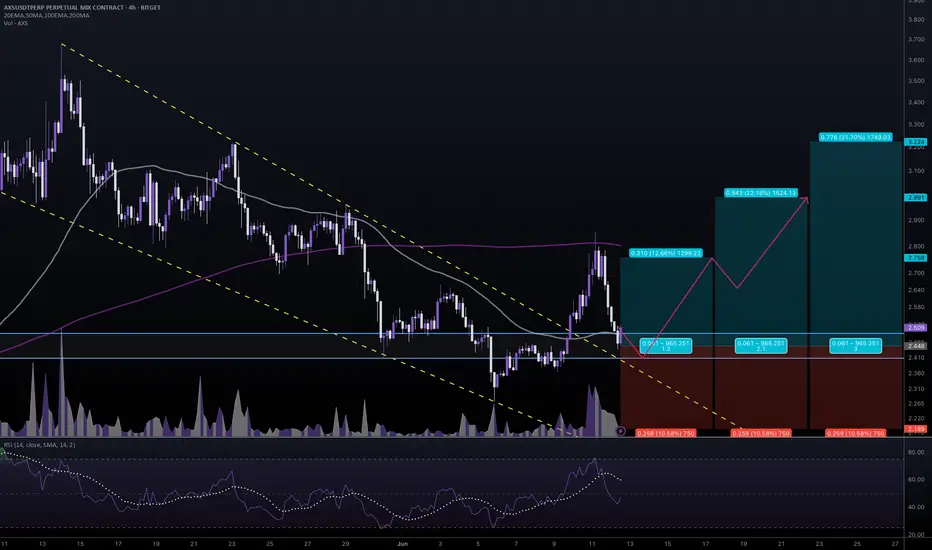
AXSUSDT: Trend in weekly timeframeThe color levels are very accurate levels of support and resistance in different time frames, and we have to wait for their reaction in these areas.
So, Please pay special attention to the very accurate trend, colored levels, and you must know that SETUP is very sensitive.
Be careful
BEST
MT
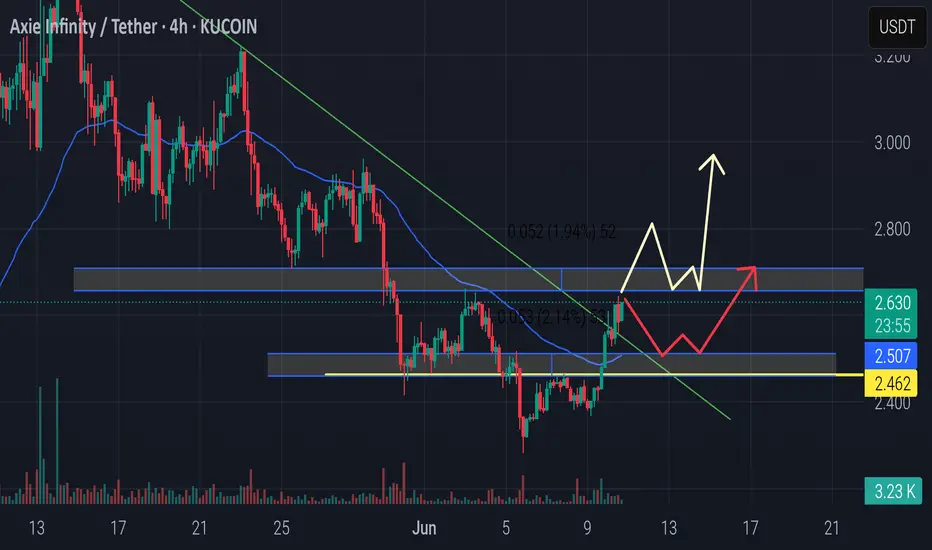
#AXSUSDT #4h (Bitget Futures) Falling wedge breakout and retestAxie Infinity just pulled back to 50MA support where it's bouncing, looks ready for recovery towards 200MA resistance and more.
⚡️⚡️ #AXS/USDT ⚡️⚡️
Exchanges: Bitget Futures
Signal Type: Regular (Long)
Leverage: Isolated (4.0X)
Amount: 4.7%
Current Price:
2.509
Entry Zone:
2.489 - 2.407
Take-Pro
AXSUSDT Analysis AXS is showing signs of a potential breakout after breaking the descending trendline and reclaiming the 50 EMA. Price is currently testing a key resistance zone between 2.62–2.80 USDT.
🟦 Key Levels:
Support: 2.50 – 2.46 USDT
Resistance: 2.62 – 2.80 USDT
🔀 Two Possible Scenarios: ✅ Bullish: Pric
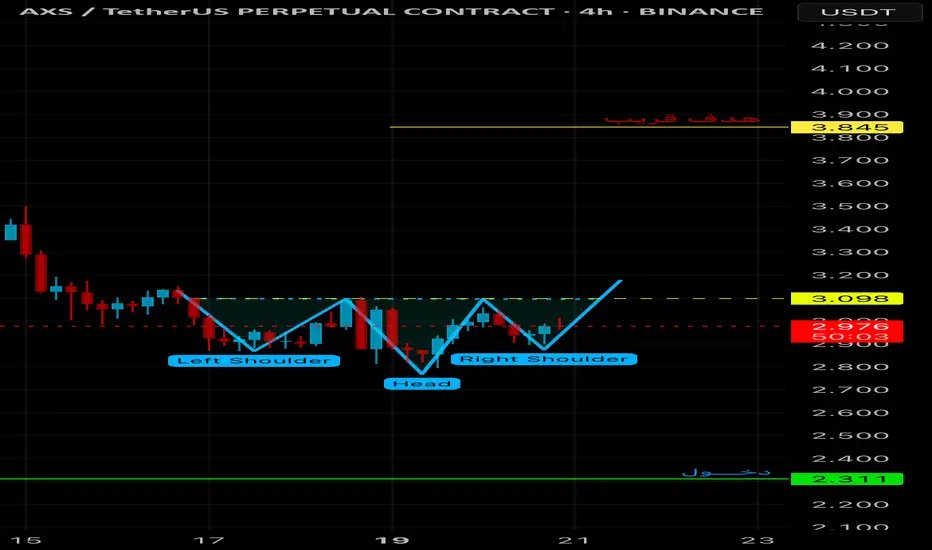
AXSFor the pattern to be a buy signal, the neckline must be breached with a candle closing above it. In the image, the breakout has not yet occurred; the price is still below the neckline, so the pattern cannot be confirmed yet.📊
AXS LONG RESULT AXS price experience a sharp Bearish dump after failing to break the Resistance Zone of $3.9, In time has been trading within a symmetrical triangle pattern, with the major Support Trendline in Confluence.
So I decided to Take a Short position from the minor resistance to the major Support zone as
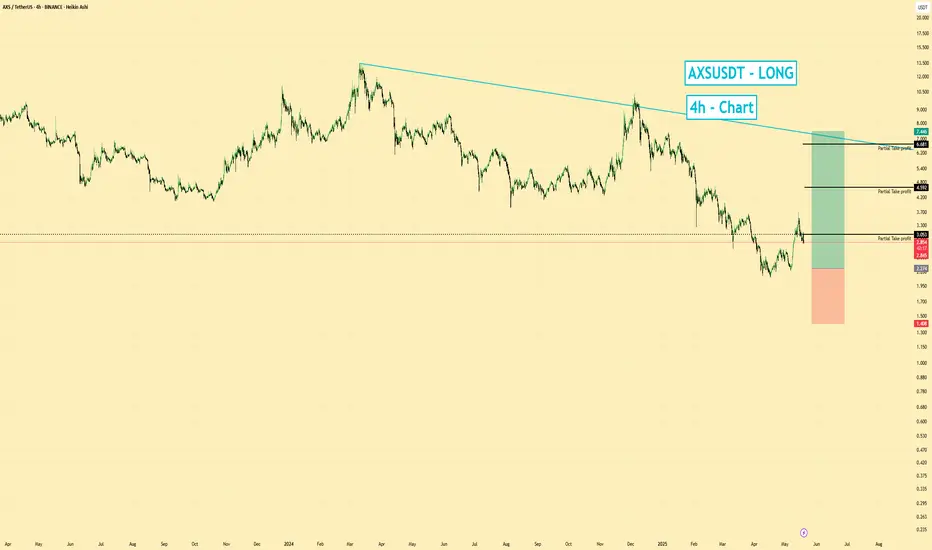
AXSUSD | LONG | NFT Gaming Bounce| (May 19, 2025)AXSUSD | LONG | NFT Gaming Bounce + Short Squeeze Potential | (May 19, 2025)
1️⃣ Insight Summary:
AXS, the token behind Axie Infinity, is setting up for a potential short squeeze. With NFT gaming interest reviving and key support holding, a move higher could unfold soon.
2️⃣ Trade Parameters:
Bias
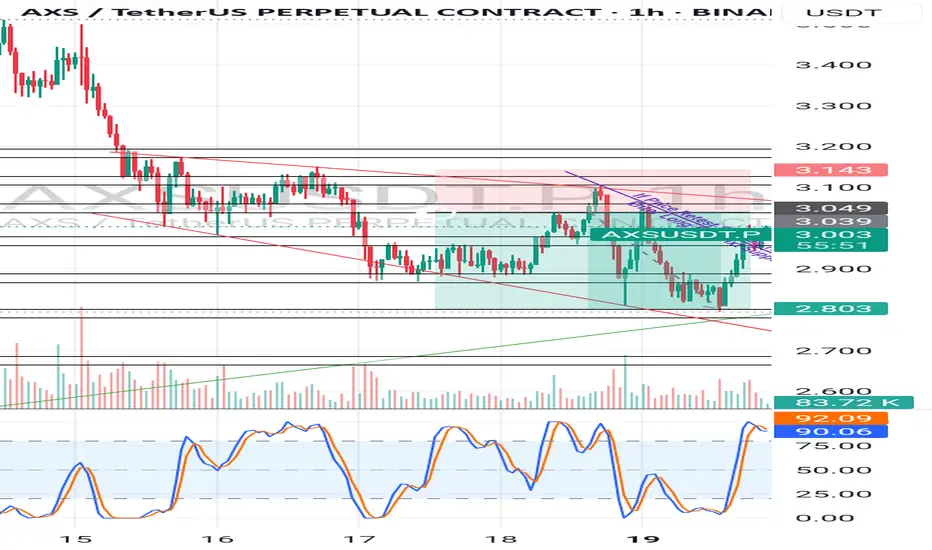
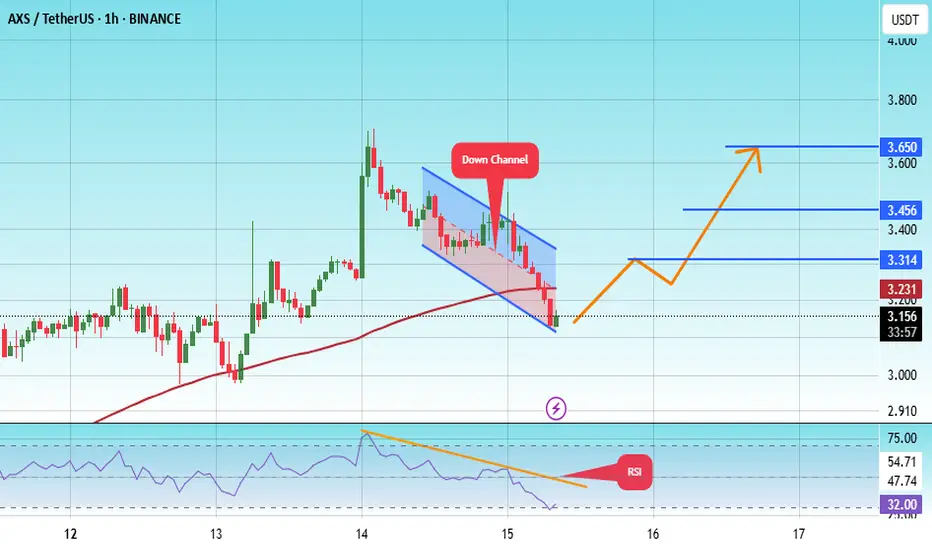
#AXS/USDT#AXS
The price is moving within a descending channel on the 1-hour frame, adhering well to it, and is heading for a strong breakout and retest.
We are seeing a bounce from the lower boundary of the descending channel, which is support at 3.11.
We have a downtrend on the RSI indicator that is abou
See all ideas
Summarizing what the indicators are suggesting.
Oscillators
Neutral
SellBuy
Strong sellStrong buy
Strong sellSellNeutralBuyStrong buy
Oscillators
Neutral
SellBuy
Strong sellStrong buy
Strong sellSellNeutralBuyStrong buy
Summary
Neutral
SellBuy
Strong sellStrong buy
Strong sellSellNeutralBuyStrong buy
Summary
Neutral
SellBuy
Strong sellStrong buy
Strong sellSellNeutralBuyStrong buy
Summary
Neutral
SellBuy
Strong sellStrong buy
Strong sellSellNeutralBuyStrong buy
Moving Averages
Neutral
SellBuy
Strong sellStrong buy
Strong sellSellNeutralBuyStrong buy
Moving Averages
Neutral
SellBuy
Strong sellStrong buy
Strong sellSellNeutralBuyStrong buy
Displays a symbol's price movements over previous years to identify recurring trends.