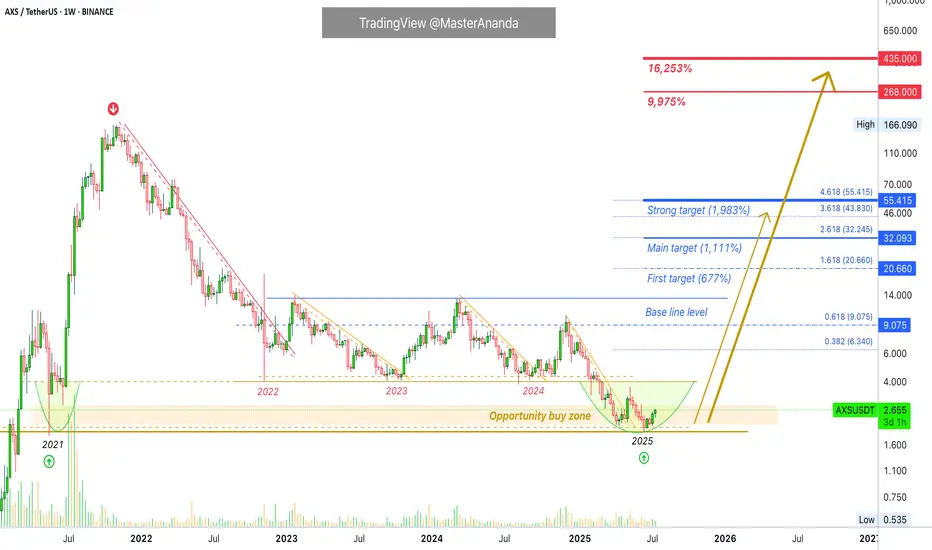
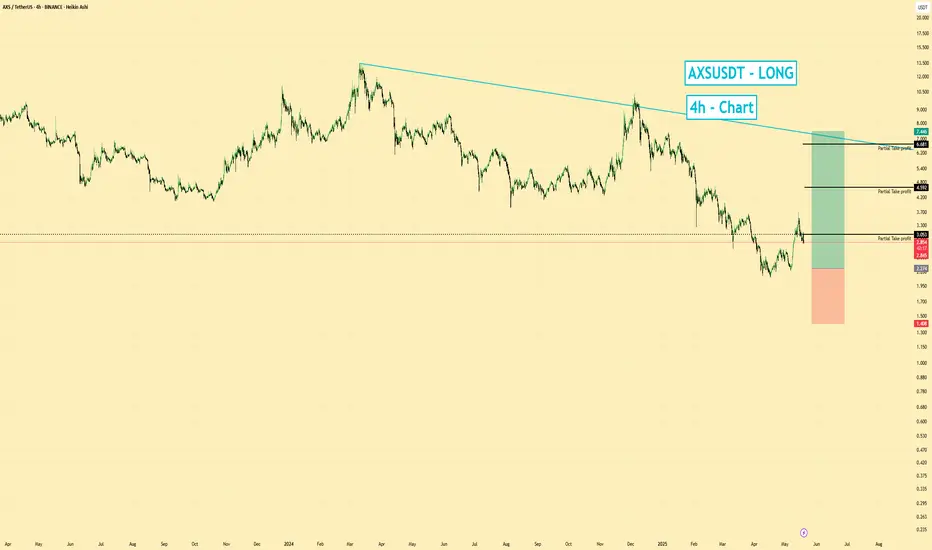
Axie Infinity Trades Within Opportunity Buy Zone · (PP: 16,253%)Right now Axie Infinity is trading within the "opportunity buy zone," this is a level just below the support zone from 2024, 2023 and 2022. It is trading in this zone searching for liquidity. Once this move is over, AXSUSDT will never be available at these prices in the future. The lowest will be the long-term support zone from 2022-2024.
Can Axie Infinity hit a new all-time high in 2025 or 2026? It is possible. But, in this chart setup and analysis we are focusing on high probability conservative targets.
"Back to baseline" is the very easy target. The first target after that sits around $20 for 677%. The main target goes higher, $32 for 1,111%. A strong target is $55 and this one opens up 1,983% profits potential.
A new all-time high can be $268 & $435. Really huge numbers. Just to give you an idea, the second one would be equal to 16,253% profits potential. The first one, $268 would be equal to 9,975%. This is theoretically possible so I don't want to commit to it but is good to keep an open mind with market conditions improving at the speed of light. If we can say there is such a thing.
Technical analysis
The bottom in 2025 matches the mid-way stop of the 2021 bull market. So this is an interesting and valid zone for a reversal.
We don't need to go any deeper in looking for reversal signals because a marketwide bullish bias is already confirmed. We've been bullish since 7-April 2025. Some pairs move first others later though and that's why some are already very high while others are very low. This is good because it gives us time to adapt to the market. If everything were to move together at the same time on the same date, it would be too late to buy anything low. Because the market cycles through different sectors, groups and pairs, we can buy the ones that are low now knowing that they will eventually move ahead. Everything grows. Everything will grow. The 2025 bull market is already confirmed.
Thanks a lot for your continued support.
Namaste.
AXSUSDT trade ideas
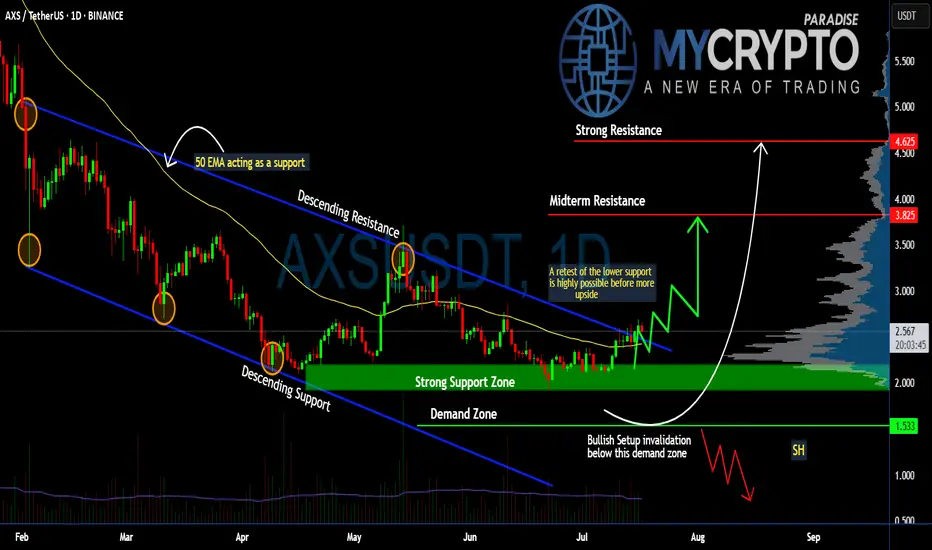
Can #AXS Bulls Sustain the Momentum or Will it Fall? Key LevelsYello, Paradisers! Will #AXS finally deliver a strong upside move, or are we just seeing another setup to trap impatient bulls before a deeper drop? Let’s break down the latest #AXSUSDT structure:
💎After months inside a descending channel, #AxieInfinity has finally broken above the descending resistance, showing early signs of a potential trend reversal. The current price trades around $2.56, but history tells us a retest of lower levels is still highly possible before any sustained upside move. The soaring volume and a positive broader market outlook reinforce our bullish bias.
💎The structure is clear: the strong support zone sits between $2.20–$2.00, and this is the first critical level to watch. A healthy retest here would provide a high-probability continuation setup for bulls. Below that, the demand zone at $1.53 is the last stronghold—losing this level would invalidate the bullish scenario completely.
💎If buyers maintain control, the first upside target stands at the midterm resistance of $3.82, where some profit-taking and selling pressure are expected. A clean breakout above this zone could push the price toward the strong resistance at $4.62, where major distribution could occur.
💎However, the bullish setup becomes invalid if #AXSUSD loses the $1.53 demand zone. A confirmed daily close below this level would flip the structure bearish and open the door for a move to new lows.
Stay patient, Paradisers. Let the breakout confirm, and only then do we strike with conviction.
MyCryptoParadise
iFeel the success🌴
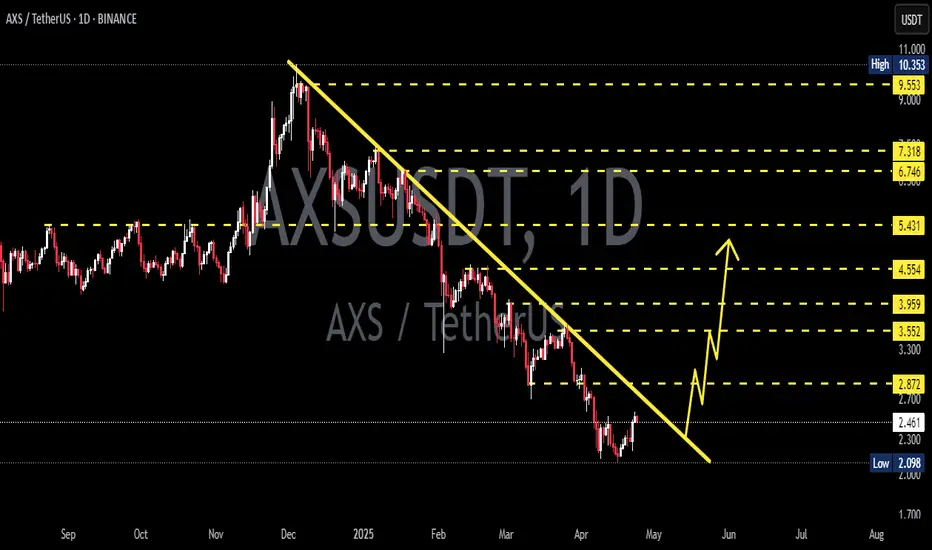
AXS - We are on support, next rocket 180%At the moment, the price is in the testing zone of the lower boundary of the descending channel. This is a critical level that will determine the further direction of movement. If the price bounces off the support, we can expect an upward correction. If the price breaks through the support, we should expect a further fall.
Recommended signal: Waiting for confirmation of the breakout of the lower boundary of the channel to enter shorts or a rebound from support to enter longs.
Price range forecast for the next 3 days: 1.50–2.30 USDT.
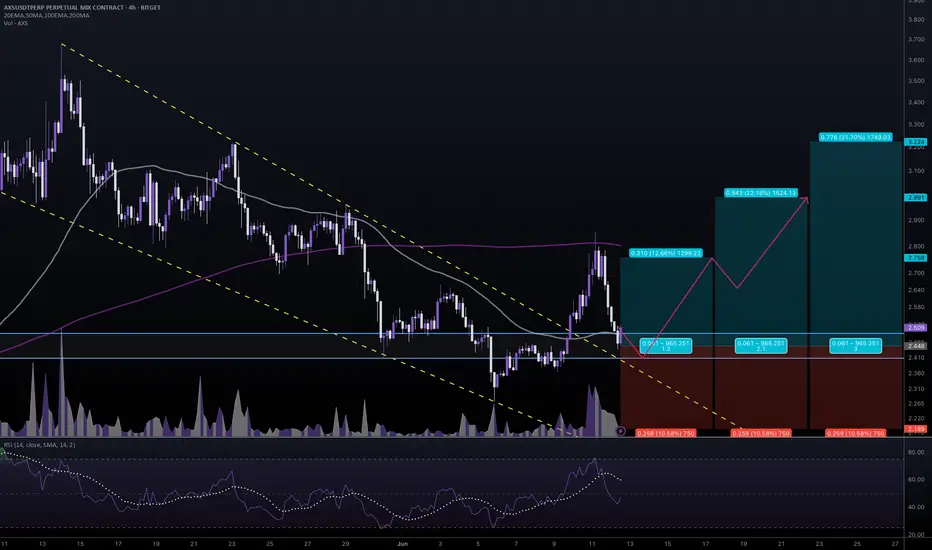
#AXSUSDT #4h (Bitget Futures) Falling wedge breakout and retestAxie Infinity just pulled back to 50MA support where it's bouncing, looks ready for recovery towards 200MA resistance and more.
⚡️⚡️ #AXS/USDT ⚡️⚡️
Exchanges: Bitget Futures
Signal Type: Regular (Long)
Leverage: Isolated (4.0X)
Amount: 4.7%
Current Price:
2.509
Entry Zone:
2.489 - 2.407
Take-Profit Targets:
1) 2.758
2) 2.991
3) 3.224
Stop Targets:
1) 2.189
Published By: @Zblaba
NYSE:AXS BITGET:AXSUSDT.P #4h #AxieInfinity #P2E axieinfinity.com
Risk/Reward= 1:1.2 | 1:2.1 | 1:3.0
Expected Profit= +50.7% | +88.7% | +126.8%
Possible Loss= -42.3%
Estimated Gaintime= 1-2 weeks
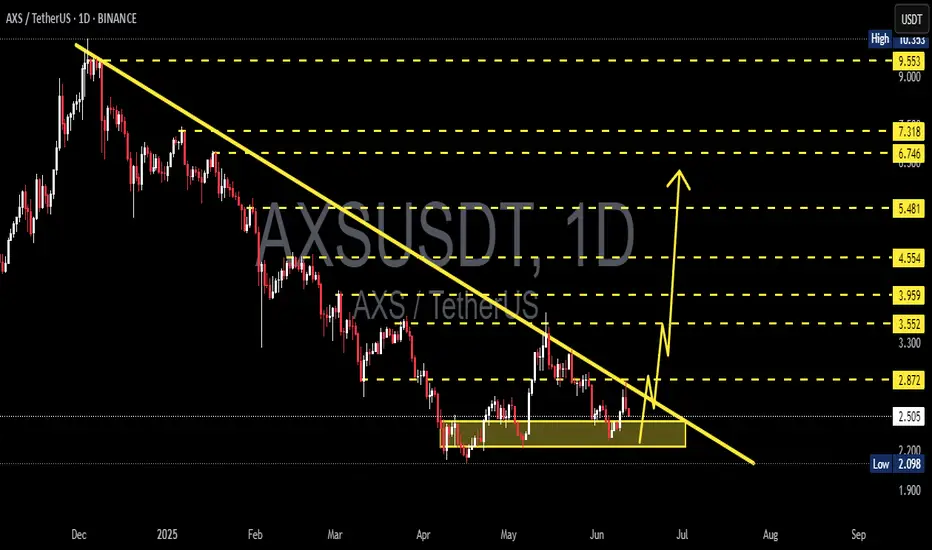
AXSUSDT 1D Analysis AXS ~ 1D Analysis
#AXS Buy gradually from here if you still have confidence in this coin with a short term target of at least 15%++
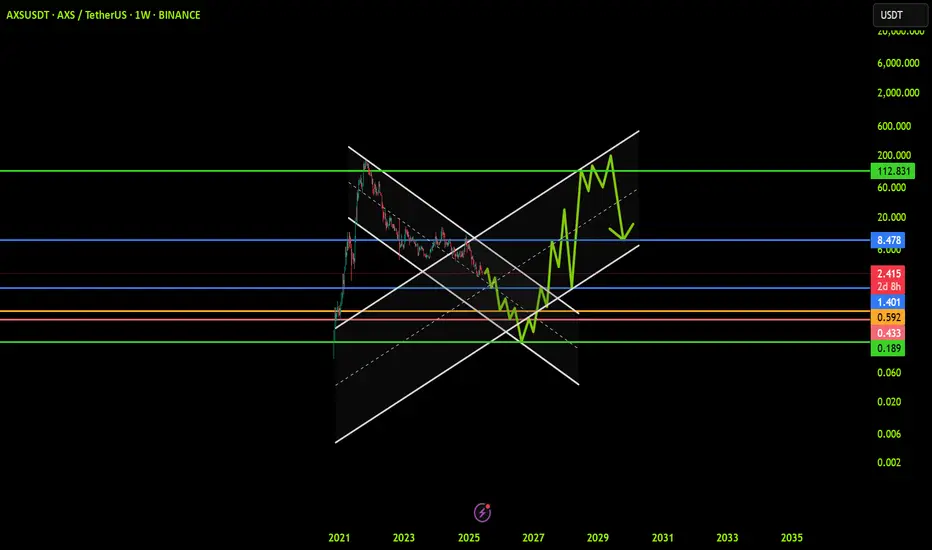
AXSUSDT: Trend in weekly timeframeThe color levels are very accurate levels of support and resistance in different time frames, and we have to wait for their reaction in these areas.
So, Please pay special attention to the very accurate trend, colored levels, and you must know that SETUP is very sensitive.
Be careful
BEST
MT
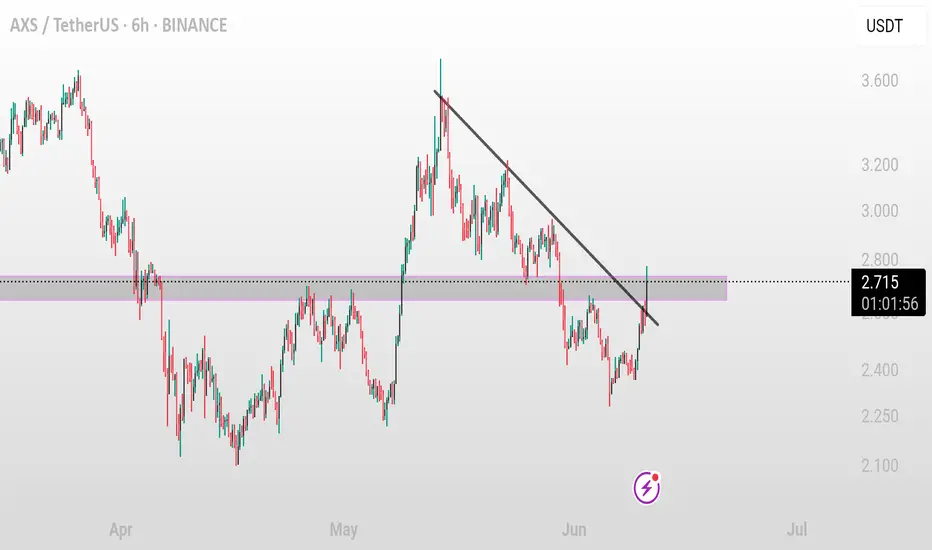
AXS/USDT (6H) – Downtrend Resistance Test in Progress AXS/USDT (6H) – Downtrend Resistance Test in Progress
Pattern: Descending Trendline Breakout
Timeframe: 6-Hour ⏱️
Pair: AXS/USDT 💱
Published: June 11, 2025 📅
Technical Overview:
AXS/USDT is approaching a key descending trendline that has capped price action since early June. Price is testing this dynamic resistance and showing signs of potential breakout momentum 📈
Potential Trade Setup:
Bullish Scenario ✅
Entry: On breakout and 6H candle close above 2.800–2.850
Targets:
* TP1: 3.000–3.100 🎯
* TP2: 3.300–3.400 🎯
Stop-loss: Below 2.600–2.650 🛑
Risk Management ⚠️
Wait for volume confirmation to avoid fakeouts. Rejection at the trendline could lead to more downside or consolidation.
Conclusion:
AXS is at a critical resistance zone. A clean breakout above the trendline may lead to a bullish reversal and upside continuation 📊🔍
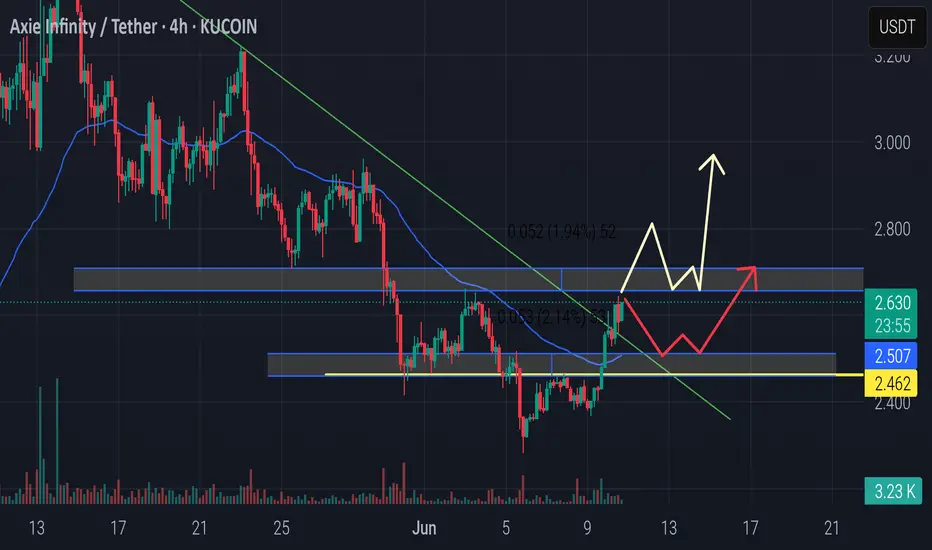
AXSUSDT Analysis AXS is showing signs of a potential breakout after breaking the descending trendline and reclaiming the 50 EMA. Price is currently testing a key resistance zone between 2.62–2.80 USDT.
🟦 Key Levels:
Support: 2.50 – 2.46 USDT
Resistance: 2.62 – 2.80 USDT
🔀 Two Possible Scenarios: ✅ Bullish: Price holds above support and breaks through 2.80 → potential rally toward 3.00+ ❌ Bearish: Rejection from resistance → retest of support around 2.50 → possible breakdown if support fails
🔄 Waiting for a confirmed retest or breakout for the next move.
📊 Plan your trades, manage your risk.
#AXS #AxieInfinity #CryptoTrading #TA #Altcoins #TradingView #PriceAction #BreakoutSetup
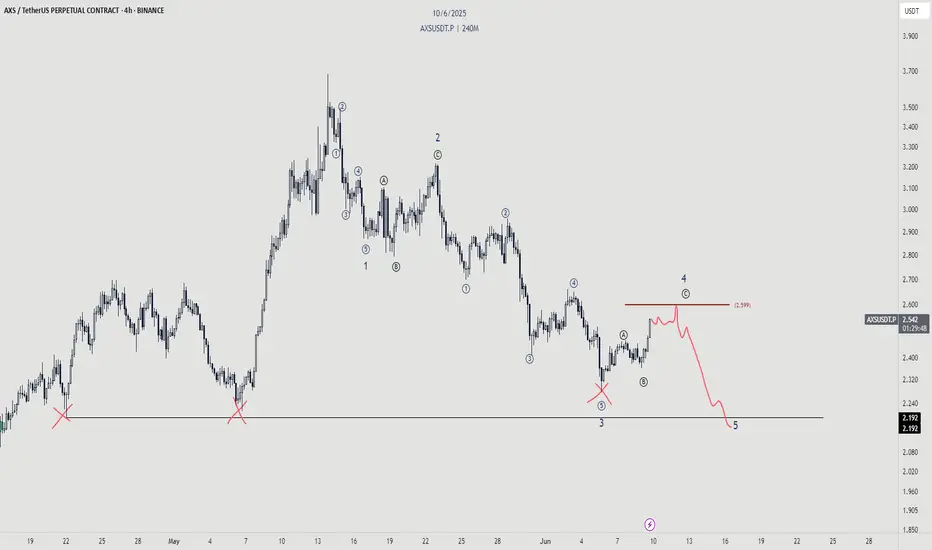
AXS - Dont be faked outWhile the bounce is nice, we should not forget about the real trend here.
We're still bearish overall and there is a shit ton of liquidity to be taken out. Don't be blinded
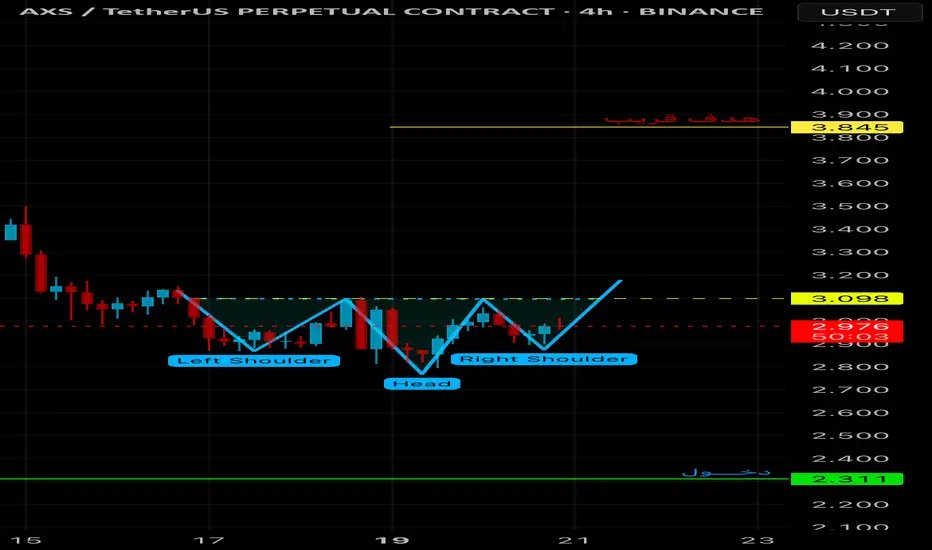
AXSFor the pattern to be a buy signal, the neckline must be breached with a candle closing above it. In the image, the breakout has not yet occurred; the price is still below the neckline, so the pattern cannot be confirmed yet.📊
AXS LONG RESULT AXS price experience a sharp Bearish dump after failing to break the Resistance Zone of $3.9, In time has been trading within a symmetrical triangle pattern, with the major Support Trendline in Confluence.
So I decided to Take a Short position from the minor resistance to the major Support zone as TP, which price has respected beautifully and is now showing signs of reversal.
AXSUSD | LONG | NFT Gaming Bounce| (May 19, 2025)AXSUSD | LONG | NFT Gaming Bounce + Short Squeeze Potential | (May 19, 2025)
1️⃣ Insight Summary:
AXS, the token behind Axie Infinity, is setting up for a potential short squeeze. With NFT gaming interest reviving and key support holding, a move higher could unfold soon.
2️⃣ Trade Parameters:
Bias: Long
Entry: Around $2.27
Stop Loss: $1.40
TP1: $3.00
TP2: $4.59
TP3 (Extended Target): $6.68
Setup Trigger: Watching for confirmation of breakout above $2.27 area — potential for straight-angle move forming on the daily timeframe
3️⃣ Key Notes:
🎮 Fundamental Context: AXS is the native token of the Axie Infinity ecosystem, built by Sky Mavis. It was one of the earliest and most notable play-to-earn NFT games, allowing players to collect, trade, and battle digital creatures called Axies (NFTs).
🏦 Use Cases: AXS is used for governance, staking, and in-game currency.
🤝 Backers & Partners: Backed by firms like a16z, Binance, and partnerships with esports orgs like Cloud9.
⚔️ Challenges: Economic sustainability and competition from platforms like The Sandbox and Gala Games.
📉 Technical View: Currently moving in a sharp angled pattern on the daily chart. A confirmed breakout above $2.27 could trigger a long squeeze up toward $3 and beyond.
4️⃣ Follow-up Note:
I’ll keep an eye on this and may post updates if we break through the first level or if sentiment shifts. Let me know if you want a chart overlay or trade tracking template.
Please LIKE 👍, FOLLOW ✅, SHARE 🙌 and COMMENT ✍ if you enjoy this idea! Also share your ideas and charts in the comments section below! This is best way to keep it relevant, support us, keep the content here free and allow the idea to reach as many people as possible.
Disclaimer: This is not a financial advise. Always conduct your own research. This content may include enhancements made using AI.
#AXS/USDT#AXS
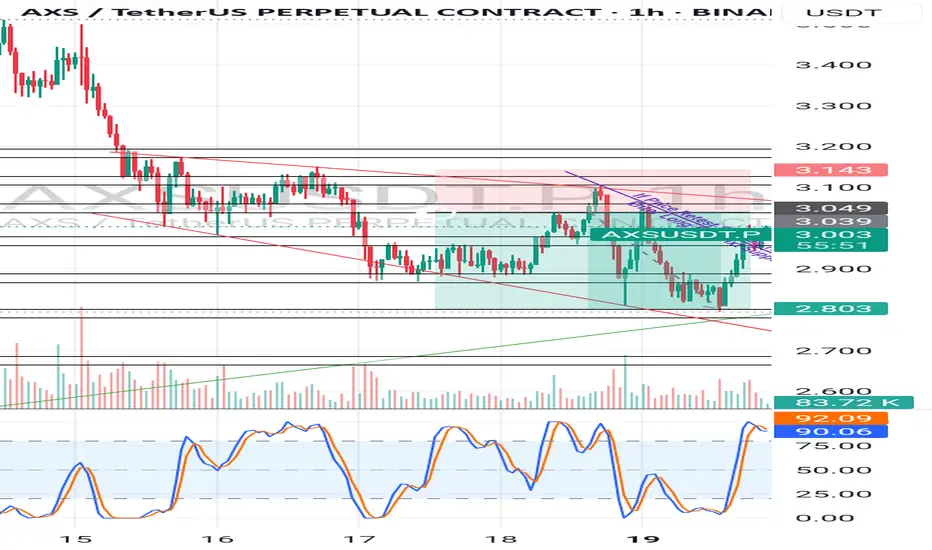
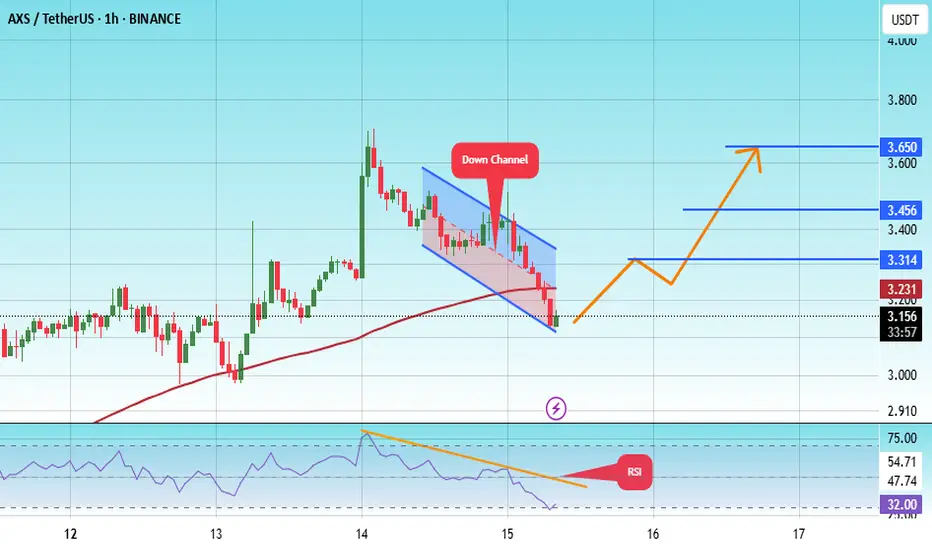
The price is moving within a descending channel on the 1-hour frame, adhering well to it, and is heading for a strong breakout and retest.
We are seeing a bounce from the lower boundary of the descending channel, which is support at 3.11.
We have a downtrend on the RSI indicator that is about to be broken and retested, supporting the upward trend.
We are looking for stability above the 100 Moving Average.
Entry price: 3.16
First target: 3.23
Second target: 3.45
Third target: 3.65
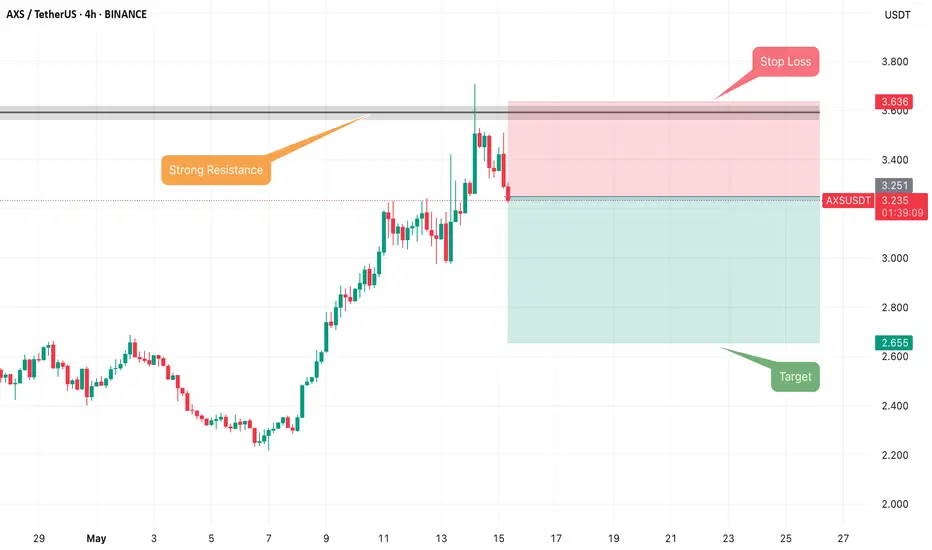
AXS USDT SHORT POSITION SETUPAXS/USDT is currently facing strong resistance, with a high probability of a downward price move. Additionally, the 100 EMA is acting as a strong resistance on the 4-hour timeframe.
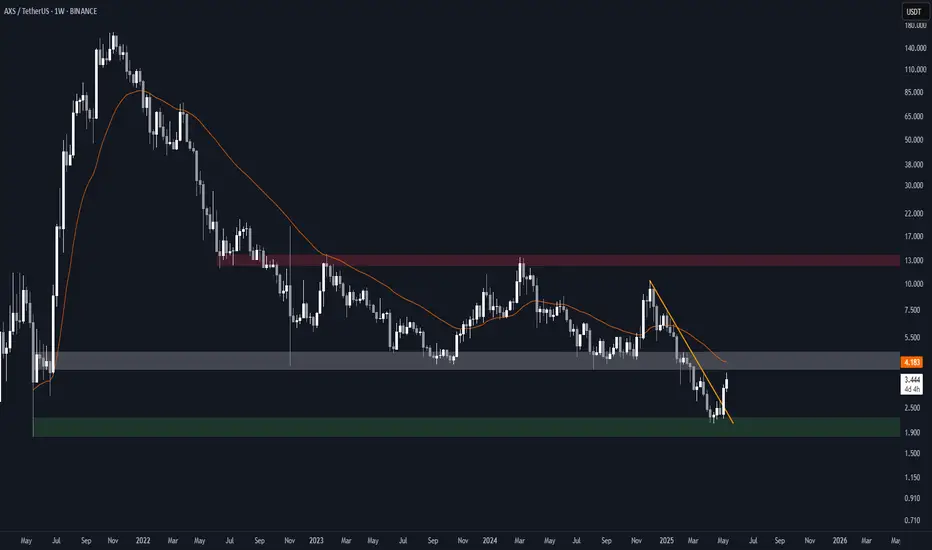
Axie (AXS) Structure Analysis (1W - Log)After retesting the ~$2.0 demand zone, BINANCE:AXSUSDT broke out of its recent downtrend and could be headed for an attempt to reclaim the ~$4.0 S/R.
Key Levels to Watch
• ~$2.0: Demand zone dating back to May 2021, and current support. Any sustained break below it would invalidate any bullish TA.
• ~$4.0: Previous multi-year key support, and likely a strong resistance. Reclaiming it would flip the bias to bullish. It also aligns with the 200-day EMA, which has been very relevant for AXS in the past.
• ~$13.0: Multi-year S/R, and a reasonable target if ~$4.0 is reclaimed.
Still in a No-Trade Zone for me, until ~$4.0 is successfully reclaimed.
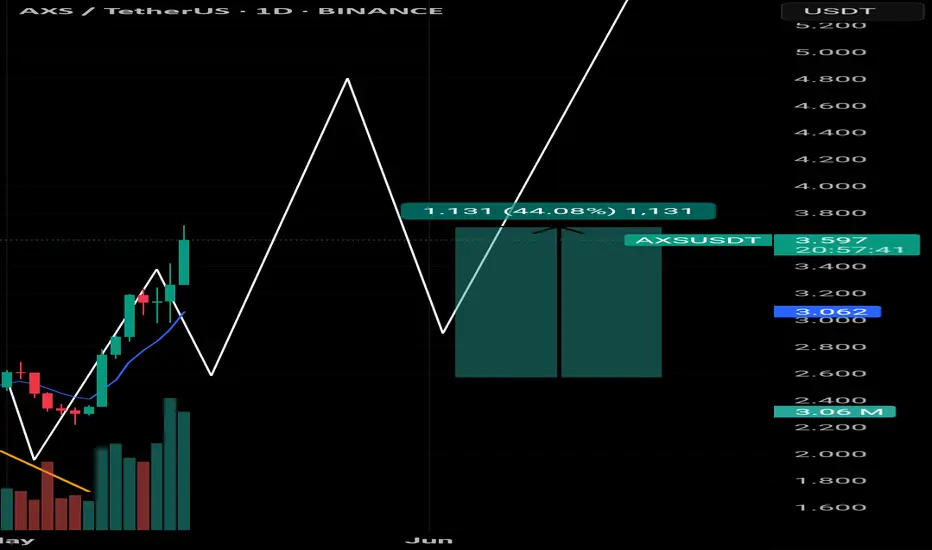
$AXS Breakout & 44% Pump:
AXS broke out of the falling wedge and surged 44%, confirming a strong bullish reversal.
🔸 Key Support at $3.05 – $3.10:
This zone may be retested. Holding above it keeps the bullish trend intact.
🔸 Upside Target: $4.80 – $5.20
Next leg up could push toward $5+ if momentum continues.
🔸 Risk Level: $2.98
Break below this invalidates the bullish setup.
🔸 Action Plan:
Look for entries near $3.10–$3.30 on pullbacks. Watch for bullish confirmation before riding toward higher targets.
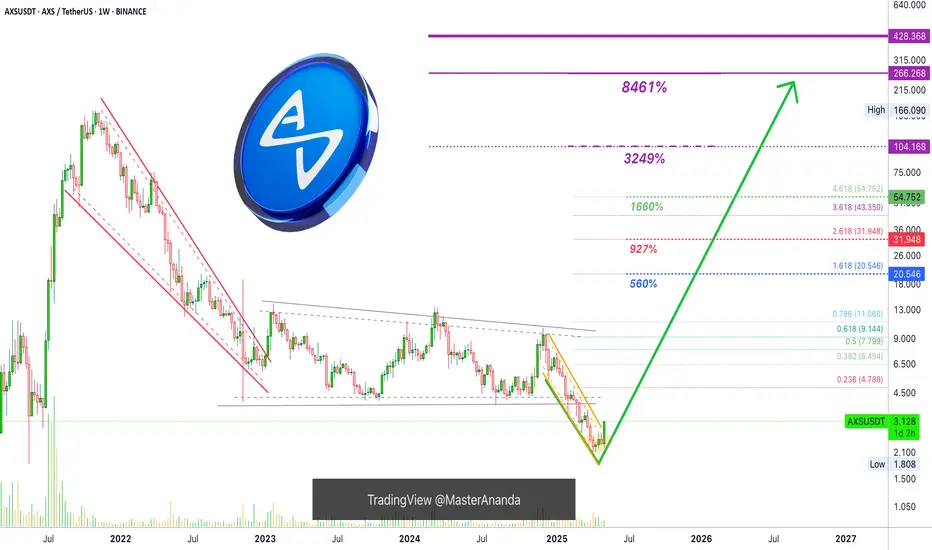
Can Axie Infinity Grow 8,000%? Let's Ask The ChartAxie Infinity is recovering from a final flush episode this week. The action just turned green after AXSUSDT hit the lowest price in 4 years, since May 2021.
First, it is still early for buyers and Cryptocurrency traders. Why? Because the action is happening at bottom prices. Just look at the chart, truly low prices as AXSUSDT is still trading below its 3-Feb. low but recovered above its March low already.
The recovery above the 10-March 2025 low within a single candle reveals that the bottom is already in. The final drop, which was a strong shakeout or stop-loss hunt event, not a bearish impulse, is over.
On the left side we can see the bear market wave. It lasted an entire year from November 2021 through November 2022.
This bear market is followed by a neutral-sideways market. This is the transition period.
Now the market is set to turn ultra-bullish but before this bullish cycle there is one final shakeout and that's the drop from December 2024 until April 2025. This move is intended to activate the stop-loss of thousands of traders. Once these people sell lower than what they bought, the market changes course. This is why I do not recommend using a limit stop-loss.
As soon as the multi-year low is hit, the market turns green. This is what is happening now, just watch! Axie Infinity is set to grow long-term.
Buy low to sell high.
Never set a stop-loss limit order on an exchange, it is a recipe for disaster. It is better to wait patiently because the market will recover and will produce strong, sustained, long-term growth.
I have two set of targets, the easy-local targets and the "global" targets.
The easy targets are 560%, 927% and 1,660%. The global targets include the potential for a new All-Time High. We will have to wait and see. I don't know of these purple targets will hit, but is good to be prepared.
Hope for the best and prepare for the best.
Thank you for reading.
Namaste.
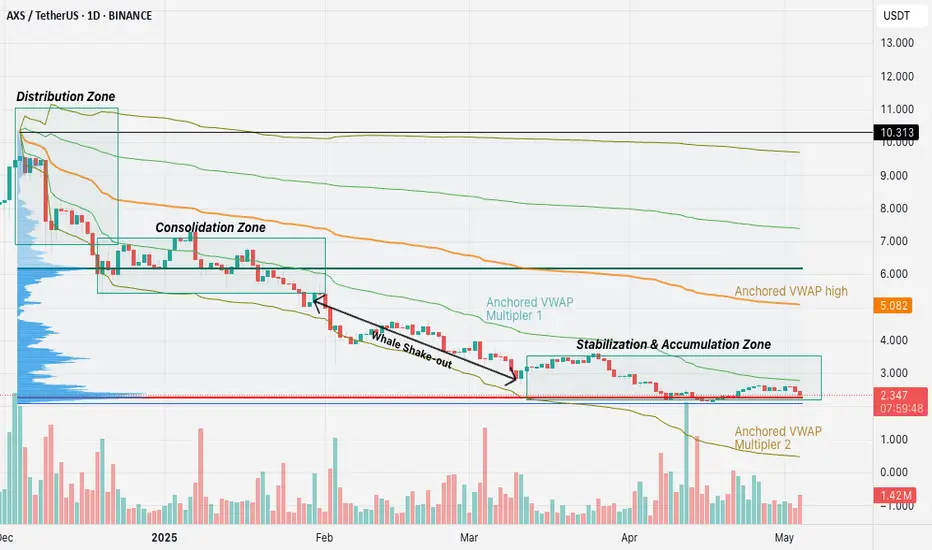
AXS/USDT: Whale Driven Distribution, Shakeout, and AccumulationAXS/USDT Daily (Dec 2024–May 2025):
Price dropped from $10 to $2, driven by whale distribution and now whale accumulation at the $2–$3 levels. This is based on developing high volume node indicating high trading activity.
Whales sold into FOMO in Dec 2024, triggered panic sells during Feb–Apr 2025, and are buying at current support.
Watch for a bounce toward $5 (VWAP resistance) if volume turns green, or a drop to $2.000 if support fails.
Monitor #axs sentiment on X.com for confirmation. A call for lower prices, lack of interest, fear and general panic in the community, will signal the true bottom!

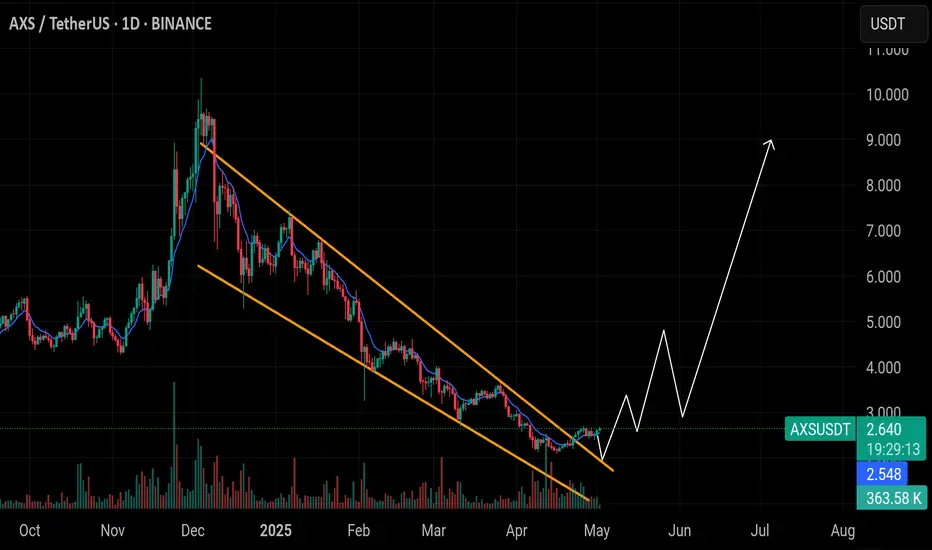
$AXS Breakout from Falling Wedge Pattern
AXS has successfully broken out of a falling wedge pattern on the daily chart — a bullish reversal signal. Price is currently at $2.643 with initial momentum gaining above key resistance.
🔸 Key Support Zone at $2.55:
The $2.55 level is now acting as solid support after the breakout. This level must hold to maintain bullish momentum.
🔸 Upside Target: $9.50 – $10.00
Post-breakout projections indicate a potential upside towards $10 if volume continues to support the move.
🔸 Risk Level at $2.30:
A breakdown below $2.30 would invalidate the bullish scenario and put the price back in a bearish structure.
🔸 Action Plan:
Look for a retest of the breakout zone around $2.55–$2.60 as a potential long entry. Monitor volume and candle structure for confirmation. Mid-term targets lie around $4.00, $6.00, and $10.00.
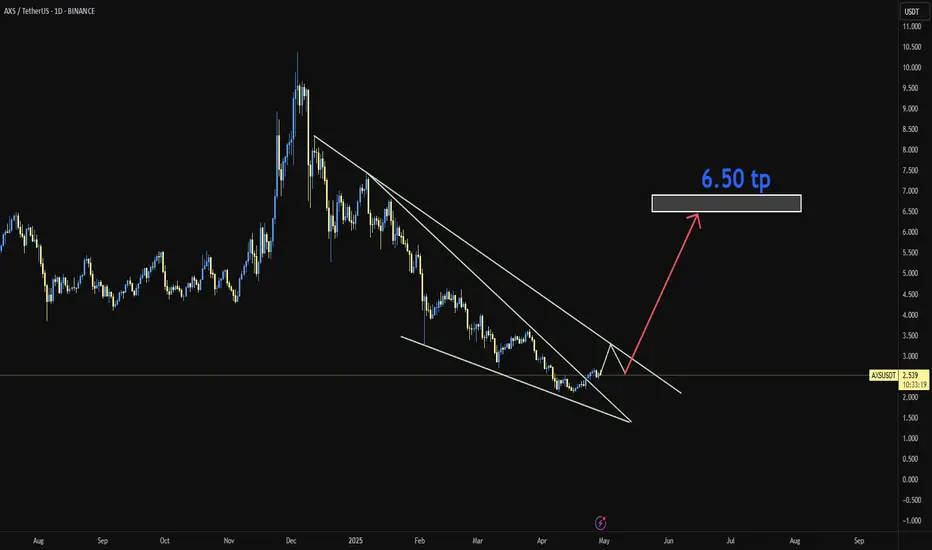
AXS/USDT
AXS has been trading within a falling wedge pattern—a classic bullish reversal setup. Recently, the price broke above the upper resistance line of the wedge, indicating a potential trend reversal.
This breakout is supported by a long-term downtrend losing momentum, and a breakout confirmation through a retest may be forming. If the breakout holds, we could see a bullish move toward the next key resistance zone around 6.50 USDT, which is our primary target.
📌 Setup Summary:
Pattern: Falling Wedge (Bullish)
Breakout: Confirmed
Target: 6.50 USDT (TP)
Risk Management: Watch for price action near the retest zone
This setup aligns with our smart bot strategy which identifies breakout patterns and entry points automatically. Stay tuned for updates!
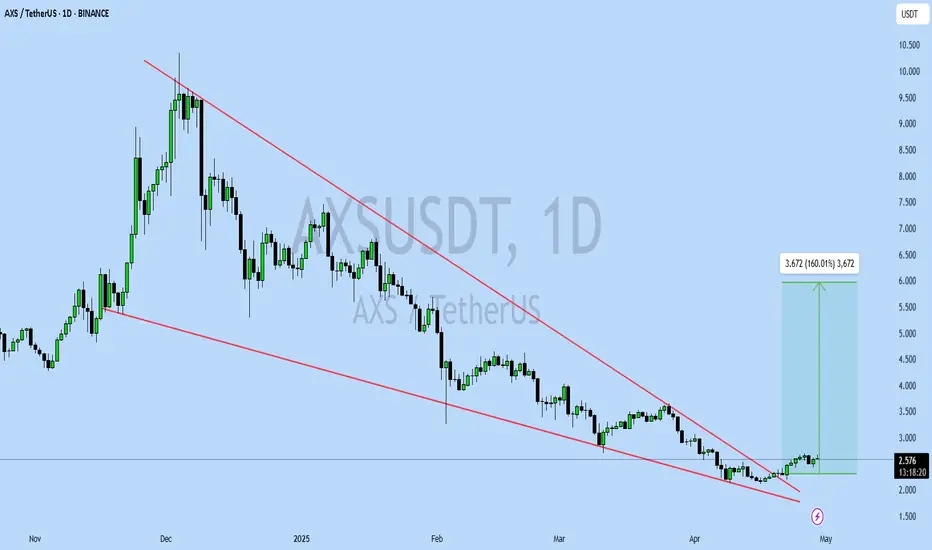
AXSUSDT UPDATE
AXS Technical Setup
Pattern: Falling Wedge Breakout
Current Price: $2.581
Target Price: $6.25
Target % Gain: 160.01%
Technical Analysis: AXS has broken out of a falling wedge pattern on the 1D chart. The breakout is supported by bullish momentum and a breakout candle above resistance, signaling a potential reversal.
Time Frame: 1D
Risk Management Tip: Always use proper risk management.
AXSUSDT 1D AnalysisAXS ~ 1D Analysis
#AXS Buy after successfully penetrating this resistant line with a short -term target of at least 10%+ from here.