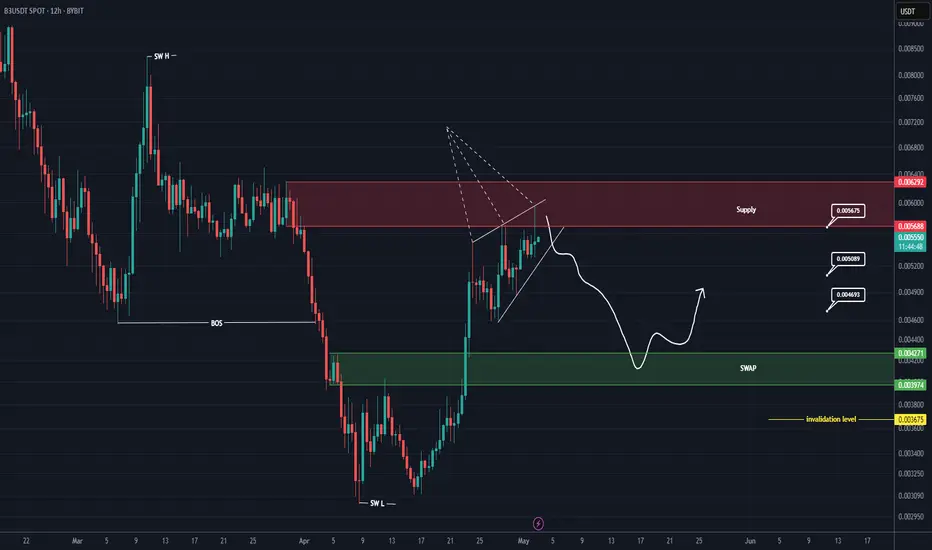
B3 Aanalysis (12H)The strong bullish move on B3 is turning into a 3D. It could move from the supply zone towards the SWAP zone and then get rejected upwards.
We are looking for buy/long positions in the green zone. Targets are marked on the chart.
A daily candle close below the invalidation level will invalidate th
Symmetrical Triangle Breakout Attempt! 📈 OMXSTO:B3 - Symmetrical Triangle Breakout Attempt! 📐
✅ OMXSTO:B3 has broken out of a symmetrical triangle pattern.
🔴 Next hurdle: Needs to break and close above the red resistance zone for further upside.
🎯 Potential target: Green line level if the red resistance is broken! 🚀
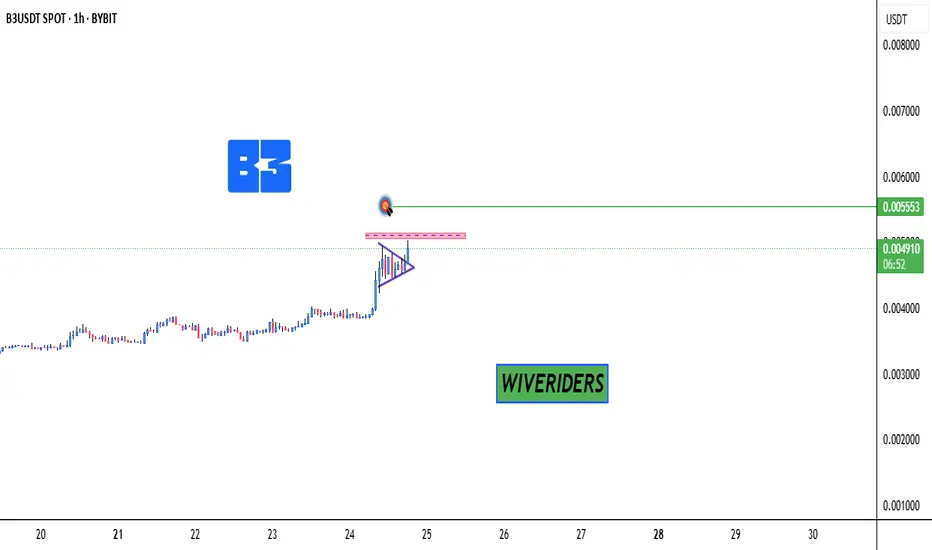
Time for buy B3TP1: 0.00660
Target Logic: Close resistance + 1:1 risk-reward ratio.
TP2: 0.00695
Target Logic: 1.618 Fibonacci extension and previous high.
TP3: 0.00730
Target Logic: 2.618 Fibonacci extension and psychological round level.
Stop-Loss (SL) Level
SL: 0.00610
Logic: Buffered safety level below
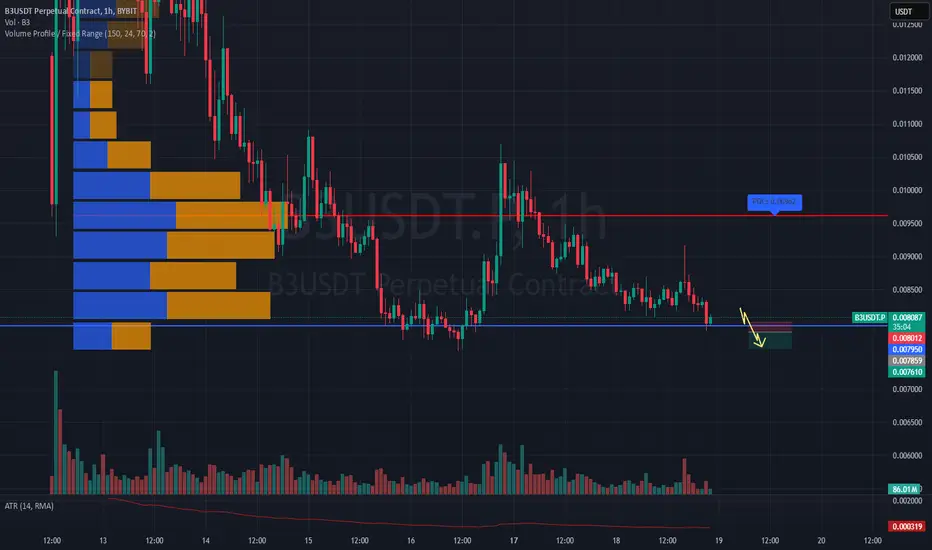
#B3USDT remains weak—expecting further decline!📉 SHORT BYBIT:B3USDT.P from $0.007859
🛡 Stop Loss: $0.008012
⏱ 1H Timeframe
✅ Overview:
➡️ BYBIT:B3USDT.P remains in a steady downtrend after retracing to the resistance level.
➡️ POC (Point of Control) at $0.00962 confirms seller dominance, and the current price trades below the high-volume
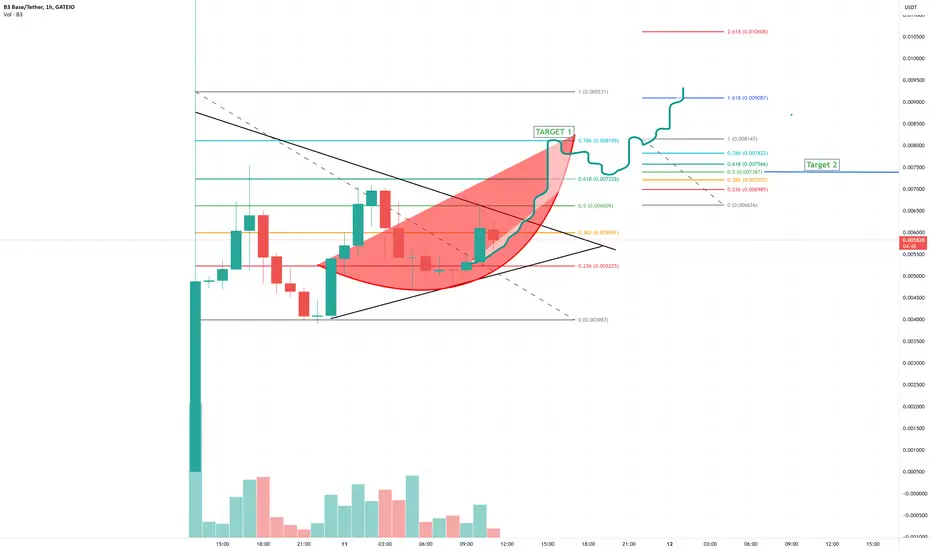
b3 Token gaming In here are some key targets using the fin retracement and trendlines. These are short term price predictions. on the 1 hour chart
See all ideas
Summarizing what the indicators are suggesting.
Oscillators
Neutral
SellBuy
Strong sellStrong buy
Strong sellSellNeutralBuyStrong buy
Oscillators
Neutral
SellBuy
Strong sellStrong buy
Strong sellSellNeutralBuyStrong buy
Summary
Neutral
SellBuy
Strong sellStrong buy
Strong sellSellNeutralBuyStrong buy
Summary
Neutral
SellBuy
Strong sellStrong buy
Strong sellSellNeutralBuyStrong buy
Summary
Neutral
SellBuy
Strong sellStrong buy
Strong sellSellNeutralBuyStrong buy
Moving Averages
Neutral
SellBuy
Strong sellStrong buy
Strong sellSellNeutralBuyStrong buy
Moving Averages
Neutral
SellBuy
Strong sellStrong buy
Strong sellSellNeutralBuyStrong buy