BAKEUSDT Forming Falling WedgeBAKEUSDT is currently forming a promising Falling Wedge Pattern, a classic bullish reversal setup that traders watch for significant upside potential. This pattern, combined with steadily increasing volume, indicates that a major breakout could be on the horizon. Historically, falling wedges often precede explosive price moves, and BAKEUSDT is showing early signs of preparing for just that. Technical traders who spot this formation early can position themselves for the expected 90% to 100%+ gain if the breakout confirms with strong momentum.
Investor sentiment around BAKEUSDT is improving as this project garners more attention from the crypto community. The sustained interest and accumulation phase within the wedge are clear signals that large buyers are preparing for a bigger move. As BAKEUSDT approaches the breakout point of the wedge, traders should closely monitor price action and volume spikes to catch the first wave of upward movement. This makes BAKE one of the top altcoins to keep on your radar right now.
Another reason BAKEUSDT stands out is its healthy trading volume, which supports the likelihood of a successful breakout rather than a false move. The increased liquidity ensures that once the resistance of the wedge pattern is breached, the price can rally with minimal slippage and strong follow-through. With major cryptocurrencies setting the tone for the broader market, high-potential altcoins like BAKE can benefit from renewed bullish momentum across the board.
✅ Show your support by hitting the like button and
✅ Leaving a comment below! (What is You opinion about this Coin)
Your feedback and engagement keep me inspired to share more insightful market analysis with you!
BAKEUSDT trade ideas
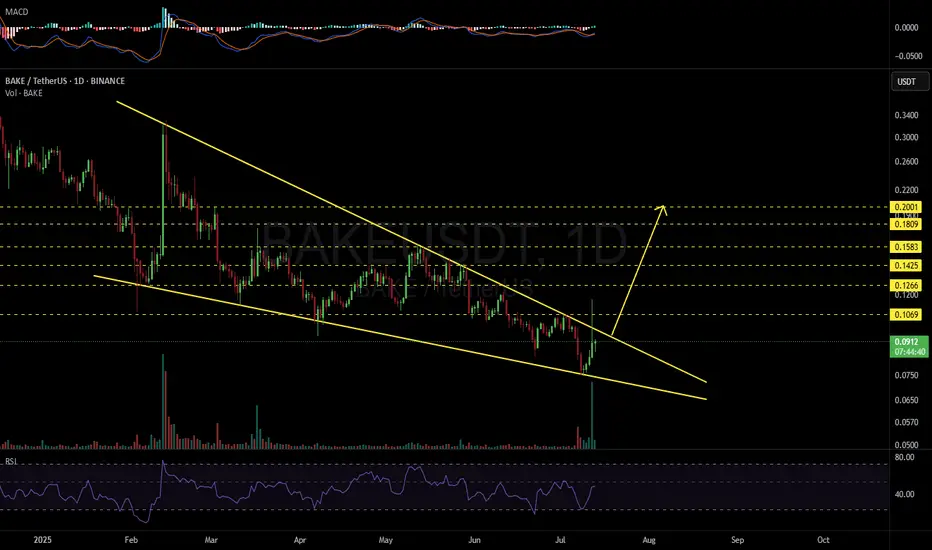
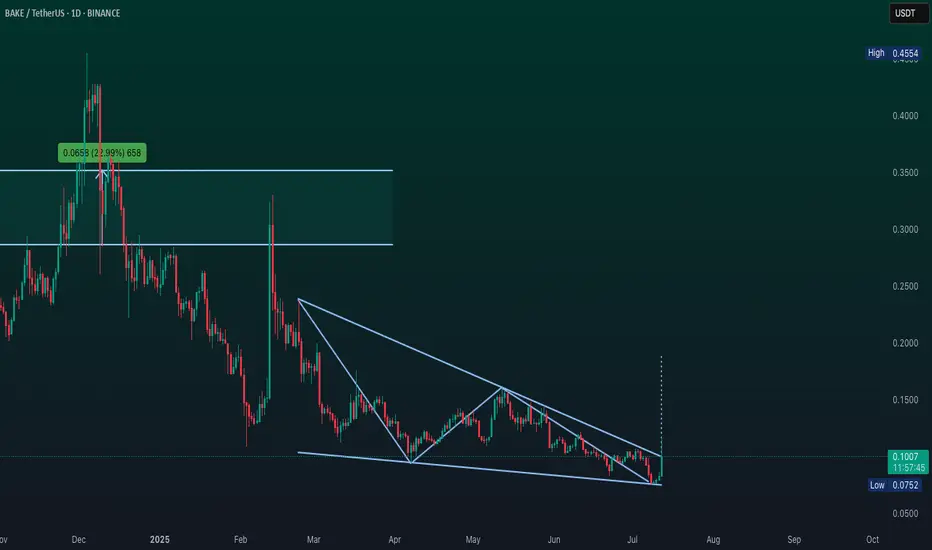
BAKEUSDT 1D#BAKE is attempting to break out of the falling wedge on the daily chart.
Price briefly pierced above the wedge resistance with strong volume but has pulled back inside. If it manages to close a daily candle above the wedge with confirmation, it could trigger a bullish move toward the following targets:
🎯 $0.1069
🎯 $0.1266
🎯 $0.1425
🎯 $0.1583
🎯 $0.1809
🎯 $0.2001
⚠️ No confirmation yet — wait for a clean breakout with volume before entering.
⚠️ Always use a tight stop-loss and apply proper risk management.
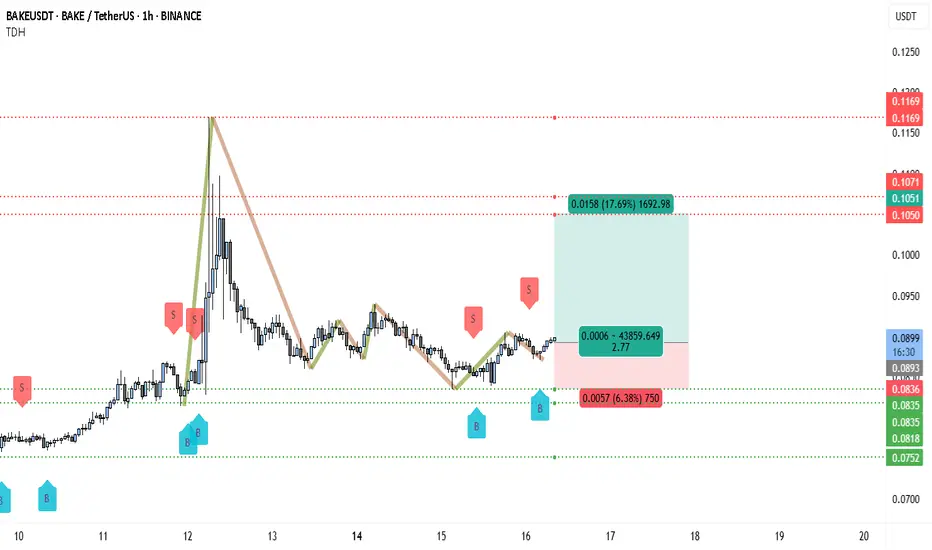
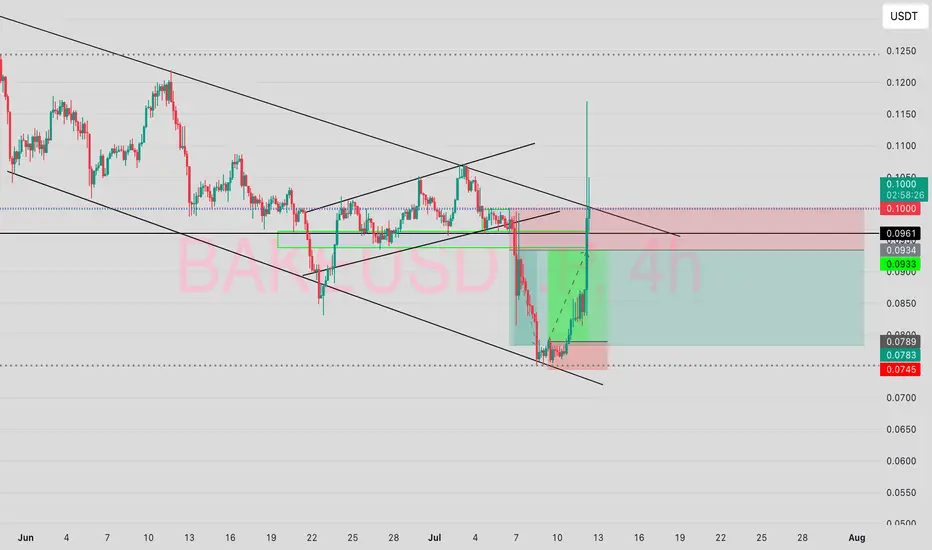
BAKE Bulls Targeting 0.105, +1692% Volume SurgeThe chart shows BAKEUSDT trading around 0.0898 USDT on Binance. Overall, the structure indicates that after a strong upward impulse from approximately 0.0835 USDT to 0.117 USDT, the price entered a correction and is now consolidating. This consolidation sits just above an important support level, signaling a possible preparation for the next leg up.
There is a clearly defined support area between 0.0835 and 0.0836 USDT, which has been tested multiple times. The most recent lows were bought up strongly, forming what looks like a potential double bottom or higher low, both common reversal patterns. Beneath this zone, the next deeper support rests near 0.0752 USDT, which would be considered only if the main support fails.
Overhead, the chart identifies resistance levels at 0.1050–0.1071 USDT, where price previously stalled and retraced. This zone aligns with the first target area for any bullish continuation. Further up, 0.1169 USDT marks the prior swing high and the most significant resistance to break for confirmation of a larger trend reversal.
Visually, the chart illustrates how the strong impulse rally was followed by a structured pullback, resembling an ABC correction pattern. The correction appears mature, as price action is tightening within a smaller range. This often suggests that momentum is getting ready to shift back upward if buying pressure sustains.
Several buy signals ("B") are marked on the chart near support zones, while sell signals ("S") have appeared near previous short-term peaks. The clustering of buy signals around the current levels reinforces the idea that traders have been accumulating positions in this area.
Below is the trading setup outlined on your chart:
• Entry Zone: Around 0.0898 USDT
• Stop Loss: Slightly under 0.0836 USDT to protect against a deeper retracement
• Take Profit Target: Between 0.1050 and 0.1071 USDT (initial target)
• Risk/Reward Ratio: Approximately 2.77, which is favorable for long positions
• Potential Gain: +17.69% from entry to target
• Potential Loss: -6.38% if the stop is hit
The highlighted risk/reward box shows the trade aims to capture a substantial move while limiting downside exposure.
The overall price behavior indicates that sellers failed to create new lows, and instead, the market printed a higher low above the key support zone. This is often one of the first signs that demand is absorbing supply and can set the stage for an upside breakout.
While volume data isn’t visible in the chart you shared, typically in this kind of setup, volume contracts during the correction phase and begins expanding again when price approaches a breakout point. Watching for rising volume on any move above 0.0900 USDT could confirm bullish intent.
If price breaks and closes above 0.0900 USDT on the hourly timeframe, this would be the first signal that momentum is flipping decisively in favor of the bulls. Ideally, you want to see a retest of this level hold as support, which would further validate the move. From there, a push into the 0.1050–0.1071 USDT resistance area becomes more probable. If this level is cleared on strong momentum, the extended target near 0.1169 USDT could be achievable.
In terms of sentiment, the fact that multiple buy signals have appeared near the support zone while sellers are absent near the lows reinforces a bullish bias. The risk is primarily centered around whether the 0.0835 USDT level holds. If price closes decisively below it, that would invalidate the current bullish thesis and potentially expose the market to a deeper drop toward the 0.0752 USDT support area.
Overall, the chart presents a constructive technical picture favoring further upside, provided that support holds and buyers can reclaim the short-term resistance above 0.0900 USDT. The consolidation phase appears to be maturing, and the combination of higher lows and consistent rejection of support zones increases the likelihood of a breakout.
Summary of the Bullish Scenario:
• The trend structure shows a strong impulse and controlled pullback.
• The price has respected a key support area repeatedly.
• Buy signals are clustered near the lows, suggesting accumulation.
• A breakout above 0.0900 USDT could trigger a rally toward 0.1050 USDT and potentially higher.
• The risk/reward profile is attractive, offering nearly 3 times the reward relative to the risk.
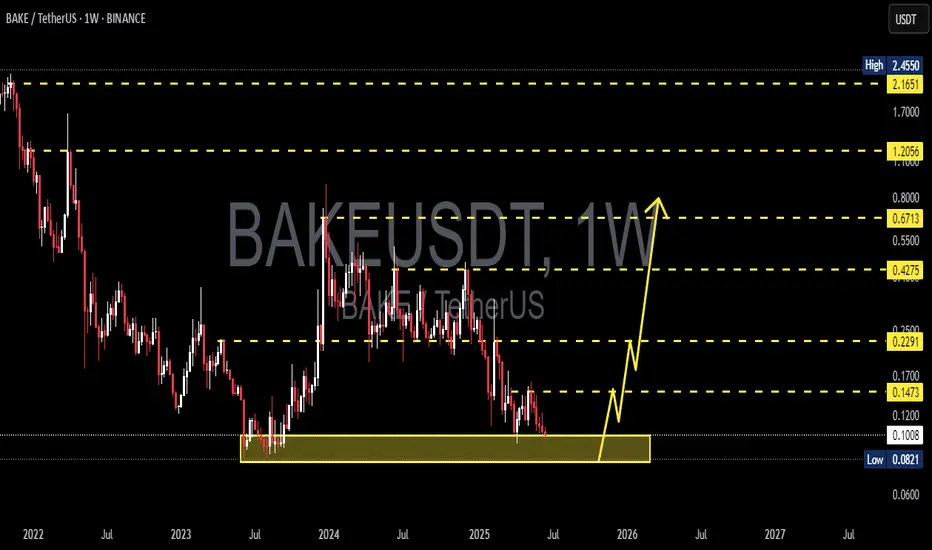
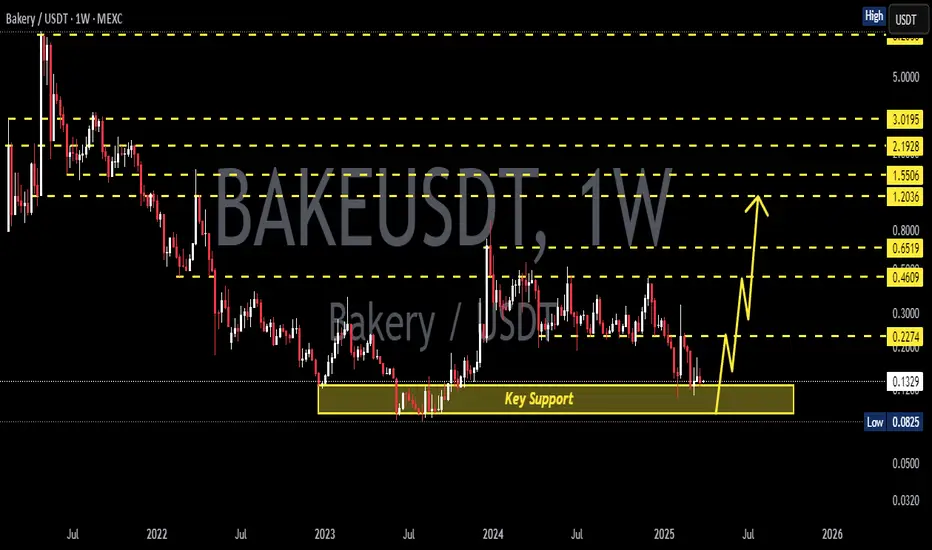
BAKE ready to restart the uptrendhi traders,
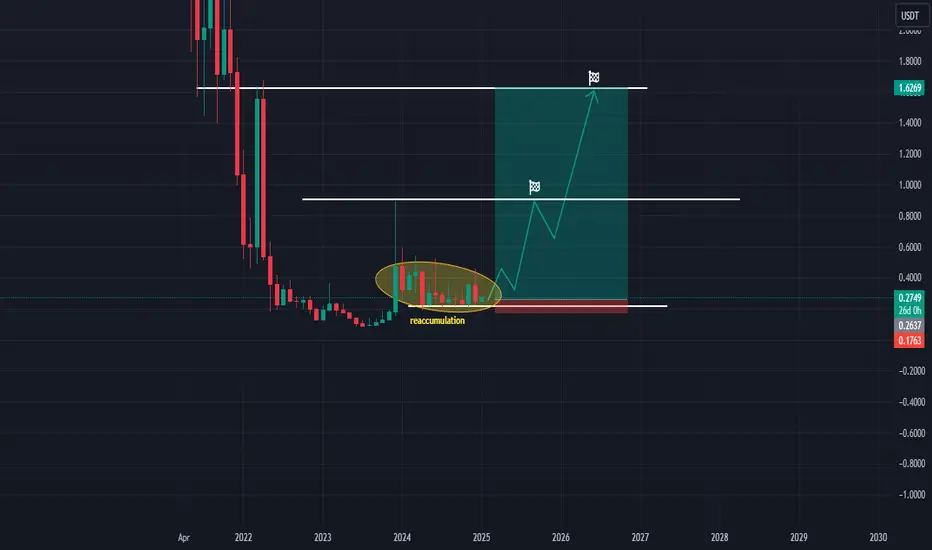
Let's have a look at BAKEUSDT on the monthly time frame.
To be honest, there are not many altcoins that look as good as BAKE on the monthly.
Multiple months of the reaccumulation.
Support holds strong.
I can't see it to fail.
First target: 0,90
Second target: 1,62
BAKE is a low market-cap altcoin so I won't be surprised if the pump is fast and after that we will get a deep pullback again.
Good luck
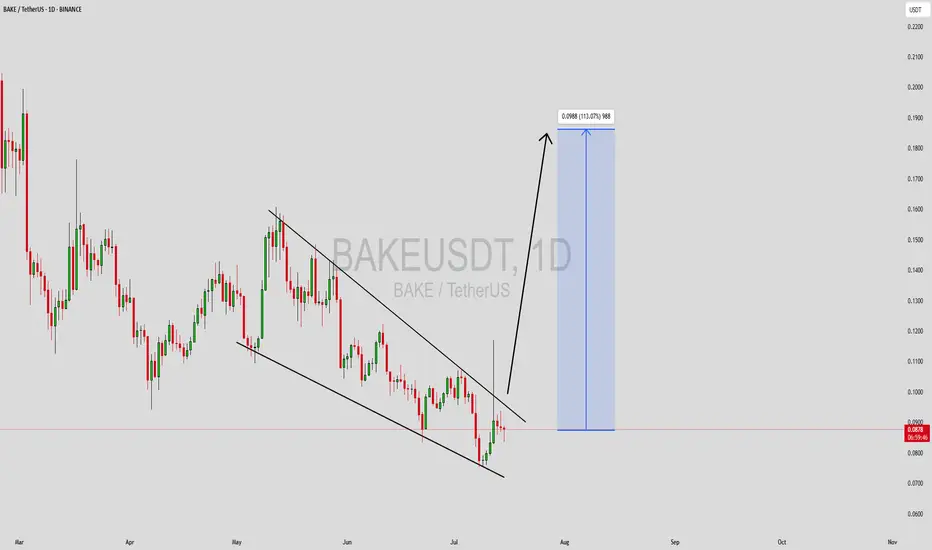
BAKE/USDT 1-Day ChartThis 1-day chart shows a big drop from around 0.3400 to a low of 0.0752 recently, with a slight dip (-0.42%) today. A falling wedge pattern is forming—could mean a chance to bounce back! Plus, starting with the news, Binance added BAKE to its Monitoring Tag on July 7th, which usually signals higher risk. Oddly, the price went up instead—maybe the fear of delisting was already priced in, and the announcement not leading to immediate delisting sparked buying? Or there could be another factor at play!
CRUX:
Support Zone: A strong base is at 0.1200-0.1300, where buyers might step in.
Resistance Level: The next big test is at 0.1800-0.2000—break that, and it could rise!
Falling Wedge: This pattern, with its narrowing lines, often signals a bullish move if it breaks above 0.2000.
Momentum: The downtrend had steady volume, but the pattern hints at a possible upturn.
Timeframe:Watch the next few days for the wedge to break out.
Possibilities:
Bullish Move: A jump above 0.2000 with good volume could push it to 0.2500 or more!
Bearish Drop: A fall below 0.1200 might take it back to 0.0752—stay careful!
Safety Tip: Set a stop-loss below 0.1200 to stay safe.
$BAKEUSDT on it week upside candlestick on it all time low and also on it week upside strong orderblock
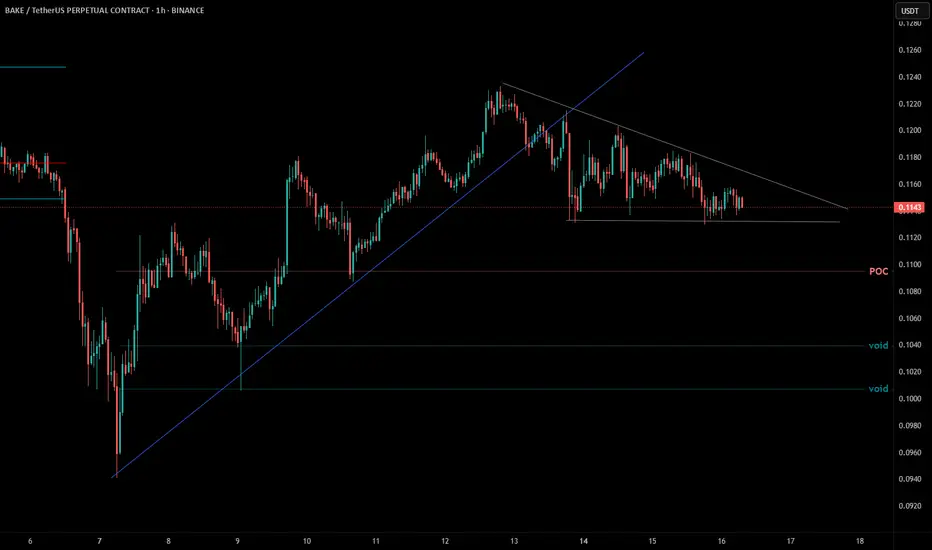
BAKEUSDT Approaching Breakout from Falling WedgeBAKEUSDT is currently trading near the upper resistance of a falling wedge pattern , often seen as a bullish reversal setup. With increasing volume and tighter price action, the market may be gearing up for a breakout. If confirmed, this could mark the beginning of a new upward trend. Traders should stay alert and wait for a clear breakout above resistance to validate the move.
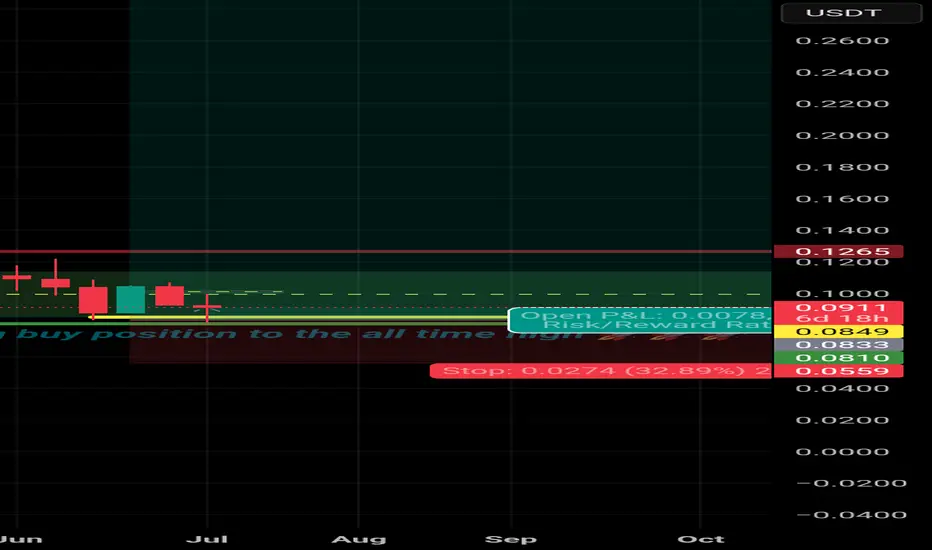
$BAKE Trailing STOPHere is yet another trade on BYBIT:BAKEUSDT.P that pained me.
Not only that I followed it through the breakouts, I ate from the breakout after forming a rising wedge.
Then, I followed a ride back up immediately and had a sumptuous run too but when it started rallying and it was time for bed, I set a trailing stoploss to protect my profit. This stopped me out early before this major move Up.
I’m not angry as much because I protected not just my capital but profit.
But I’m still angry I didn’t win with the move that I foresaw.
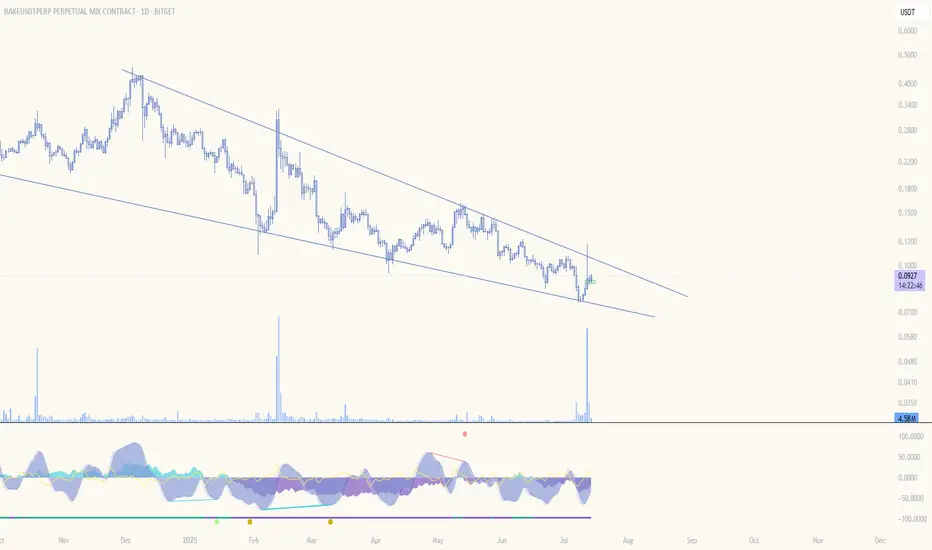
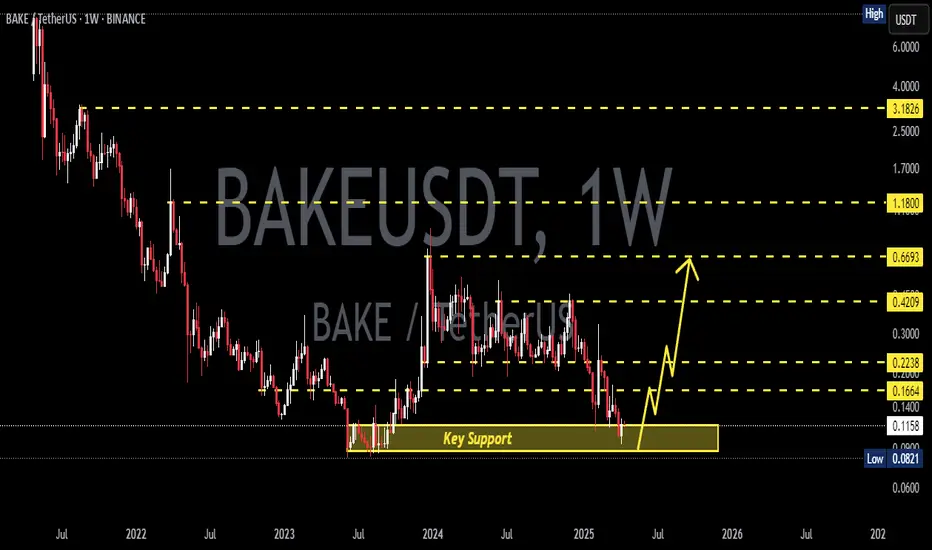
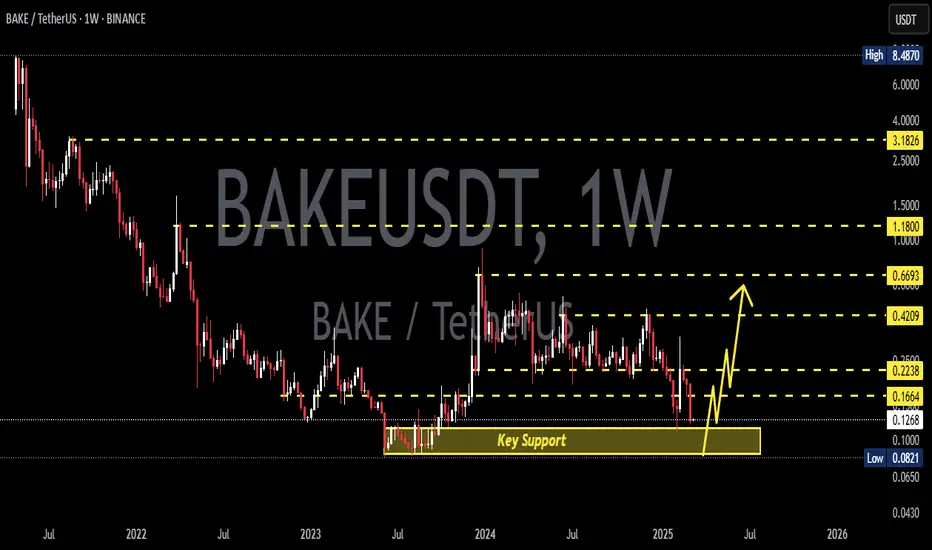
BAKEUSDT 1W AnalysisBAKE ~ 1W Analysis
#BAKE Buy back gradually from here with a short term target of at least 20%+ from this support.
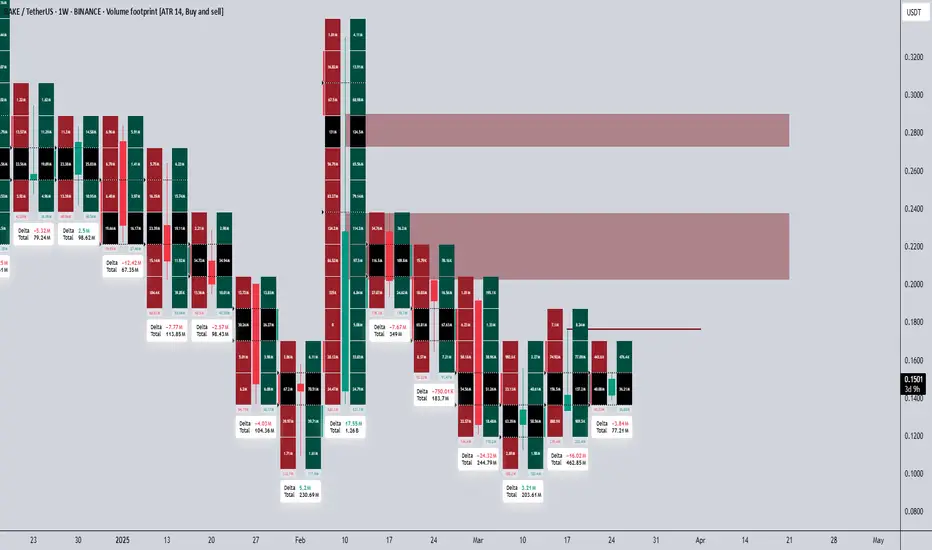
BAKE - Amazing Signal gave us TOP 13.5% Profits.Just Wow.
Volume + Footprint allowed us to recognize market sentiment and movement change.
1️⃣ 1st Signal: We were waiting for a breakout from the Grey Triangle. Price broke down and retested the lower White Level (lower Edge) of the Triangle and dropped to POC. It was Like Textbook. My POC Level was Sniping 🎯. Insane accuracy 👌🎯😎 .
3.5 % 💰 💵 💲
2️⃣ 2nd Signal: 2 Days Later I updated the Same TA and gave a LONG as Signal.
I wrote: "eyes on Fib and 4h" .
Yellow Circle Marks. 👌🎯😎
Beautiful Reaction on that new 4h-LEvel + Fib 0.38.
AND BOOM💰💵💲 10 %
-- Below the link of both Original TA/Signals:
1st Signal:https://tradingview.sweetlogin.com/chart/BAKEUSDT.P/QB8ppmBK-BAKE-Some-POIs/
2nd Signal:https://tradingview.sweetlogin.com/x/B0j82o6D/
Follow for more ideas/Signals.💲
Just donate some of your profit to Animal rights or other charity :)✌️

BAKE - Some POIsThe Grey triangle could be a nice trade. Eyes on it.
I will be not active for next 1-2 days but here a small TA.
There is not much to say.
a quick overview of BAKE.
Follow for more ideas/Signals. 💲
Look at my other ideas 😉
Just donate some of your profit to Animal rights and rescue or other charity :)✌️
BAKEUSDT 1WBAKE ~ 1W Analysis
#BAKE Buy gradually from here if you still have a Conviction on this coin with a short -term target of at least 20%+.
BAKE - Some POIs that Blue box could be a nice short possibility.
Just wait until it reaches there then new small TA regarding Volume, then probably Short.
Follow for more ideas/Signals. 💲
Look at my other ideas 😉
Just donate some of your profit to Animal rights and rescue or other charity :)✌️

BAKEUSDT 1WBAKE ~ 1W Analysis
#BAKE Buy gradually from here if you still have a Conviction on this coin with a short -term target of at least 20%+.
BAKEUSDT – Red Boxes Are Strong Resistance Zones!The red boxes on BAKEUSDT represent significant resistance zones where we can expect considerable selling pressure. These levels have shown their strength in the past, and it's crucial to approach them with caution.
🔴 Key Insights:
Strong Resistance: The red boxes are key resistance areas with high potential for price rejection. Sellers are likely to be active here, so don’t rush.
Patience is Key: Always wait for lower time frame (LTF) breakouts with CDV and volume profile confirmation before making any decisions.
Avoid Blind Entries: Trading these zones blindly can be risky. Let the market show you its intention, and only trade with confirmation.
💡 Smart Approach:
Wait for a clear signal before making a move. If the market doesn’t break and retest these red zones with volume, there’s no reason to take unnecessary risks. Your entry should always be backed by proper data and analysis. Patience + Smart Entries = Successful Trades.
I keep my charts clean and simple because I believe clarity leads to better decisions.
My approach is built on years of experience and a solid track record. I don’t claim to know it all, but I’m confident in my ability to spot high-probability setups.
If you would like to learn how to use the heatmap, cumulative volume delta and volume footprint techniques that I use below to determine very accurate demand regions, you can send me a private message. I help anyone who wants it completely free of charge.
I have a long list of my proven technique below:
🎯 ZENUSDT.P: Patience & Profitability | %230 Reaction from the Sniper Entry
🐶 DOGEUSDT.P: Next Move
🎨 RENDERUSDT.P: Opportunity of the Month
💎 ETHUSDT.P: Where to Retrace
🟢 BNBUSDT.P: Potential Surge
📊 BTC Dominance: Reaction Zone
🌊 WAVESUSDT.P: Demand Zone Potential
🟣 UNIUSDT.P: Long-Term Trade
🔵 XRPUSDT.P: Entry Zones
🔗 LINKUSDT.P: Follow The River
📈 BTCUSDT.P: Two Key Demand Zones
🟩 POLUSDT: Bullish Momentum
🌟 PENDLEUSDT.P: Where Opportunity Meets Precision
🔥 BTCUSDT.P: Liquidation of Highly Leveraged Longs
🌊 SOLUSDT.P: SOL's Dip - Your Opportunity
🐸 1000PEPEUSDT.P: Prime Bounce Zone Unlocked
🚀 ETHUSDT.P: Set to Explode - Don't Miss This Game Changer
🤖 IQUSDT: Smart Plan
⚡️ PONDUSDT: A Trade Not Taken Is Better Than a Losing One
💼 STMXUSDT: 2 Buying Areas
🐢 TURBOUSDT: Buy Zones and Buyer Presence
🌍 ICPUSDT.P: Massive Upside Potential | Check the Trade Update For Seeing Results
🟠 IDEXUSDT: Spot Buy Area | %26 Profit if You Trade with MSB
📌 USUALUSDT: Buyers Are Active + %70 Profit in Total
🌟 FORTHUSDT: Sniper Entry +%26 Reaction
🐳 QKCUSDT: Sniper Entry +%57 Reaction
📊 BTC.D: Retest of Key Area Highly Likely
I stopped adding to the list because it's kinda tiring to add 5-10 charts in every move but you can check my profile and see that it goes on..
A tiny part of my runners;
🌊 WAVESUSDT.P: Demand Zone Potential
🟣 UNIUSDT.P: Long-Term Trade
🔵 XRPUSDT.P: Entry Zones
🔗 LINKUSDT.P: Follow The River
📈 BTCUSDT.P: Two Key Demand Zones
A tiny part of my runners;
💼 STMXUSDT: 2 Buying Areas
🐢 TURBOUSDT: Buy Zones and Buyer Presence
🌍 ICPUSDT.P: Massive Upside Potential | Check the Trade Update For Seeing Results
🟠 IDEXUSDT: Spot Buy Area | %26 Profit if You Trade with MSB
📌 USUALUSDT: Buyers Are Active + %70 Profit in Total
🌟 FORTHUSDT: Sniper Entry +%26 Reaction
🐳 QKCUSDT: Sniper Entry +%57 Reaction
j
📌I keep my charts clean and simple because I believe clarity leads to better decisions.
📌My approach is built on years of experience and a solid track record. I don’t claim to know it all but I’m confident in my ability to spot high-probability setups.
📌If you would like to learn how to use the heatmap, cumulative volume delta and volume footprint techniques that I use below to determine very accurate demand regions, you can send me a private message. I help anyone who wants it completely free of charge.
🔑I have a long list of my proven technique below:
🎯 ZENUSDT.P: Patience & Profitability | %230 Reaction from the Sniper Entry
🐶 DOGEUSDT.P: Next Move
🎨 RENDERUSDT.P: Opportunity of the Month
💎 ETHUSDT.P: Where to Retrace
🟢 BNBUSDT.P: Potential Surge
📊 BTC Dominance: Reaction Zone
🌊 WAVESUSDT.P: Demand Zone Potential
🟣 UNIUSDT.P: Long-Term Trade
🔵 XRPUSDT.P: Entry Zones
🔗 LINKUSDT.P: Follow The River
📈 BTCUSDT.P: Two Key Demand Zones
🟩 POLUSDT: Bullish Momentum
🌟 PENDLEUSDT.P: Where Opportunity Meets Precision
🔥 BTCUSDT.P: Liquidation of Highly Leveraged Longs
🌊 SOLUSDT.P: SOL's Dip - Your Opportunity
🐸 1000PEPEUSDT.P: Prime Bounce Zone Unlocked
🚀 ETHUSDT.P: Set to Explode - Don't Miss This Game Changer
🤖 IQUSDT: Smart Plan
⚡️ PONDUSDT: A Trade Not Taken Is Better Than a Losing One
💼 STMXUSDT: 2 Buying Areas
🐢 TURBOUSDT: Buy Zones and Buyer Presence
🌍 ICPUSDT.P: Massive Upside Potential | Check the Trade Update For Seeing Results
🟠 IDEXUSDT: Spot Buy Area | %26 Profit if You Trade with MSB
📌 USUALUSDT: Buyers Are Active + %70 Profit in Total
🌟 FORTHUSDT: Sniper Entry +%26 Reaction
🐳 QKCUSDT: Sniper Entry +%57 Reaction
📊 BTC.D: Retest of Key Area Highly Likely
📊 XNOUSDT %80 Reaction with a Simple Blue Box!
📊 BELUSDT Amazing %120 Reaction!
I stopped adding to the list because it's kinda tiring to add 5-10 charts in every move but you can check my profile and see that it goes on..
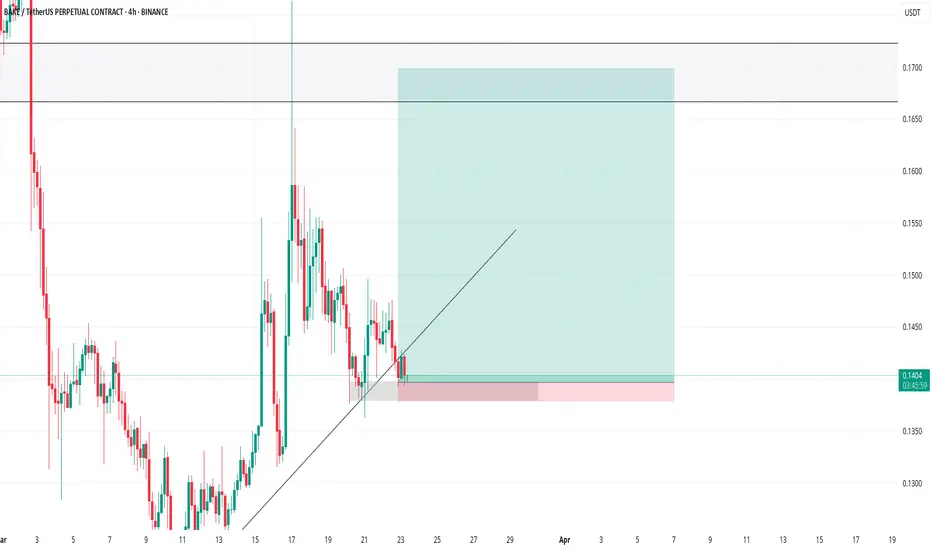
Bakeusdt Buy Opportunity Entered DCA leverage long from here cause i see a good buy opportunity from here though its very risky.
RR is good if this holds and Bounce.
Expecting a strong and fast bounce if holds.
entered under 0.1400
will scale out if holds under 0.1385
Targeting 0.1700
Note: Not a Financial Advice
BAKEUSDT 1WBAKE ~ 1W Analysis
#BAKE This is the lowest support for now.
Buy from here if you still have a Conviction on this coin with a short -term target of at least 20%+.
BAKE - What a Beautiful Nice Short -The levels were given some days ago. 😎
Even trump news didn't change our levels.
What a strong Reject from marked yellow levels. 👌 🎯
👌🎯 20 % .
previous TA was given here :
Follow for more ideas/Signals. 💲
Look at my other ideas ;)
Just donate some of your profit to Animal rights and rescue or other charity :)✌️

BAKE some interesting POIsif 0.155 breaks then short the scht out it (only at retest) (if you could get a retest 🤣 )
BAKE is jumpy. maybe we see the upper (yellow ~ 0.21 ish) level too
BAKE is a little bit risky to trade. Like XRP and CAKE, dont use leverages over 2X.
Try to trade Spot or low lvrg.
Follow for more ideas/Signals. 💲
Just donate some of your profit to Animal rights and rescue or other charity :)✌️

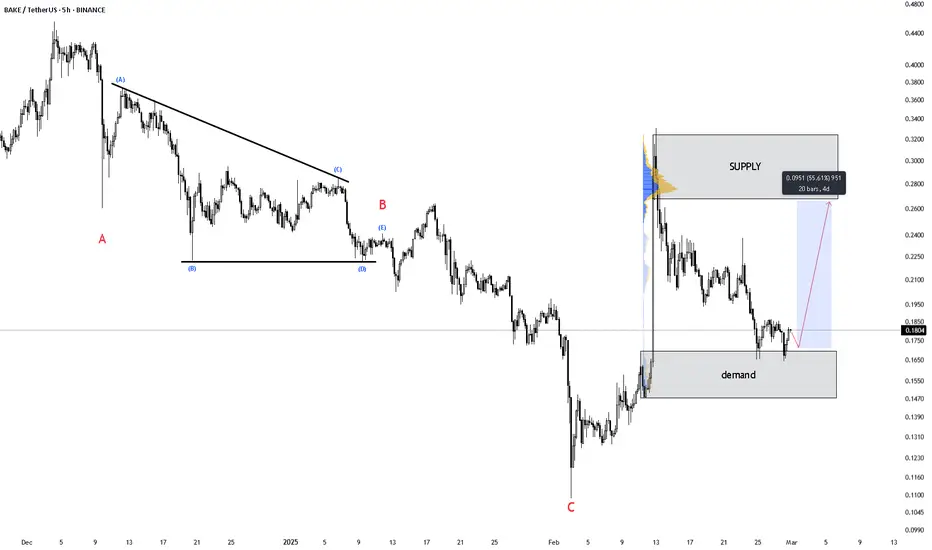
BAKE update#BAKE went down to a demand zone i think this zone can make the price rise to the supply zone this can make over 50% profit
BAKE TA was given several days ago and nowBAKE TA was given several days ago and now.
There are some important levels marked (yellow)
there will be dynamic TA at those levels, as soon as we reached them.
one level reached since i had given it days ago. Now we look at new levels.
Follow for more ideas/Signals. 💲
Just donate some of your profit to Animal rights and rescue or other charity :)✌️

BAKE udpdate#BAKE is going down which can reach the demand zone
this demand zone has a lot of liq which can force the market to rise
the whole market is bullish

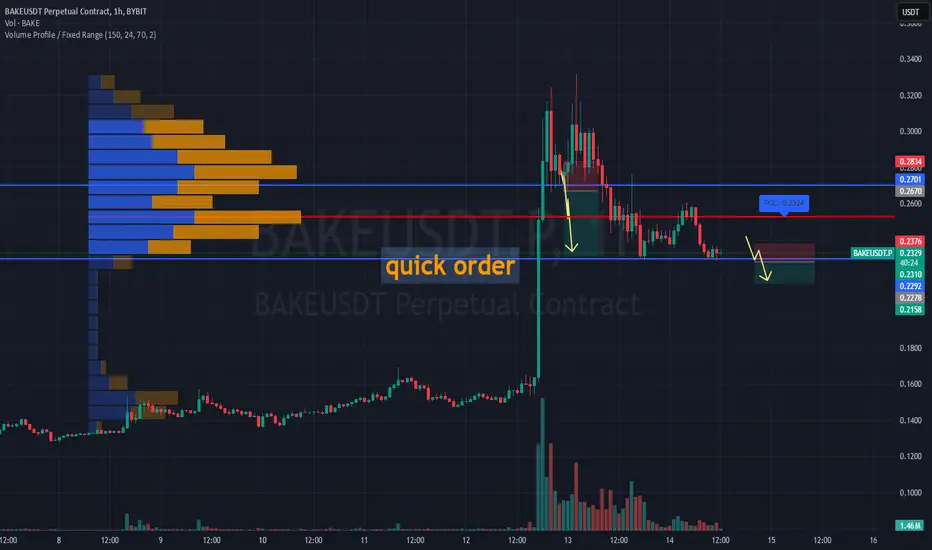
#BAKEUSDT – Quick Trade: Fast Short Opportunity!BYBIT:BAKEUSDT.P is showing weakness after breaking below the $0.2310 zone and consolidating lower. Sellers are in control, price remains below POC $0.2524, and volume confirms bearish pressure.
👉 Key Takeaways:
⚡️ This is a fast trade – no waiting!
The goal is to set the order, take profit, and exit quickly.
⚡️ Fast entry – confirmed breakdown below $0.2278.
⚡️ Tight stop-loss – set at $0.2376 to minimize risk.
⚡️ Quick target – $0.2158, where a bounce may occur.
📉 SHORT BYBIT:BAKEUSDT.P from $0.2278
🛡 Stop Loss: $0.2376
⏱️ 1H Timeframe (Quick Trade!)
✅ Overview:
➡️ BYBIT:BAKEUSDT.P is trading below $0.2310, confirming buyer weakness.
➡️ Downward momentum remains strong, next support is at $0.2158.
➡️ This trade is designed for fast execution and exit at the target level.
⚡️ Plan:
➡️ Act fast – enter and exit without hesitation.
➡️ If price slows down before $0.2158, exit early.
➡️ Don’t chase the price – wait for a clean setup.
📍 Take Profit:
🎯 TP1: $0.2158 – exit zone.
📌 Don't chase – wait for clear execution!
📌 Strategy: Momentum + Quick Profit Target.
🚀 BYBIT:BAKEUSDT.P Breaking Support – Fast Short Opportunity!