BANANA long "@members been looking at BANANA for a while and posting it as trade idea, could get sniper pf entry I missed it, here I must say Im not sure where Sl should be, however BTC looks interesting and would try some longs here to 0.31
I will be more than happy with just Tp1"
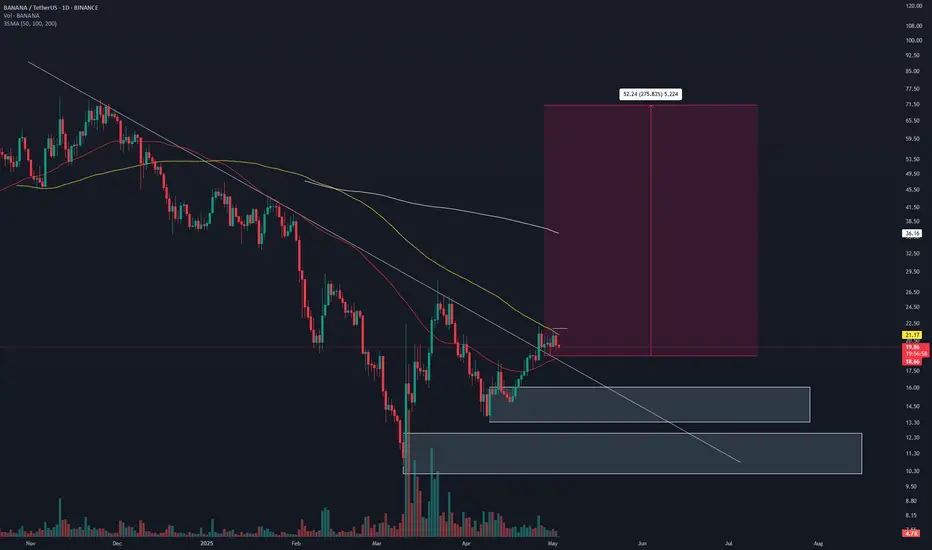
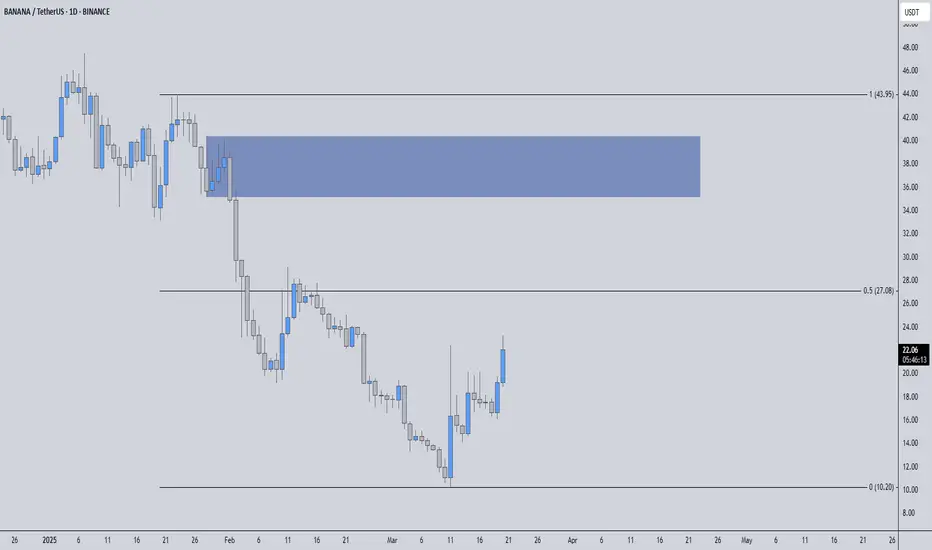
BANANAUSDT Analysis D1BANANAUSDT Descending Trendline Has Already Got Cleared, Banana Can Give Solid Bullish Rally In Coming Days .
Let us deliver the BANANA to the treeHello all,
We will see the BANANA back to the tree.
So let us help it !!!
Enjoy
MIZ

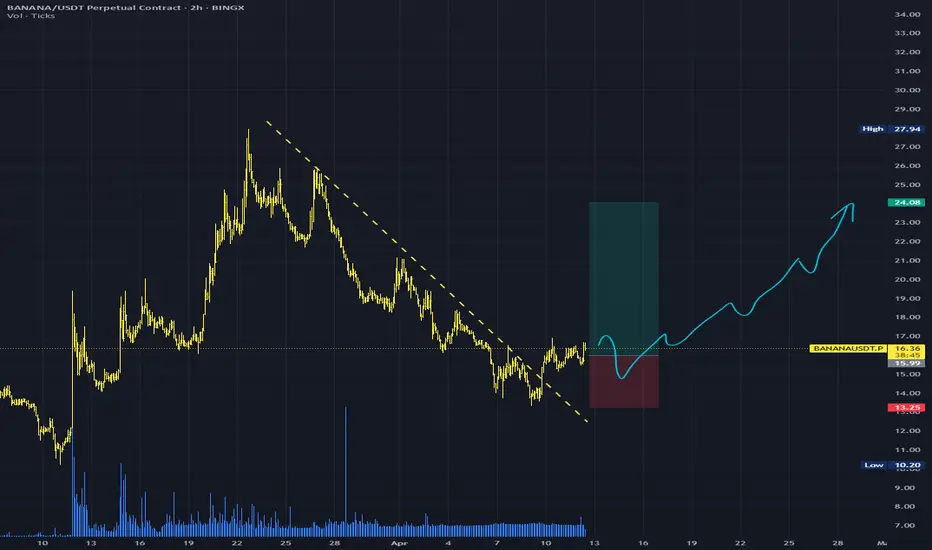
BANANA long directionThere are long direction. It has been breakout the falling wedge. So there is a chance to go UP. Because this coin have great volatility. Possible to get the position partly from current and in red zone.
$BANANA @BananaGunBot 🍌 $BANANA @BananaGunBot 🍌
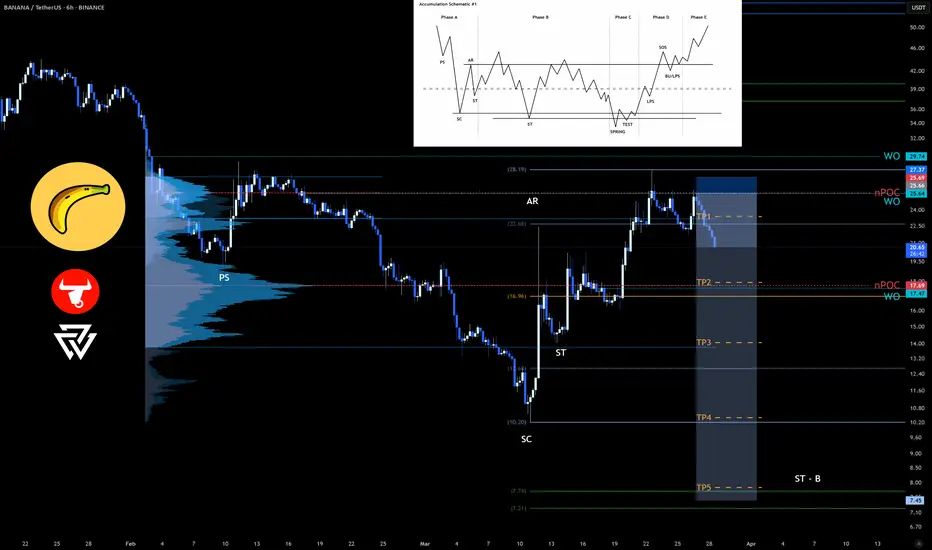
Wyckoff Accumulation Schematic #1 is my base case.
Time and more data will tell but targeting Secondary test (ST) now.
I have two options where the ST could possibly be.
Clues to Support an Idea:
1️⃣ Prolonged downtrend
2️⃣ Preliminary Support (PS) – Surge in selling vol
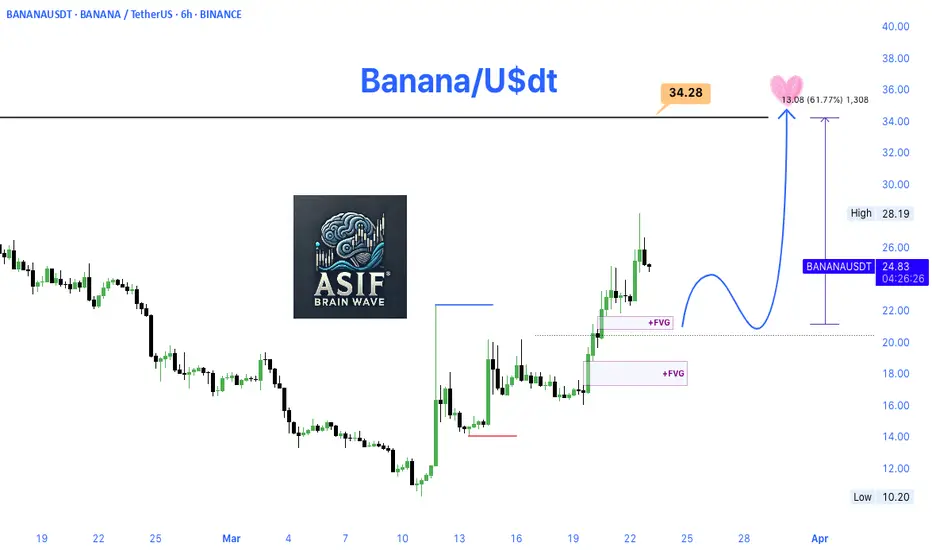
BANANA/USDT with a 61.77% potential
BANANA/USDT (6H timeframe)
Current Price: 24.82 USDT
Recent High: 28.19 USDT
Resistance Level Highlighted: 34.28 USDT
Projected Target: Around 34.28 USDT (with a 61.77% potential increase of 13.08 points from current price)
+FVG (Fair Value Gaps):
Two bullish FVG zones are marked, indicating
BANANAUSDT – 344% Volume Surge at Key Resistance! “Big volume, big levels—but we don’t FOMO, we wait for confirmation!”
🔥 Key Insights:
✅ 344% Volume Spike – Something is brewing, but is it real?
✅ Major Resistance Zone – This level decides the next big move.
✅ Confirmation is Everything – No breakout? No trade.
💡 The Smart Plan:
Wait for a
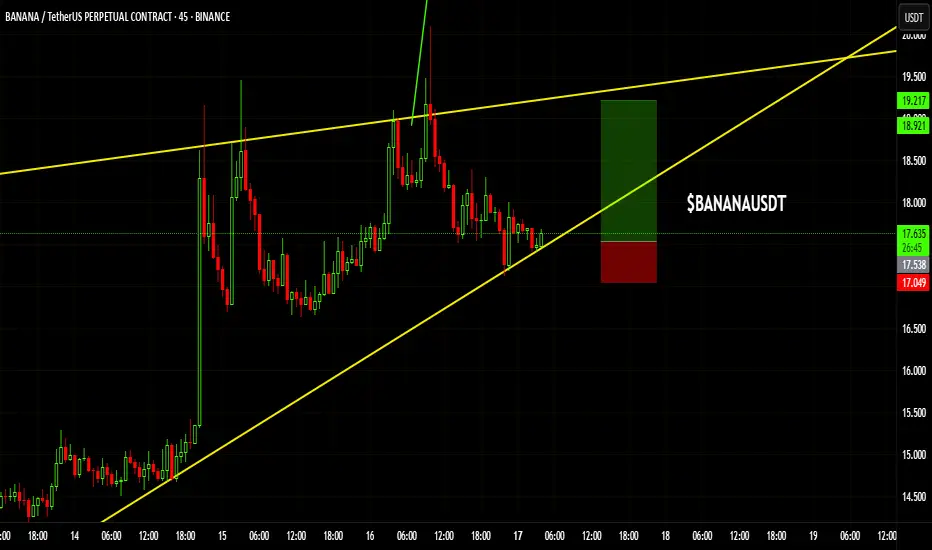
#BANANAUSDT- Golden Opportunity at Trend Support! Hey there, friends! Today, I’m back with another explosive analysis! 🚀🔥
This time, we’re diving into #BANANAUSDT, one of last week’s hottest topics. We’ve caught it right at a beautiful trend support level. I’ve kept the chart as clean and easy to read as possible.
Now, let’s break it down:
📍 Entr
$BANANA @BananaGunBot ─ Possibly beginning of Accumulation Range🍌 $BANANA @BananaGunBot 🍌
Could this possibly be the beginning of an Accumulation Range?
As usual, my base case is Wyckoff Accumulation Schematic #1.
Time and more data will tell—adding $BANANA to the watchlist.
Clues to Support an Idea:
1️⃣ Prolonged downtrend
2️⃣ Preliminary Support (PS) – Surg

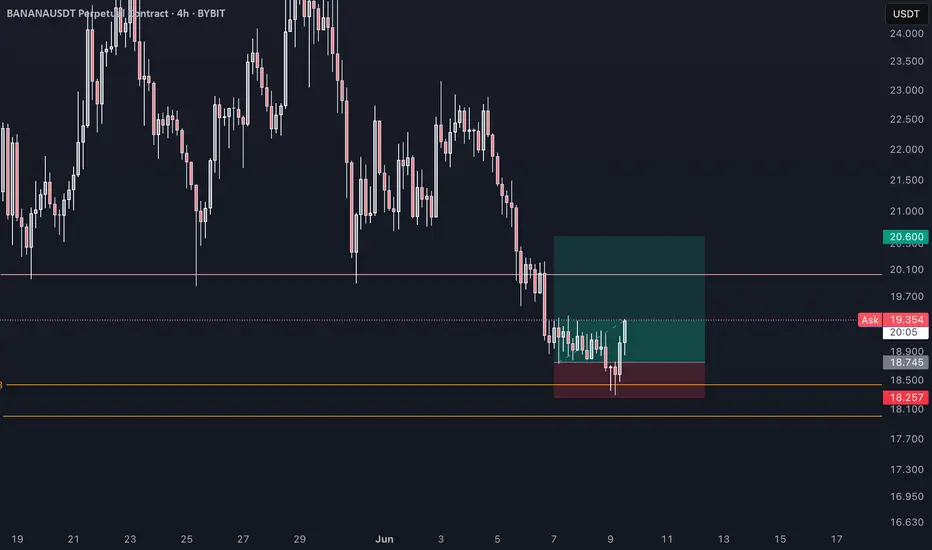
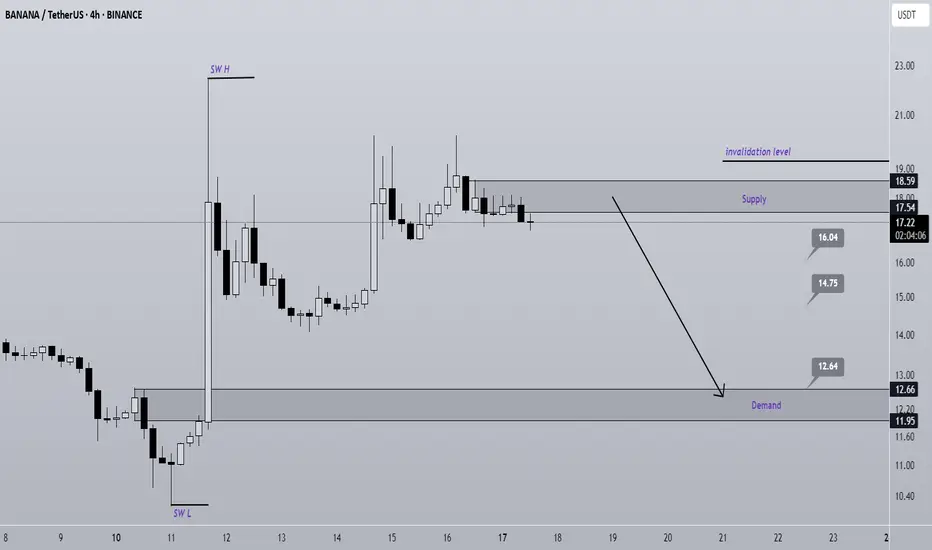
BANANA short setup (4H)BANANA is positioned between an SW H and an SW L. Based on the bases that have formed, it seems that this symbol intends to move toward the targets.
Break even at TP 1.
The closure of a daily candle above the invalidation level will invalidate this analysis.
Do not enter the position without capi
See all ideas
Summarizing what the indicators are suggesting.
Oscillators
Neutral
SellBuy
Strong sellStrong buy
Strong sellSellNeutralBuyStrong buy
Oscillators
Neutral
SellBuy
Strong sellStrong buy
Strong sellSellNeutralBuyStrong buy
Summary
Neutral
SellBuy
Strong sellStrong buy
Strong sellSellNeutralBuyStrong buy
Summary
Neutral
SellBuy
Strong sellStrong buy
Strong sellSellNeutralBuyStrong buy
Summary
Neutral
SellBuy
Strong sellStrong buy
Strong sellSellNeutralBuyStrong buy
Moving Averages
Neutral
SellBuy
Strong sellStrong buy
Strong sellSellNeutralBuyStrong buy
Moving Averages
Neutral
SellBuy
Strong sellStrong buy
Strong sellSellNeutralBuyStrong buy
Displays a symbol's price movements over previous years to identify recurring trends.