BAN Analysis (8H) This coin is somewhat risky and highly volatile, so only allocate a small amount of capital.
From the point where we placed the green arrow on the chart, a bullish phase seems to have formed on the BAN chart. This phase appears to be a diametric pattern, and we are currently in its final wave, wav

BAN Update – Inverse Bullish Head & Shoulders Forming!📈 BAN Update – Inverse Bullish Head & Shoulders Forming! 🚀
👀 BAN appears to be forming an Inverse Bullish Head and Shoulders pattern! This could signal a strong upward move if the blue resistance line (neckline) breaks! 🐂
⚠️ Watching for a clear breakout above the blue resistance line. If confirme
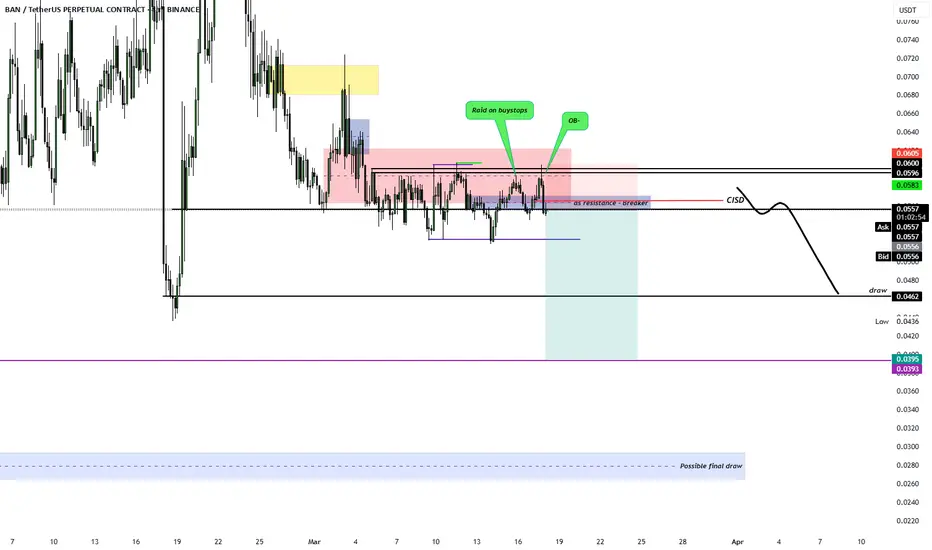
Bearish opportunity in BAN1. We want price to break from the consolidation to the downside
2. We have a raid of buy stops in H4
3. We have CISD on H4 - HTF - confirming order flow
4. we have draws as the H4 OB on the downside
BANUSDT CHART ANALYSİS - EDUCATIONAL POSTThe NFT Concept
You may already know that each unit of value in a blockchain is called a token. In an open blockchain, all tokens are equal and interchangeable. For example, one bitcoin can be easily replaced with another, and nothing will change.
Non-fungible tokens are a game-changer, which wor

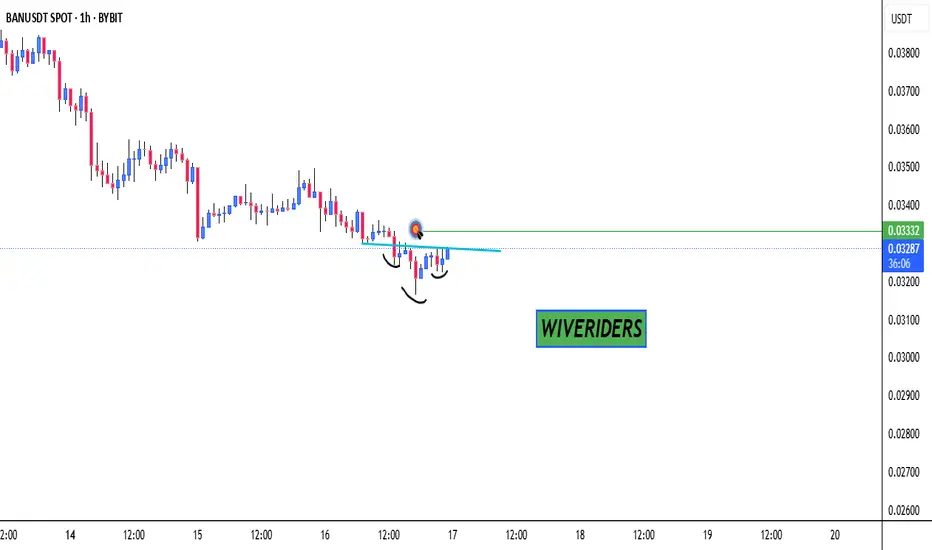
Bearish opportunity in BAN1. We have continuation CISD in H1
2. We have price showing its hand by the strong bearish drop >40% therefore longs are ow probability
3. We have price having draws on the H1 and major key levels up to 0.03
Alternative scenario:
As BTC has hit key level 85,000 though (not strong ), an impulsive pu
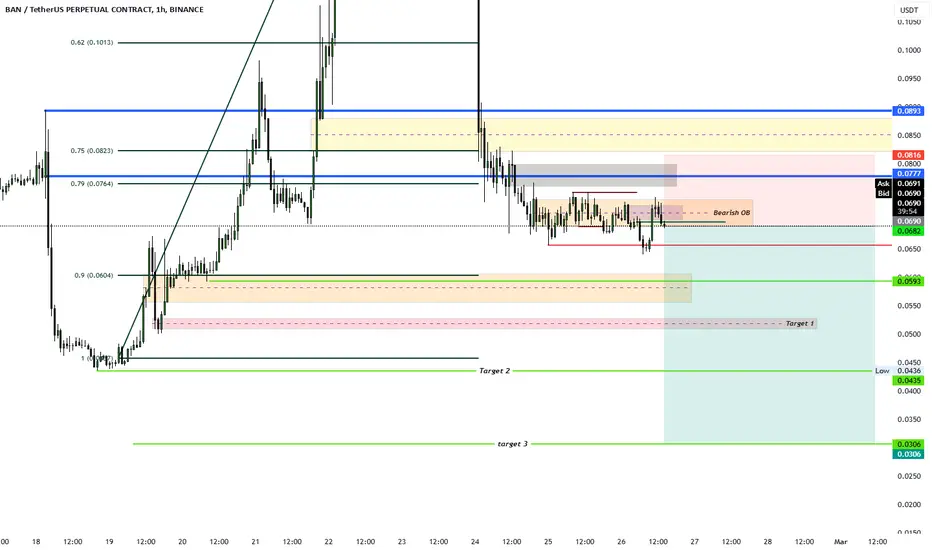
A big decline on BAN/USDT upcomingWhile every single indicator shows that BAN/USDT shows strong buy , our team diagree. Let's find out why..
Ban in the past 24hrs had a big pump of 120% , clear sign of manipulation..
Buyers started coming in and the coin will liquidate all of them..
A drop of 33% is expected from this coin..
Lets
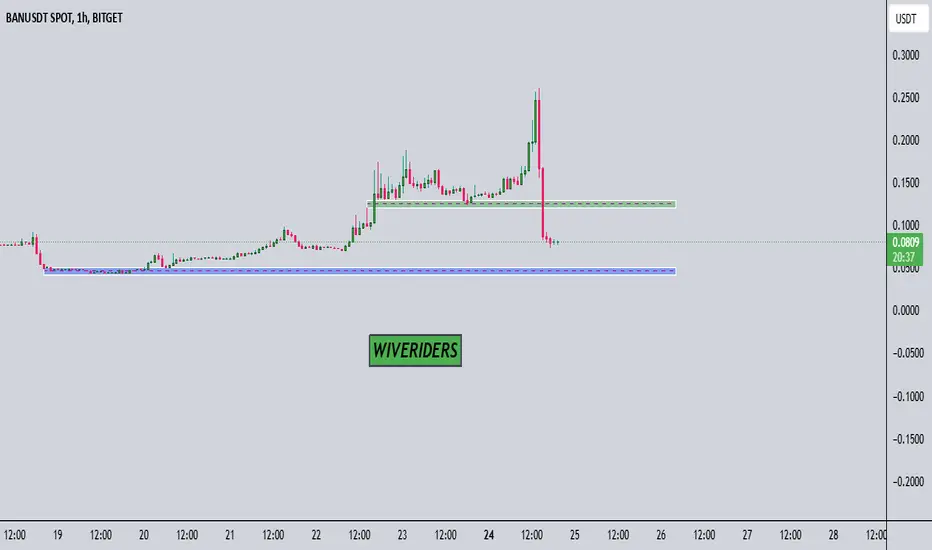
$BAN ANALYSIS!MIL:BAN has strongly broken below the green support level 🟩.
🔵 What’s next? If the price approaches the blue zone, there is a potential bounce up 📈 as buyers could show interest in this area.
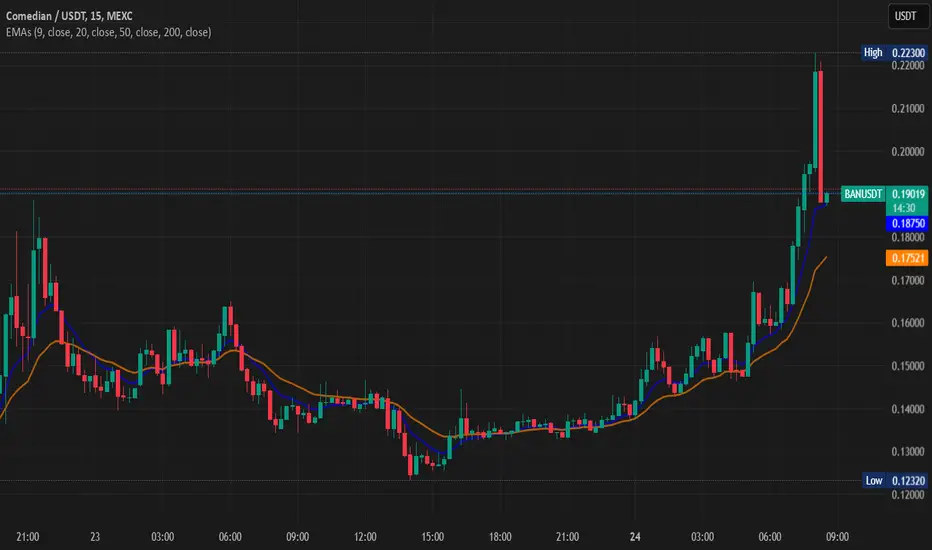
BANUSDT Faking PriceI observed right now BANUSDT is faking price and liquidating many user without immiginaryu price. The thershold of seller was 95 percent, even price was increasing rapidly. It's fake price issue or some software glitch
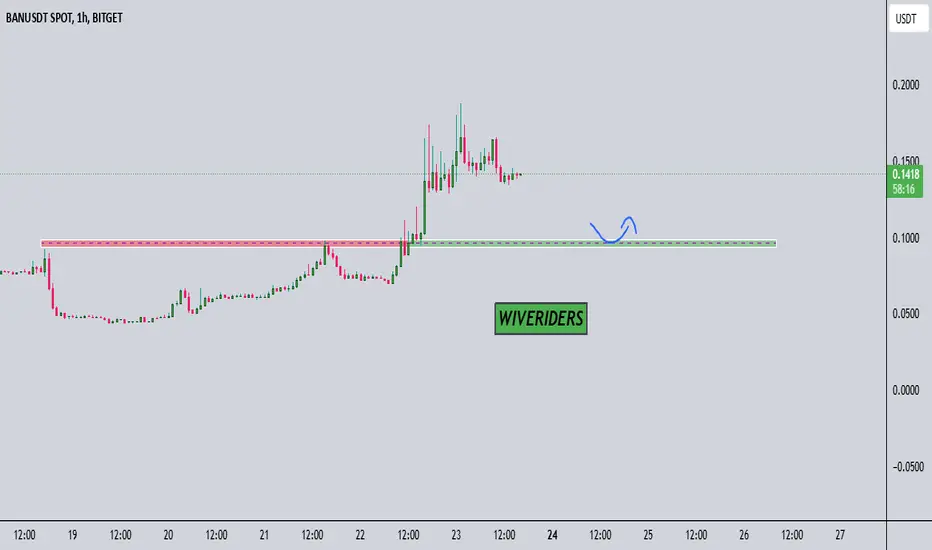
$BAN ANALYSIS! MIL:BAN has broken out of the red resistance zone 🟥, which has now turned into a green support level 🟩.
✅ If the price pulls back to this green zone, buyers could step in and push the price up again, making it a potential entry 📈.
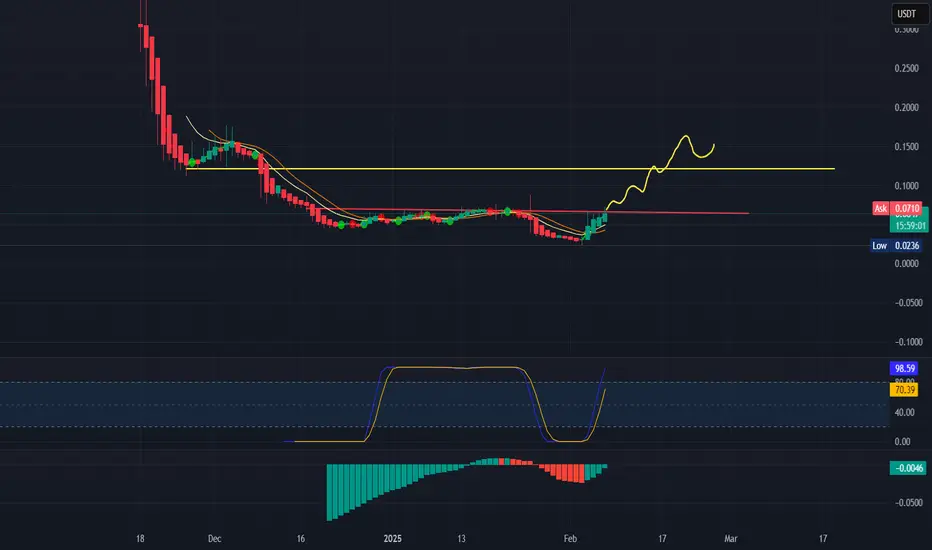
BANBAN broke the downtrend and the resistance area market with the red line, and in 1d tf it looks like the indicators is showing that it is in 0 line of the macd.
if its trend will not stop then it could get 0.12 during the weekend.
it is time to see market development, i would like to see btc stop
See all ideas
Summarizing what the indicators are suggesting.
Oscillators
Neutral
SellBuy
Strong sellStrong buy
Strong sellSellNeutralBuyStrong buy
Oscillators
Neutral
SellBuy
Strong sellStrong buy
Strong sellSellNeutralBuyStrong buy
Summary
Neutral
SellBuy
Strong sellStrong buy
Strong sellSellNeutralBuyStrong buy
Summary
Neutral
SellBuy
Strong sellStrong buy
Strong sellSellNeutralBuyStrong buy
Summary
Neutral
SellBuy
Strong sellStrong buy
Strong sellSellNeutralBuyStrong buy
Moving Averages
Neutral
SellBuy
Strong sellStrong buy
Strong sellSellNeutralBuyStrong buy
Moving Averages
Neutral
SellBuy
Strong sellStrong buy
Strong sellSellNeutralBuyStrong buy
Displays a symbol's price movements over previous years to identify recurring trends.