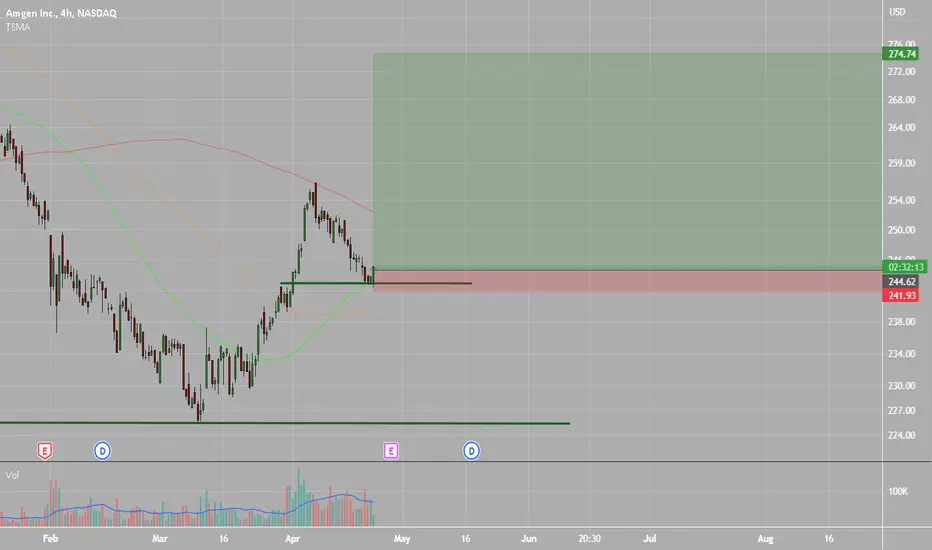
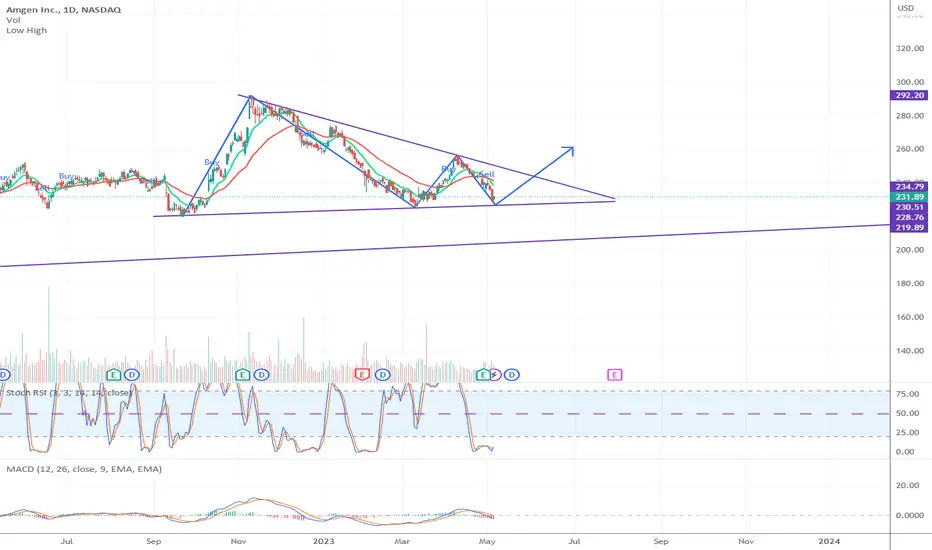
AMGN potential buy setupReasons for bullish bias:
- Price bounced from strong support along with 0.382 fib retracement
- Price respected trendline
- Strong bullish candles
Entry Level(CMP): 291.29
Stop Loss Level: 279.64
Take Profit Level 1: 302.94
Take Profit Level 2: Open
AMGND trade ideas
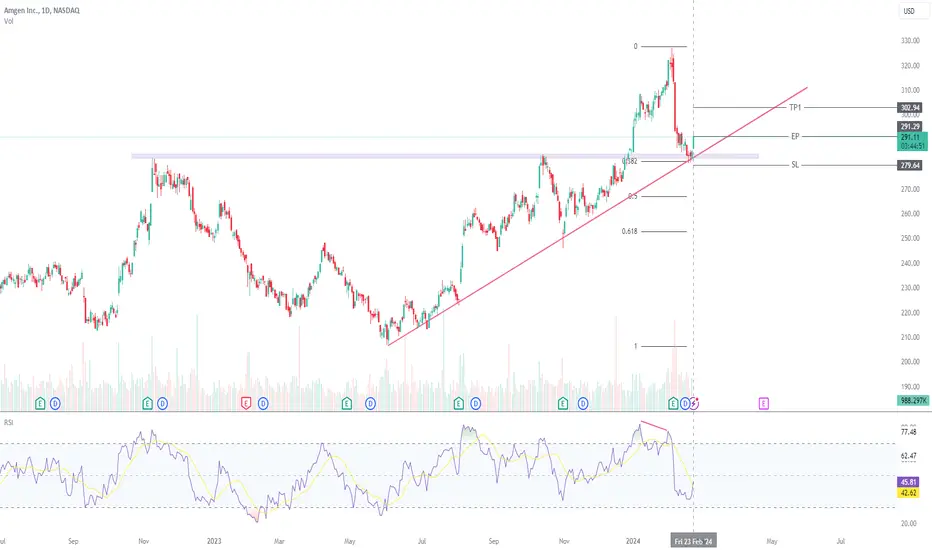
Can Amgen(NASD:AMGN) shares go significantly higher?The Minichart Trendline indicator has determined that the share price of Amgen Inc. has just broken its downtrend and is likely to recover from here.
This indicator developed by Minichart can detect stocks that change their trend, either from an uptrend to a downtrend or vice versa. It is plotted automatically.
First of all, Amgen Inc. stock price reached a short-term support 2 days ago when it hit the 38.2% Fibonacci support of a strong uptrend. The uptrend of the stock price started on 1 June 2023, and lasted for 7 months.
The strong uptrend has also formed a bullish head and shoulders (H&S) formation on the Minichart. From a technical analysis perspective, the recent pullback is a salutary correction after the price broke out of the H&S formation. Over time, the price will probably continue to rise and break above the high reached on February 5.
In addition, there are 3 other reasons why the price may have reached a good support and could rise again from here.
The price has reached the exponential moving average of 100. This is a strong support level.
The Minichart Heikin Ashi indicator has changed colour. It is now bullish.
The Stochastic indicator is oversold and starting to turn upwards.
Amgen Inc. Price Target
Next, we will use the Fibonacci retracement to find the immediate price target when the price starts to recover.
Using the Minichart Fibonacci retracement measurement from February 5 to 20, the first price target is $299, followed by $305. This is based on the 38.2% to 50% Fibonacci retracement levels. These levels coincided with resistance points during the sideways consolidation (green arrow on the chart).
If traders were to buy the stock based on Friday’s close of $289.18, they could potentially realise a decent return of 3.5% to 5.5%. This is based on the $299 to $305 Minichart price target mentioned above.
Of course, this is a short-term price target that can be reached within the next few weeks. Should the share price break through the high reached on February 5, the new price target will be significantly higher.

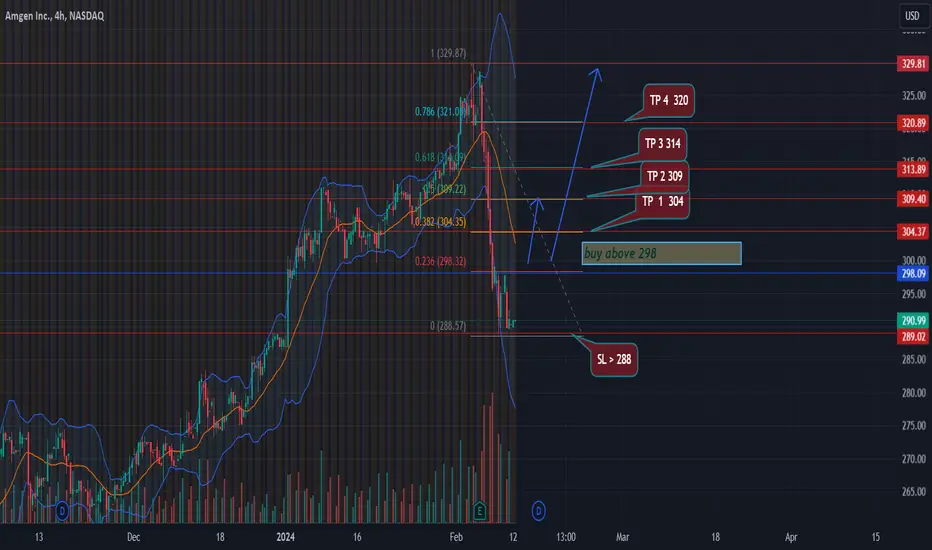
LONG IDEA After a major uptrend the stock almost starts to finish its correction wave and showed some postivity , we can start buy after the price to settle above its last peak at 298
TP 1 : 304
TP 2 :309
TP 3 : 314
TP 4 : 320
SL > 288
GOOD LUCK
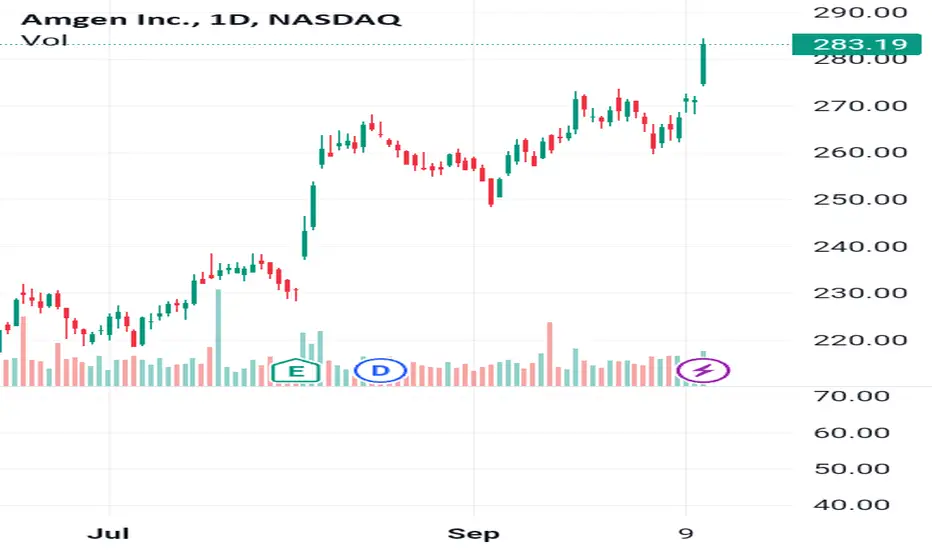
Diminishing volume indicates that no supply is present.Decreasing volume with the tighter and smaller candles indicates that supply is not present at this price level.
This is not a recommendation.

AMGN Amgen Options Ahead of EarningsIf you haven`t sold AMGN ahead of the HZNP buyout:
Then analyzing the options chain and the chart patterns of AMGN Amgen prior to the earnings report this week,
I would consider purchasing the $322.5 strike price Calls with
an expiration date of 2024-2-9,
for a premium of approximately $6.60.
If these options prove to be profitable prior to the earnings release, I would sell at least half of them.

Amgen Poised for Continued Upside## Amgen Poised for Continued Upside
Amgen Inc. (AMGN) appears poised for continued upside based on technical indicators. The current price of $324.56 is above the 50-day and 200-day simple moving averages, indicating an upward trend.
Key technical indicators also suggest further upside:
- Relative Strength Index (RSI) of 66 indicates AMGN is not overbought and has room to run
- Moving Average Convergence Divergence (MACD) line recently crossed above the signal line in a bullish sign
- Bollinger Bands widening suggests building upside momentum
I am initiating a buy on AMGN with an entry point of $330.95. This allows some room above the current price for confirmation of the uptrend. Profit targets are set at $340.79, while a stop loss of $321.36 limits downside risk.
The positive technical outlook combined with strong fundamentals makes AMGN a compelling buy at current levels for continued price appreciation. I will look to take profits as the price approaches overbought levels near the upper Bollinger Band. Managing risk with the defined stop loss is also key to success of this long setup.
Citations:
www.investing.com
www.chartmill.com
www.macroaxis.com
www.tipranks.com
financhill.com

🔬💊 Amgen Innovations & Strategic Moves 🚀🌟 Lumakras Breakthrough:
Amgen (AMGN) pioneers cancer treatment with Lumakras, the first medication targeting a mutation found in approximately 13% of lung cancer patients.
💰 Strategic Acquisition:
Amgen acquires Horizon Therapeutics for a substantial $28 billion in cash.
Incorporates Tepezza, an FDA-approved medicine for thyroid eye disease, into Amgen's product portfolio.
📈 Market Outlook:
Bullish stance on AMGN suggests support levels above $260.00-$265.00.
Anticipated upside target in the range of $360.00-$365.00.
Exciting developments in biotech and strategic expansion for Amgen! 🌐💉
#AmgenInnovation #Biotech #StockMarket 📰📊
AMGN short Hi traders,
let's take a look at the AMGN chart.
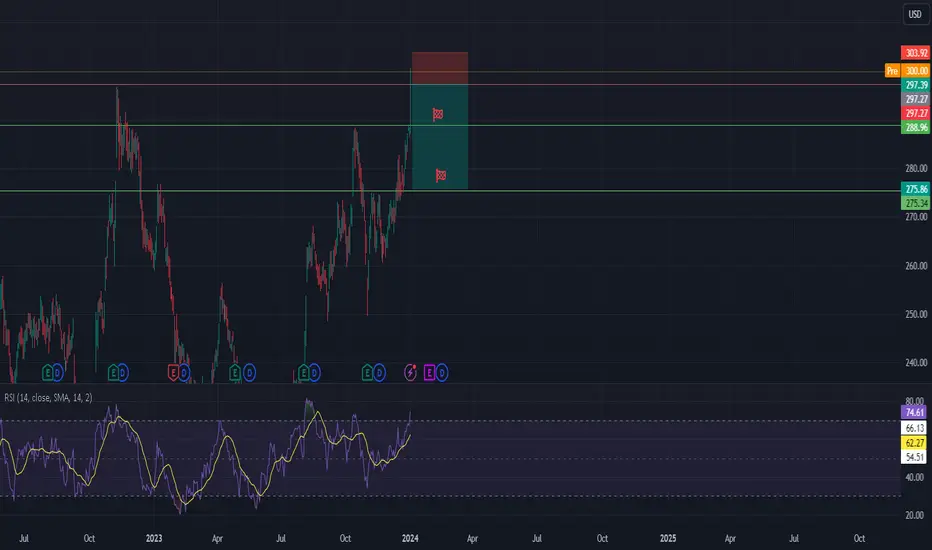
Price is retesting the previous all time high, which we expect to act as the resistance therefore, before the price continues the uptrend we are expecting pullback.
RSI has entered into overbought conditions.
Entry. stop loss and 2 targets for the short position are shown on the chart.
The idea is purely speculative based on technical analysis.
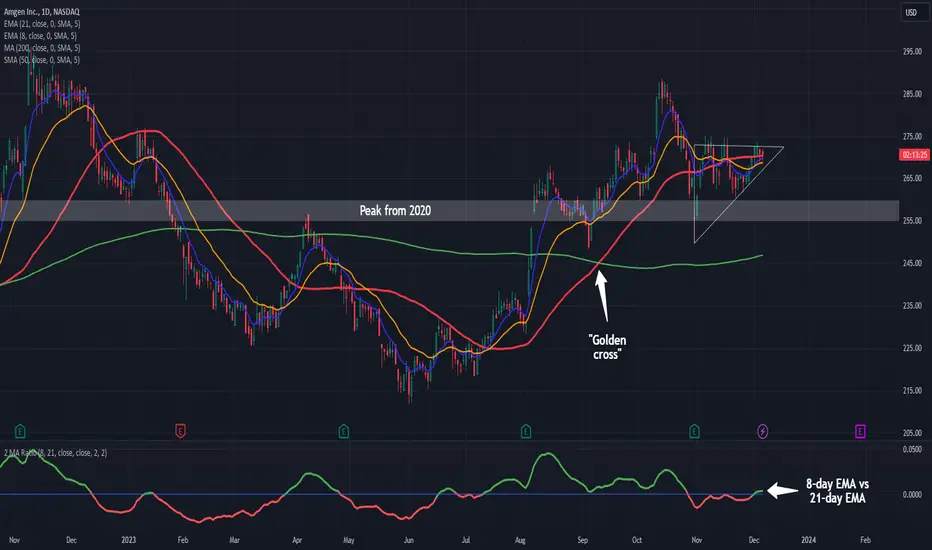
Ascending Triangle in Amgen?Amgen has been stuck at its current price area for almost 3-1/2 years, but now some traders may expect its longer-term uptrend to resume.
The first pattern on today’s chart is the $255-260 price zone. It roughly matches peaks in the summer of 2020, the spring of 2021 and the spring of 2022. AMGN ripped through it late last year, pulled back and stalled at the same price area in April of this year.
Strong earnings drove the pharma stock above that level in August. It was subsequently tested in September and late October, with prices remaining above. Has old resistance become new support?
Second is the series of higher lows since the last dip. The resulting ascending triangle is a potentially bullish continuation pattern.
Third, the 50-day simple moving average (SMA) had a “golden cross” above the 200-day SMA in mid-September. That may suggest the longer-term trend is getting more positive.
Finally, the lower study features our 2 MA Ratio custom script with the default settings of the 8-day and 21-day exponential moving averages (EMAs). It just turned positive, meaning the faster EMA has risen above slower EMA. That may suggest the shorter-term trend is getting more positive.
TradeStation has, for decades, advanced the trading industry, providing access to stocks, options, futures and cryptocurrencies. See our Overview for more.
Important Information
Past performance, whether actual or indicated by historical tests of strategies, is no guarantee of future performance or success. There is a possibility that you may sustain a loss equal to or greater than your entire investment regardless of which asset class you trade (equities, options, futures or cryptocurrencies); therefore, you should not invest or risk money that you cannot afford to lose. Online trading is not suitable for all investors. View the document titled Characteristics and Risks of Standardized Options at www.TradeStation.com . Before trading any asset class, customers must read the relevant risk disclosure statements on www.TradeStation.com . System access and trade placement and execution may be delayed or fail due to market volatility and volume, quote delays, system and software errors, Internet traffic, outages and other factors.
Securities and futures trading is offered to self-directed customers by TradeStation Securities, Inc., a broker-dealer registered with the Securities and Exchange Commission (“SEC”) and a futures commission merchant licensed with the Commodity Futures Trading Commission (“CFTC”). TradeStation Securities is a member of the Financial Industry Regulatory Authority, the National Futures Association (“NFA”), and a number of exchanges. TradeStation Crypto, Inc. offers to self-directed investors and traders cryptocurrency brokerage services under federal and state money services business/money-transmitter and similar registrations and licenses.
TradeStation Securities, Inc., TradeStation Crypto, Inc., and TradeStation Technologies, Inc. are each wholly owned subsidiaries of TradeStation Group, Inc., all operating, and providing products and services, under the TradeStation brand and trademark. TradeStation Crypto, Inc. offers to self-directed investors and traders cryptocurrency brokerage services. It is neither licensed with the SEC or the CFTC nor is it a member of NFA. When applying for, or purchasing, accounts, subscriptions, products and services, it is important that you know which company you will be dealing with. Visit www.TradeStation.com for further important information explaining what this means.
AMGN LongPretty self-explanatory, just reaching for a good entrance into a long position with AMGN, two percent exposure.

AMGN Amgen Options Ahead of Earnings If you haven`t sold AMGN on the HZNP deal:
Then analyzing the options chain and the chart patterns of AMGN Amgen prior to the earnings report this week,
I would consider purchasing the 262.5usd strike price Puts with
an expiration date of 2023-11-17,
for a premium of approximately $8.15.
If these options prove to be profitable prior to the earnings release, I would sell at least half of them.
Looking forward to read your opinion about it.

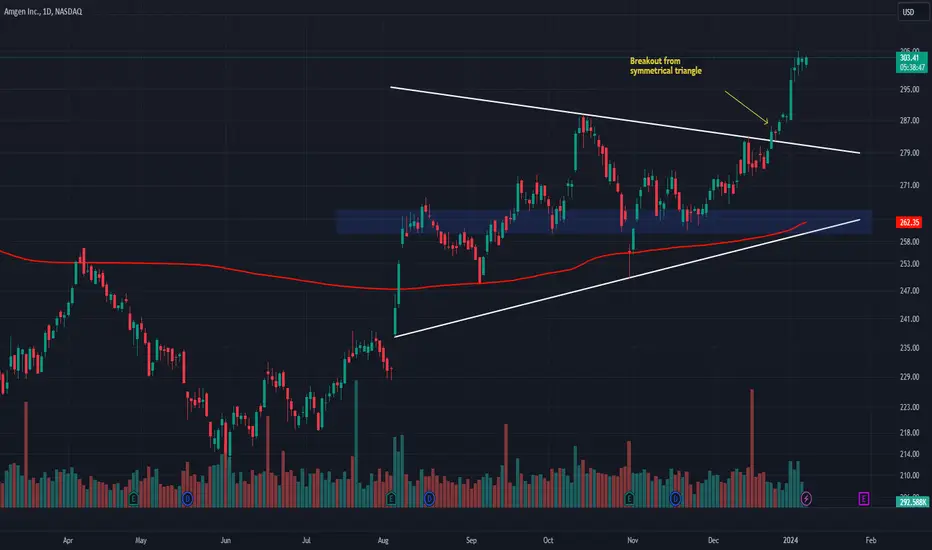
It took a year to come back 2 breakout pointAlmost a year to reach breakout point. This time cup is formed.best entry on candle formation.
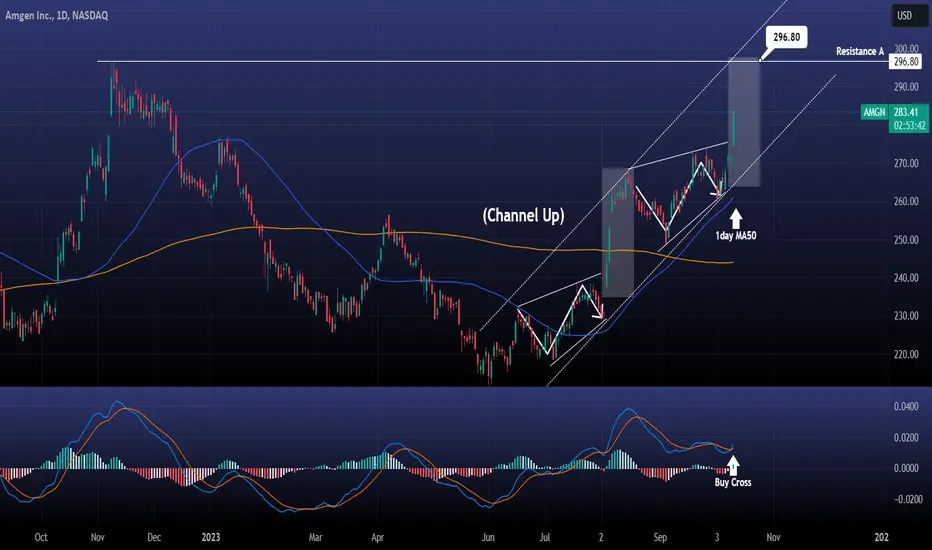
AMGEN is exploding upwardsAmgen / AMGN is having an incredible price jump on a 1day MACD Buy Cross.
Inside this long term Channel Up pattern, the stock isn't unfamiliar at all with such explosive legs upwards as the same move happened in August 4th/7th/8th.
It is a clear wedge consolidation into aggressive expansion pattern. All supported by the 1day MA50.
It is not too late to buy and target 296.80 (Resistance A).
Follow us, like the idea and leave a comment below!!
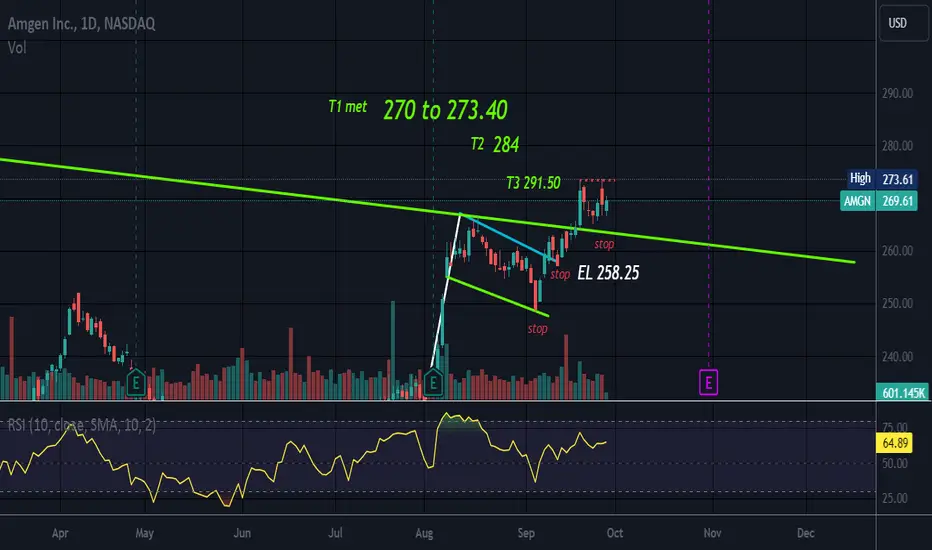
Bull FlagT1 has been met.
Sometime T1 is all we get.
Diagonal Resistance was broken and is now support.
No recommendation
AMGEN Short-term buy signalAmgen Inc (AMGN) broke above the quick Bull Flag pattern and is targeting the top of the Channel Down pattern at 277.00. Based on the 1D MACD, this is a symmetrical bullish sequence as the one that peaked in early November. That will be a major test for the uptrend as the longer the price stays high, the easier it will form a 1D Golden Cross, the first since February 22 2023.
-------------------------------------------------------------------------------
** Please LIKE 👍, FOLLOW ✅, SHARE 🙌 and COMMENT ✍ if you enjoy this idea! Also share your ideas and charts in the comments section below! **
-------------------------------------------------------------------------------
💸💸💸💸💸💸
👇 👇 👇 👇 👇 👇

10 Stock Picks in my PortfolioIntroduction:
I'm excited to share my trading journey on TradingView, where I'll be posting a carefully curated list of 10 stocks every trading day, and sometimes even multiple times a day. Through this endeavor, I aim to foster a dynamic environment where market enthusiasts can stay informed and engaged with real-time insights.
Why 10 Stocks?
The selection of these stocks is driven by a comprehensive analysis that takes into account various factors such as historical performance, price movements, and market trends. My algorithm examines a wide range of data points to identify stocks that show promising potential for growth or strategic value.
The Art of Stock Selection:
The stock tickers that make it to the list go through a rigorous evaluation process. I utilize a combination of quantitative metrics and qualitative insights to ensure that the stocks chosen have a strong foundation for potential profitability. This approach not only factors in financial indicators but also considers broader market dynamics.
Intermittent Updates:
To keep readers well-informed and engaged, I'll be posting these stock tickers intermittently throughout the trading day. This approach allows me to capture shifts in the market and share insights in real-time. By doing so, I aim to provide a valuable resource that helps traders and investors navigate the complexities of the stock market.
Your Feedback Matters:
As I embark on this journey, I wholeheartedly welcome feedback, discussions, and collaborations from fellow traders and investors. Your insights and perspectives are invaluable, and together, we can enhance our understanding of the market and refine our strategies.
Algorithm Overview:
In my script, I've developed an automated trading algorithm that utilizes the Alpaca API to manage a stock portfolio. The algorithm employs a systematic approach, leveraging historical price data and predefined criteria for buying and selling decisions.
Key Steps:
Setting Up:
I import the required libraries, configure Alpaca API credentials, and define the API's base URL for either paper or live trading.
Analyzing Account:
I fetch and display essential account details like equity, available cash, margin maintenance, day trading buying power, account status, and market open status.
Portfolio Evaluation:
I retrieve the existing portfolio positions and calculate their cost, market value, and profit/loss.
Using a DataFrame, I analyze this position data and perform calculations such as the sum of market values and costs.
Portfolio Sizing:
I determine the portfolio size based on a specified percentage of your account equity.
I set a condition to check if the market is open.
Data Retrieval:
I gather the list of stock tickers from the S&P500 index.
I obtain historical price data for these stocks within a defined date range.
Data Analysis and Selection:
I compute price changes, cumulative returns, and rank stocks based on recent performance.
From this analysis, I choose the top-performing stocks for potential inclusion in your portfolio.
Managing Positions:
I evaluate the current positions in your portfolio, decide which to retain, and identify new positions based on the analysis.
I calculate the necessary investment and quantity for each selected stock, considering portfolio sizing.
Order Execution:
I compare the existing portfolio with the new selections to determine which positions need buying or selling.
I place market orders to execute the necessary trades based on the earlier determined quantities.
Monitoring and Adjusting:
I introduce a delay (10 seconds in the code) before querying positions again.
This pause ensures that your portfolio reflects the recent trading activities.
Additional Note:
It's worth mentioning that I sometimes adjust the portfolio daily or multiple times a day, depending on market movements and volatility. I welcome any feedback on this experiment, as it's designed to gauge the interest of market participants. Please keep in mind that this initiative aims to better understand the dynamics of trading. As with any trading strategy, it's crucial to be cautious and thoroughly test the algorithm in a controlled environment before considering live trading. Remember that the success of trading algorithms hinges on various factors, including strategy quality, data accuracy, market conditions, and unforeseen events.

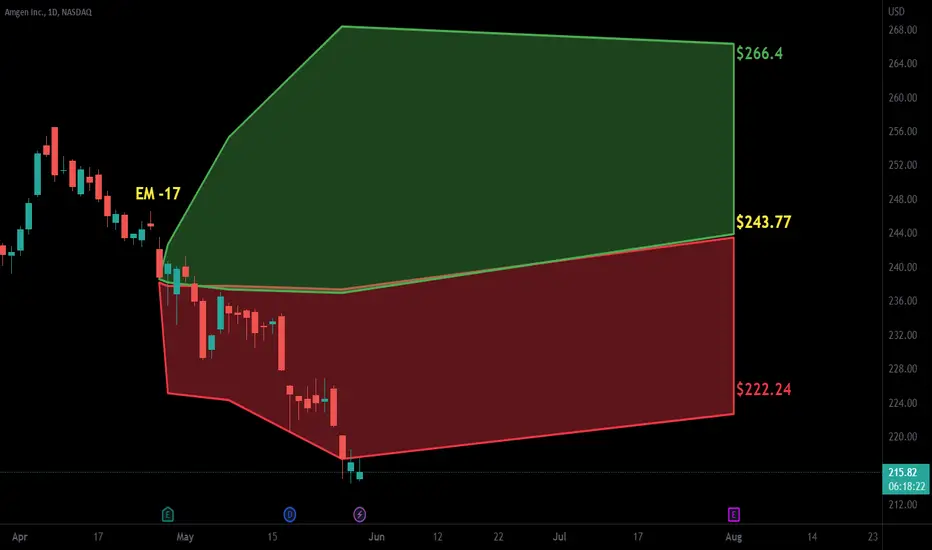
Amgen Inc. 20% ROI opportunities Amgen Inc. (AMGN) approaching significant resistance, able to absorb weekly buying pressures. From here (AMGN) can fall back to channel support, eliciting losses of 20% over the following 3-5 months. Inversely, if a settlement above this resistance level occurs, (AMGN) would be placed into a buy signal where gains of 20% would be expected over the following 5-6 months.

$AMGN with a bullish outlook following its earnings #StocksThe PEAD projected a bullish outlook for NASDAQ:AMGN after a negative over reaction following its earnings release placing the stock in drift C with an expected accuracy of 75%.
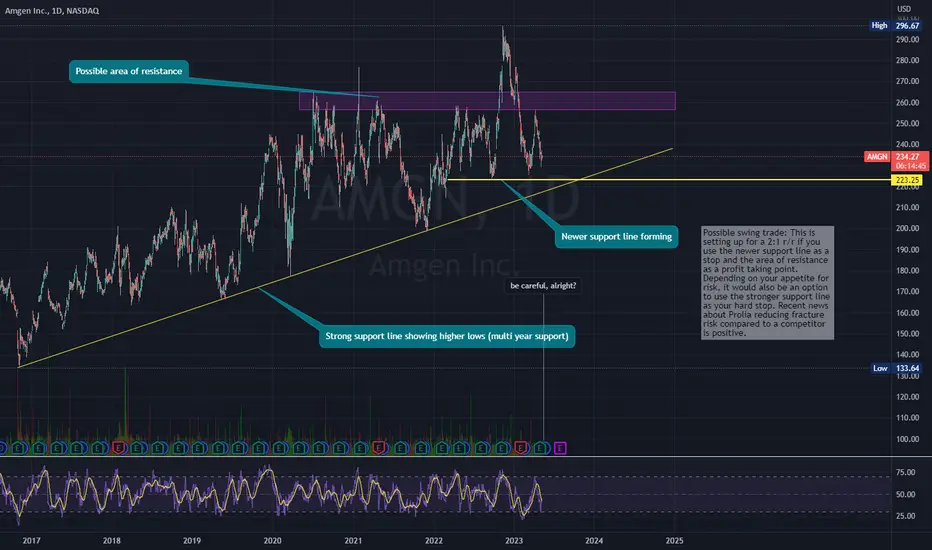
SneakerBunny: Possible setup for a swing on $AMGNPossible swing trade: This is setting up for a 2:1 r/r if you use the newer support line as a stop and the area of resistance as a profit taking point. Depending on your appetite for risk, it would also be an option to use the stronger support line as your hard stop. Recent news about Prolia reducing fracture risk compared to a competitor is positive. DYOR and....be careful alright?
Amgen is Forming a Cup & HandleKeep Amgen on your radar. It has formed a rather large cup and I've measured the conservative parameters for the cup height.
Conservative price target: FWB:280
No position yet but I'll be watching the daily candles and volume to snipe the entry when it reverses.
Stay tuned!