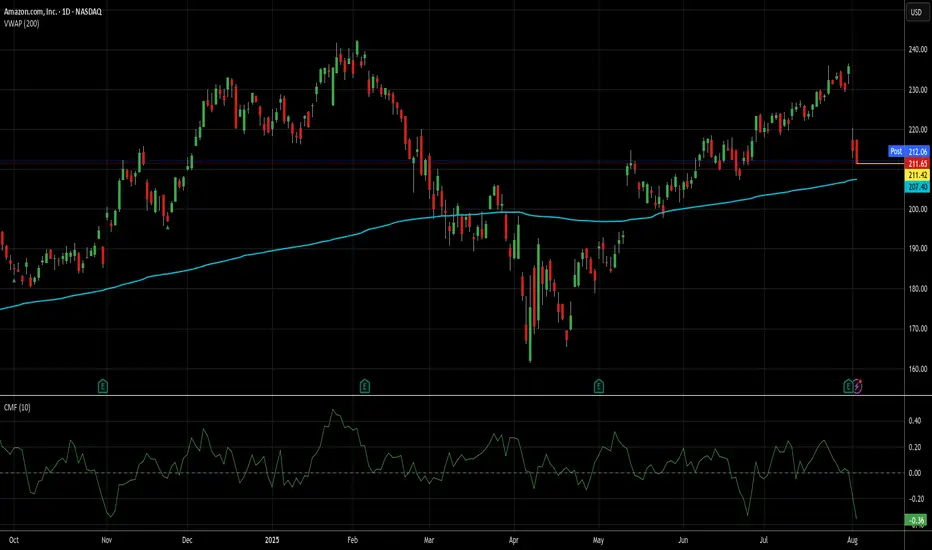
Not a perfect setup, but it's AMZN, so I'm in at 211.65.It may be a touch early to take this trade, but I"d always rather be early than late on AMZN trades. This particular setup isn't exactly like the first 2 ideas I posted about AMZN, but it's been very profitable in general, even if it hasn't done that well on AMZN recently. That said, results of trades tend to mean revert just like stocks usually do (at least mine do).
Since the beginning of 2024, there have been 45 signals for AMZN using the method I'm using today. 43 of those produced wins, while 2 are open and losing (down 12% and 8% respectively). I'm not worried about those 2, because over the long haul, those losers eventually become winners almost 100% of the time, it's just a question of how long it takes.
I just closed a RDDT trade today that's been open since Valentine's Day (see my ideas for details on that) that when tactical DCA and quick closes of them were factored in, made 6x the long term average daily return for stocks while RDDT only went up 3%. AMZN has a longer, better track record of recovery than RDDT, so I'm not even a little worried about my money here.
The average gain and trade length over these last 19 months has been kind of spoiled by those losers and a couple of other lots that took a long time to close and made almost nothing. The average trade here took just under 13 trading days and yielded only about 2.26%. That's not great for me, but a) it's still a daily rate of return (.178%) about 4x the long term average of stocks, and b) 75% of the trades produced an average daily return better than that.
Additionally, AMZN is still above its 200d VWAP and money flow is at its lowest levels since November. While not perfect, low money flow levels in a stock like AMZN does a pretty good job of, if not picking a short/med term bottom, usually getting you closer to it than not.
71% of these trades closed in a week or less, so that is my goal here. If it's longer than that and AMZN throws off another buy signal, I will add accordingly, though additional lots will be exited at the first available profitable close.
As always - this is intended as "edutainment" and my perspective on what I am or would be doing, not a recommendation for you to buy or sell. Act accordingly and invest at your own risk. DYOR and only make investments that make good financial sense for you in your current situation.
AMZN trade ideas
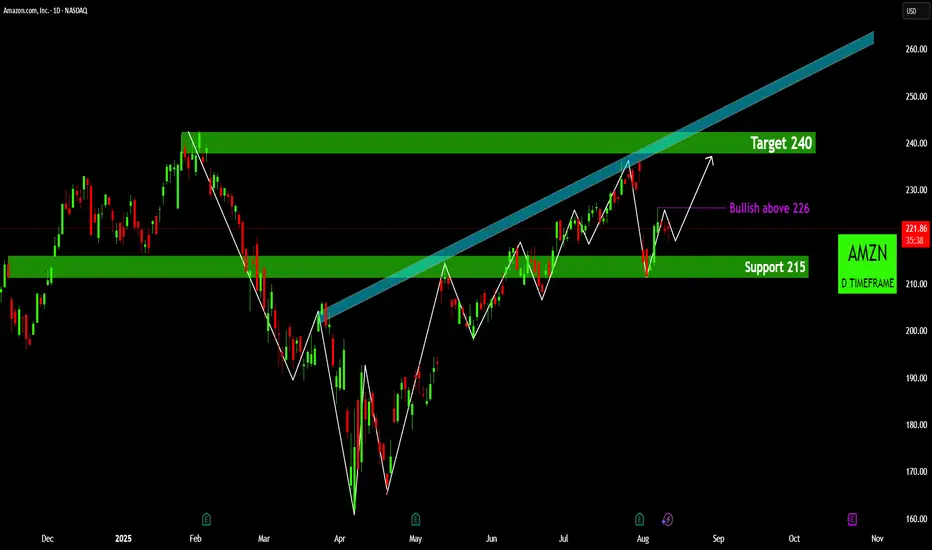
AMZN's Path towards 240AMZN: Primed for a Rebound? 🚀 Bullish Signals Emerging!
•Pivotal Support Holding Firm: The price has found robust demand around the 215 support zone 🟢, a critical area that has demonstrated its strength in halting previous declines. This level is proving to be a formidable floor, absorbing selling pressure and hinting at buyer conviction.
•Developing Bullish Reversal Pattern: A clear bullish reversal pattern, resembling an inverse head and shoulders or a W-bottom, appears to be unfolding. This formation, characterized by successive higher lows, signals a significant shift from bearish to bullish sentiment.
•Key Bullish Confirmation Point: For an accelerated move higher, a decisive and sustained break above the 226 level ⬆️ is crucial. This price point represents a significant resistance flip, and a push beyond it would likely trigger further buying momentum, confirming the bullish bias.
•Eyes on the Upside Target: Should AMZN successfully break past the 226 confirmation level, the immediate upside target is projected towards the 240 resistance zone 🎯. This area represents a key supply zone from earlier price action, and reaching it would mark a substantial recovery.
Disclaimer:
The information provided in this chart is for educational and informational purposes only and should not be considered as investment advice. Trading and investing involve substantial risk and are not suitable for every investor. You should carefully consider your financial situation and consult with a financial advisor before making any investment decisions. The creator of this chart does not guarantee any specific outcome or profit and is not responsible for any losses incurred as a result of using this information. Past performance is not indicative of future results. Use this information at your own risk. This chart has been created for my own improvement in Trading and Investment Analysis. Please do your own analysis before any investments.
Catch the Short on AmazonHello I am the Cafe Trader.
Today we are again looking at AMZN.
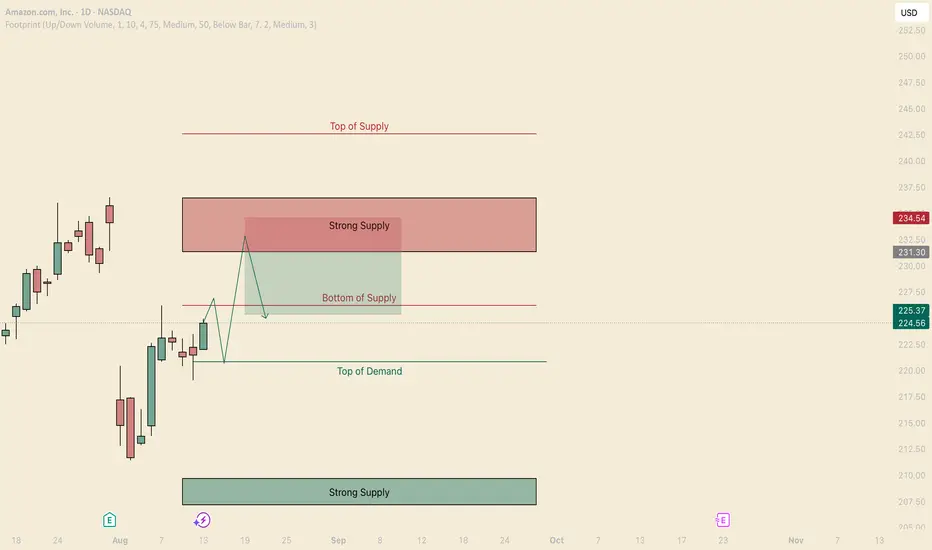
We are in the middle of a range. Buyers are currently in control in the short term, but I am expecting a Hot reaction off that strong supply level. This can be especially suitable for a quick options flip (same day, or overnight hold).
Short Setup
Entry: $231.30 (Bottom of Strong Supply)
Stop: $234.50 (Top of Strong Supply)
TP: $225.30 (2R target)
Notes: Looking for a hard rejection out of supply. If we do not close inside the strong supply zone, this would be bearish. you may have to be patient intraday on this one.
If we do get a really strong reaction and actually take out the new buyers trying to step in, This will not look good for AMZN as a whole, and we could expect it to break those previous lows (eventually tapping into strong supply)
Hope everyone does well, and happy trading!
@thecafetrader
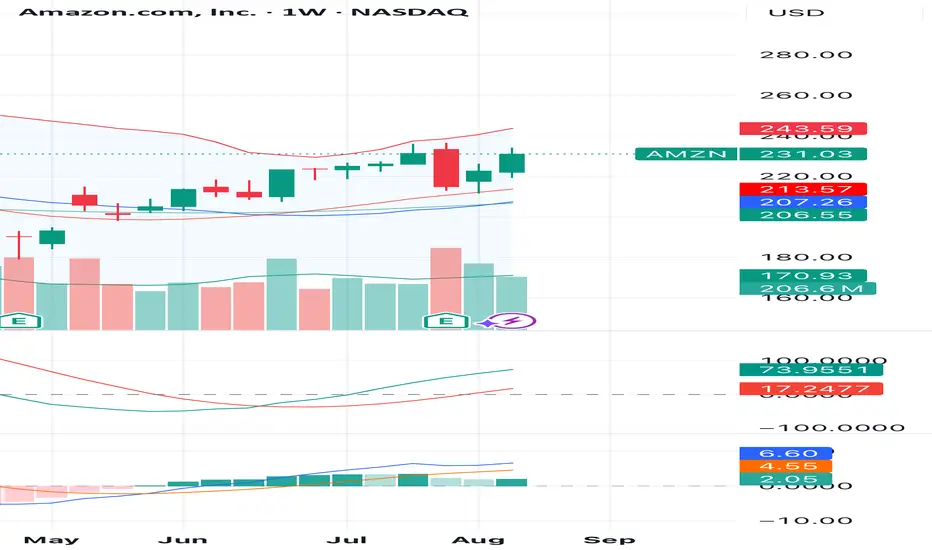
Amazon.com Inc. (AMZN) – Bullish SetupAMZN closed at $231.03 and is showing strength after bouncing from the support zone around $207 – $213. The weekly chart indicates buyers are regaining control, supported by increasing volume and positive momentum indicators.
🎯 Targets:
• First target: $243
• Second target: $260
Stop-loss: Weekly close below $213.
The 3 Step Rocket Booster "Once you master this strategy ..."When you watch this video i want you to think of the
the 3 step rocket booster strategy.
Once you master this strategy then it will
be easy for you understand the other indicators
and how they work.
This video is very very advanced and i dont expect you to understand
unless you are a trading expert.
But the point am trying to make to you
is that everything is connected.
Even understanding one strategy is better than
understanding not even one.
understanding one strategy is the building block.
So in this video am taking you through
the building blocks of trading.
My strategy is very advanced but i want to show you
that even in this advanced strategy
the Rocket booster strategy
is a building block.
So watch this video to learn more now.
Rocket boost this content to learn more.
Disclaimer:Trading is risky please learn risk management and profit taking strategies also feel
free to use a simulation trading account
before you trade with real money.

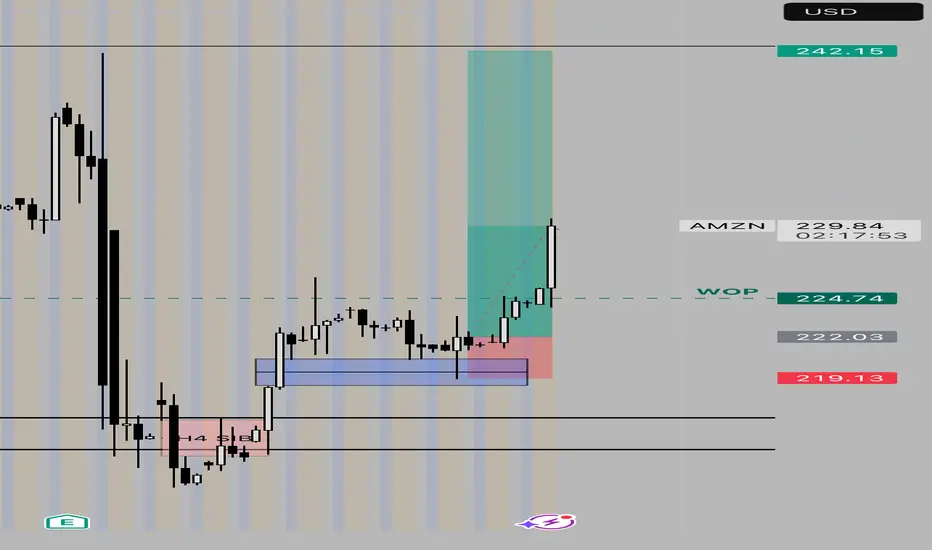
Amzn CallsLooking from Monthly perspective in alignment with the weekly and H4 pd array execution idea. Partials taken, risk free for the rest and in BE.
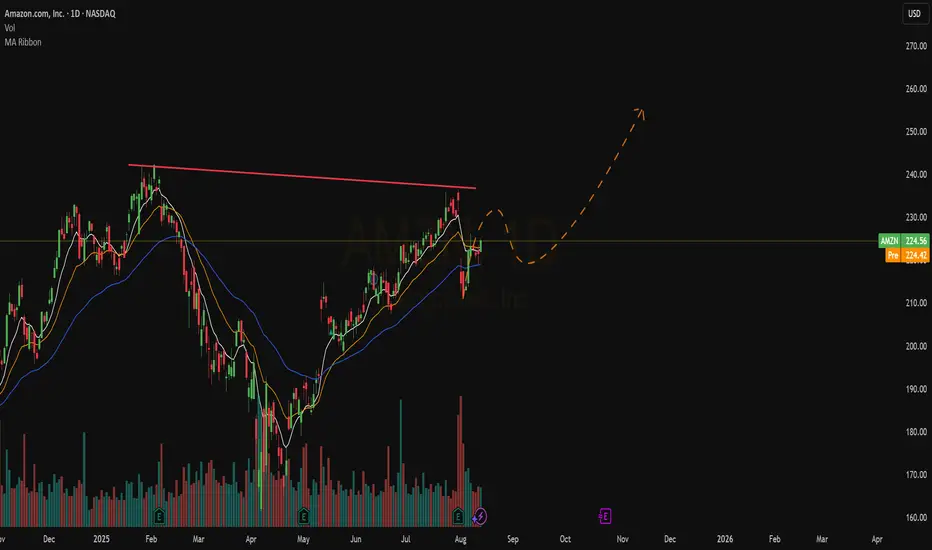
New Setup : AMZNThe daily chart sees a good stop on the ema 50d with decreasing volume.
$237 is going to be a strong resistance but if passed, will lead the stock higher.
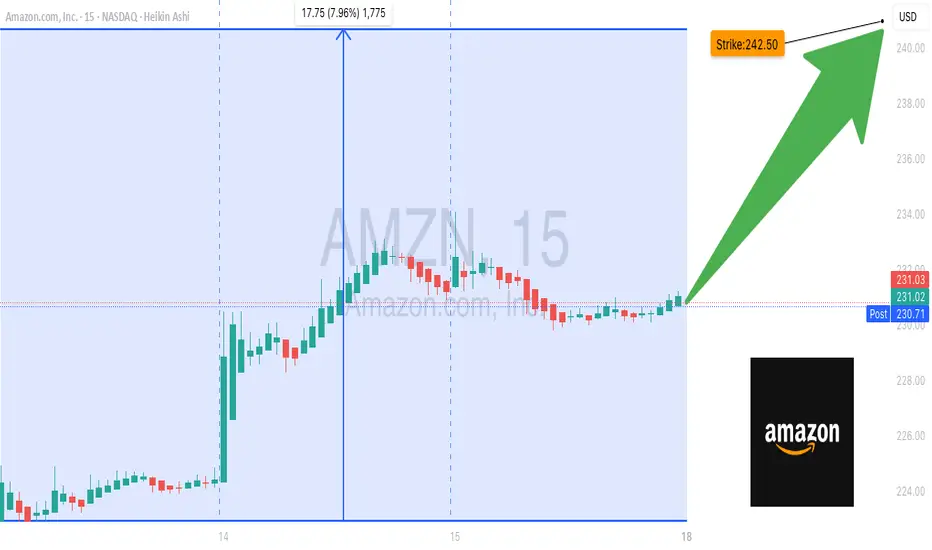
Don’t Miss: AMZN Call Opportunity at $242.50! 🚀 AMZN Swing Alert – 2025-08-15 🚀
**Sentiment:** Moderate Bullish
**Setup:** Call Option Trade
---
## 📈 Market Snapshot
* **Daily RSI:** 61.5 → Strong bullish momentum
* **5 & 10-Day Trend:** +3.68% / +7.52% → Confirmed upside
* **Volume:** Avg (1.0x) → Lacks strong institutional confirmation
* **Call/Put Ratio:** 1.00 → Neutral sentiment
* **VIX:** 14.84 → Low volatility, ideal for controlled swings
---
## ⚖️ Consensus & Conflicts
**Agreement:**
* Bullish momentum recognized across multiple models
* Favorable market conditions for swings
* Weak volume highlighted as a risk
**Disagreement:**
* Some models (Claude/Anthropic) advise caution, suggesting no immediate trade
* Confidence varies: DeepSeek favors a stronger bullish call, others remain cautious
---
## 🎯 Trade Setup – AMZN CALL
**Entry Condition:** At market open
**Strike:** \$242.50
**Expiration:** 2025-08-29
**Entry Price:** \$0.85
**Confidence:** 75%
**Profit Target:** \$2.13 (150% gain)
**Stop Loss:** \$0.50 (30% of premium)
**Key Risks:**
* Weak volume may reduce momentum sustainability
* Market shifts require active monitoring
---
## 📝 TRADE DETAILS (JSON)
```json
{
"instrument": "AMZN",
"direction": "call",
"strike": 242.5,
"expiry": "2025-08-29",
"confidence": 0.75,
"profit_target": 2.13,
"stop_loss": 0.50,
"size": 1,
"entry_price": 0.85,
"entry_timing": "open",
"signal_publish_time": "2025-08-15 11:56:23 UTC-04:00"
}
```
---
## 📊 Quick Reference – TradingView Ready
🎯 **Instrument:** AMZN
🔀 **Direction:** CALL (Long)
💵 **Entry Price:** \$0.85
📈 **Profit Target:** \$2.13
🛑 **Stop Loss:** \$0.50
📅 **Expiry:** 2025-08-29
📏 **Size:** 1 contract
⏰ **Entry Timing:** Market Open
🕒 **Signal Time:** 2025-08-15 11:56 EDT
---
### Suggested Viral Title & Tags:
**🔥 AMZN Swing Alert: Call Setup Ready – Strike \$242.50 🚀**
\#AMZN #SwingTrade #OptionsTrading #Bullish #CallOption #Momentum #TradeSetup #TechnicalAnalysis #StockAlerts #Finance #TradingSignals #MarketWatch #LongTrade
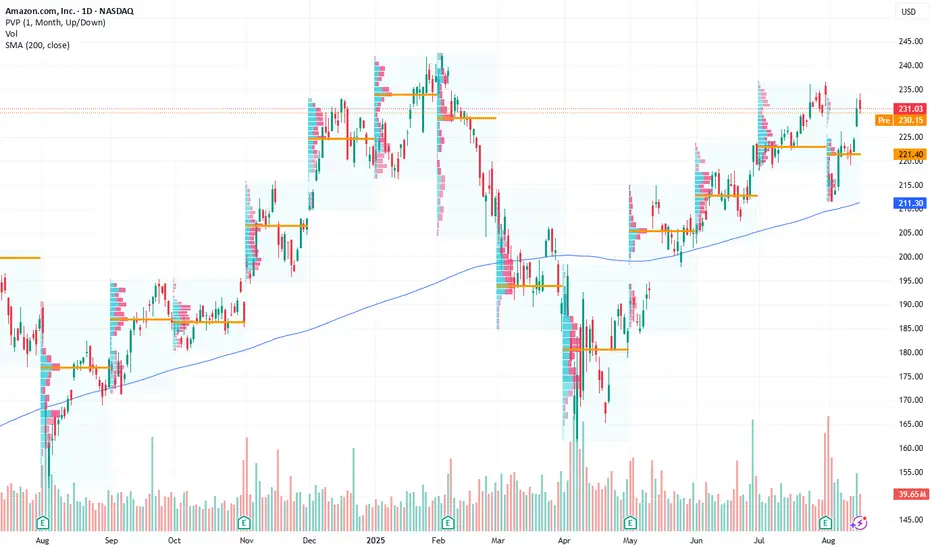
AMZN: Bullish Technical Setup Points to $240 TargetCurrent Price: $231.03
Direction: LONG
Targets:
- T1 = $236.50
- T2 = $240.00
Stop Levels:
- S1 = $228.00
- S2 = $225.00
**Wisdom of Professional Traders:**
This analysis synthesizes insights from thousands of professional traders and market experts, leveraging collective intelligence to pinpoint high-probability trade opportunities in AMZN. The wisdom of crowds principle suggests that consolidating expert knowledge can highlight actionable patterns with reduced biases.
**Key Insights:**
AMZN is currently demonstrating strong bullish momentum following a breakout above its 50-day moving average. Traders have noted robust demand in AMZN tied to the company’s dominance in e-commerce as well as accelerating growth in its Amazon Web Services (AWS) division. This technical breakout aligns with a period of relative strength in tech stocks overall, making AMZN well-positioned to push higher in the near term.
Another standout factor supporting bullish sentiment is institutional buying activity, which appears to have significantly increased alongside positive earnings expectations. Analysts point to AMZN’s ability to outperform across its business segments during macroeconomic uncertainties. Furthermore, volume profiles indicate that rising accumulation is taking place, reflecting growing confidence among professional investors.
**Recent Performance:**
In the last two weeks, AMZN has climbed approximately 4%, moving from the $221 range to its current price of $231.03. The stock has successfully achieved a higher high after bouncing from key support levels near $220. Additionally, relative strength index (RSI) metrics suggest AMZN remains in bullish territory, with no overbought signals at the current stage. This price action indicates continuing upward momentum backed by solid fundamentals.
**Expert Analysis:**
Technical analysts stress that sustaining prices above $230 represents a significant psychological threshold for AMZN to take aim at $236 and $240 levels. The moving average convergence divergence (MACD) indicator has turned positive, signaling momentum reinforcement. Moreover, Bollinger Bands suggest room for wider upward price moves, as AMZN has remained on the upper side of volatility thresholds but far from breakout extremes.
On the fundamental side, industry experts remain optimistic about AMZN’s ability to drive growth, particularly as AWS continues to expand its customer base across lucrative cloud segments. Revenue forecasts show resilience despite wider market concerns, further bolstering bullish sentiment around the equity.
**News Impact:**
Recent news about AMZN’s push to revolutionize supply chain efficiencies with AI-driven technology has injected optimism into the stock’s outlook. Additionally, improved operational strategies in key international markets have supported confidence in future profitability. Attention around these developments is drawing positive sentiment from institutional investors, further strengthening AMZN's near-term trajectory.
**Trading Recommendation:**
AMZN offers a compelling LONG opportunity at these levels, supported by technical and fundamental evidence. The stock is well-positioned to rally towards its next resistance level of $236.50, while the upside could extend to $240.00 under favorable conditions. Stop placements at $228 and $225 provide ample risk control to safeguard against reversal scenarios. Traders should remain watchful of external events that could impact overall tech sentiment but capitalize on AMZN’s bullish structure.
Do you want to save hours every week?
AMZN - LONG Swing Entry PlanNASDAQ:AMZN - LONG Swing Entry Plan
Entry Zone 1: $220.00 – $217.00
→ Open initial position targeting +8% from entry level.
Entry Zone 2: $212.00 – $209.00
→ If price dips further, average down with a second equal-sized entry.
→ New target becomes +8% from the average of Entry 1 and Entry 2.
Edit Zone : $192.00 – $190.00
→ If reached, enter with double the initial size to lower the overall cost basis.
→ Profit target remains +8% from the new average across all three entries.
Risk Management:
Stop Loss:
Risk is capped at 12% below the average entry price (calculated across all executed positions including the Edit Zone).
Position Sizing Approach:
Entry 1: 1x
Entry 2: 1x
Edit Zone: 2x
→ Total exposure: 4x
→ Weighted average determines final TP and SL calculations.
______________________________________
Legal Disclaimer
The information provided in this content is intended for educational and informational purposes only and does not constitute financial, investment, or legal advice or recommendations of any kind. The provider of this content assumes no legal or financial responsibility for any investment decisions made based on this information. Users are strongly advised to conduct their own due diligence and consult with licensed financial advisors before making any financial or investment decisions.
Sharia Compliance Disclaimer: The provider makes no guarantees that the stocks or financial instruments mentioned herein comply with Islamic (Sharia) principles. It is the user’s responsibility to verify Sharia compliance, and consultation with a qualified Sharia advisor is strongly recommended before making any investment decisions

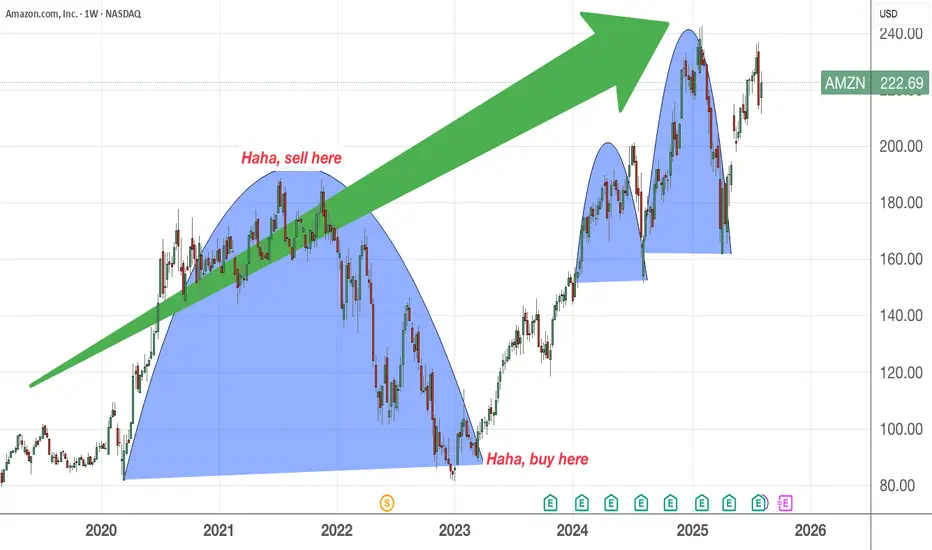
Buy Low , Sell High MythOn hindsight, it is easier to say , sell high and buy low since you can see the price movments happening already! On a day to day basis, it is much harder as the price patterns are evolving...
Plus the media would do what it is supposed to do - create sensational headlines to capture your readership and the more bloody or negative the better ! And many retail investors tend to freak out when reading these news and sell their shares. The challenge is they may not be so lucky to capture it at the bottom price and weeks or months later, they decide to enter the market because it is hot again, many people are talking about it, analysts recommendations, etc
The one thing I have learnt throughout the years is sitting tight and doing nothing. It is really difficult at times when you see your profits evaporated or dwindled from say , 25% to 3% and you were thinking to yourself - I should have sold some earlier and took some profits............
Maybe you were busy, lazy or forget about it, after some time when you look back, the market has rewarded you with your patience. Profits start to climb up and things are looking good again. Then it happens again much like the valleys in the chart, up and down , up and down........
On a 10-20 years basis, a fundamentally good stock will be on its upward trajectory and delivers solid capital gains to those who believe in its growth story and willing to ride the short term roller coaster ride and emerge as winners much later........
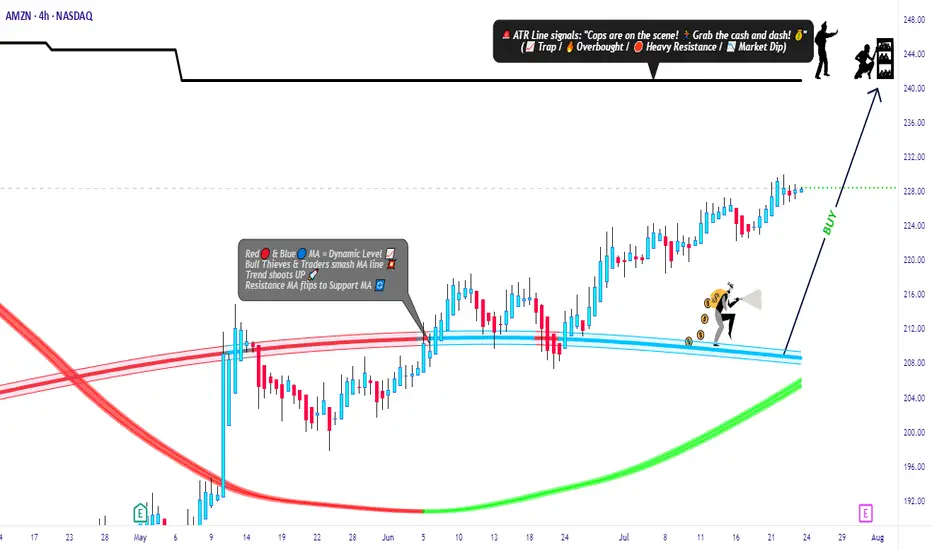
Amazon Market Robbery Blueprint – Swing/Scalp Long Setup🟨💣 “AMZN Market Heist Blueprint – Bullish Robbery in Progress 🚨💼💸” 💣🟨
By Thief Trader – Rob the Market with Precision
🌍 Hello World! Hi, Hola, Ola, Bonjour, Hallo, Marhaba!
🤑💰 Calling all Money Makers & Market Robbers – get ready to execute the next bullish heist on AMAZON.COM, INC (NASDAQ: AMZN), powered by our signature Thief Trading Style™ – where technical precision meets psychological warfare.
🔥 Plan Summary:
Based on our fundamental & technical intel, we’re eyeing a long entry into AMZN. The target? 💥The High-Risk ATR Police Barricade Zone – a zone flooded with liquidity, overbought conditions, fakeouts, and bear traps. It's where most traders get caught – but we walk in with a blueprint.
🟩 Entry Zone – “The Vault Is Wide Open!” 💼📈
🕰 Entry timeframe: 15min / 30min (preferably after confirmation or rejection wick)
💵 Buy Limit Orders: Place multiple layered entries (DCA-style) near recent swing lows/highs. Wait for breakout confirmation; no blind orders before breakout!
Thief Note: This isn’t spray-and-pray – this is sniper-mode. Scope, place, execute.🎯
🛑 Stop Loss – “SL is the Escape Route!”
📍 SL below recent 4H candle wick swing low (around 219.00 – adjust based on your risk/margin size).
Important: Only place SL after breakout; not before. Risk per order must match your lot strategy.
🎯 Target – “Grab the Bag or Escape Before the Alarms!”
💸 Target Zone: 240.00
🧠 Smart robbers know when to bail early – use a trailing SL to lock gains. Exit before reversal or heavy volume shift.
👀 Scalper Alert – “Only One Way – LONG!”
If you’re a quick thief with a fat bag, hit-and-run with a Long scalp. If you’re running lean, swing with the crew. Watch the PA and news timing. Trailing SL = insurance policy.
📊 Why Bullish? Here’s the Background:
🔍 Macro Drivers
💼 COT Report
🌍 Geo-political Influences
🧠 Sentiment Score
📈 Index Correlation
🔮 Intermarket Signals
💹 Institutional Positioning
All lights flashing green for short-to-midterm bullishness, but keep checking real-time updates.
⚠️ Risk Alert – News Triggers Can Blow Your Cover 🚨
🗞 Avoid trading near major news releases – they cause volatility spikes.
🧲 Always protect gains with trailing stops and don’t over-leverage your ammo.
💖 Support the Robbery – Hit BOOST 🔥
Smash that 💥BOOST💥 button if you ride with the Thief Trading Crew!
Let’s build this into the #1 robbery squad on TradingView.
Make money. Protect profits. Trade like a bandit – with a plan. 💼📈🏆
🔔 Stay Tuned for the Next Robbery Mission 🔔
Another heist plan dropping soon. Until then, rob smart, rob safe, and rob rich.
– Thief Trader™ | Rob The Market. Not Your Wallet.
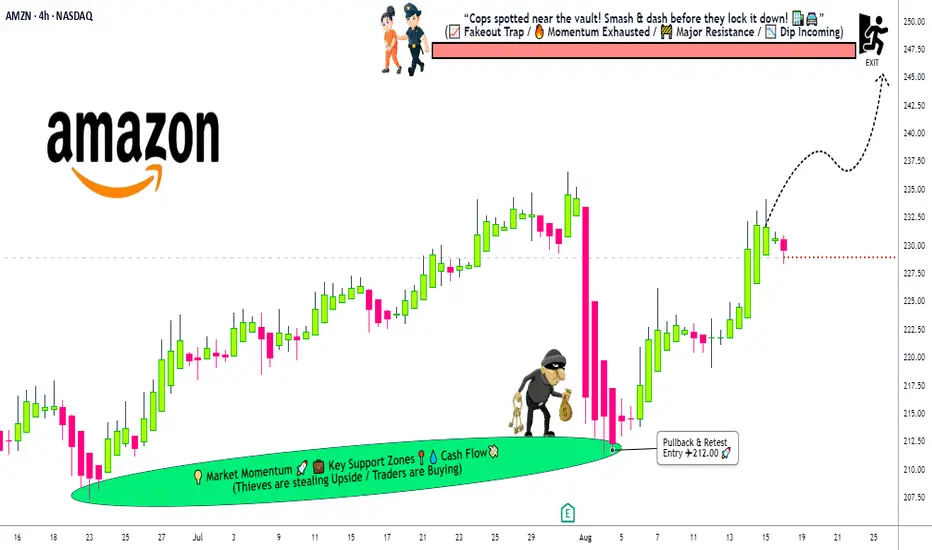
Amazon Stock Heist: Thieves Targeting 247 Escape Point🔐💰 AMAZON HEIST PLAN – STOCK MARKET ROBBERY STYLE 🚀📈
👋 Hey Thief OG’s, Money Grabbers & Market Shadows!
Today’s mission is inside the vault of Amazon.com Inc. (AMZN) – and we’re planning a Bullish Heist.
🎯 ENTRY – Layering the Break-In 💎
The vault doors are always open for the thief gang!
Place multiple Buy Limit Orders (layer entries) at 🏦:
230.00 / 227.00 / 225.00 / 222.00
You can add more layers to your heist plan based on your own risk appetite.
Thief strategy = stack the entries, wait for the pullback, strike big.
🛑 STOP LOSS – Thief Escape Route 🚔
This is the official Thief SL: @219.00.
But remember OG’s – adjust your SL based on your own strategy & bag size.
We don’t all run with the same loot.
🎯 TARGET – Police Barricade 🚨
Before the sirens ring, our escape bag is ready at @247.00.
That’s where we dump the loot and vanish into the shadows. 🏃💨💼
🕵️♂️ THIEF STYLE STRATEGY
✅ Layering entry method (multiple buy limits = thief stacking plan).
✅ Risk management = key to survival.
✅ Exit before the market police catches you.
💥 Remember OG’s: This is not financial advice – this is a robbery simulation in the stock market.
Support the gang 👉 Smash the Boost Button 💥 so our heist team gets stronger!
🤑💼💰 Every day, every chart, every loot = Thief Trader Style.
Stay sharp. Stay hidden. Stay profitable.
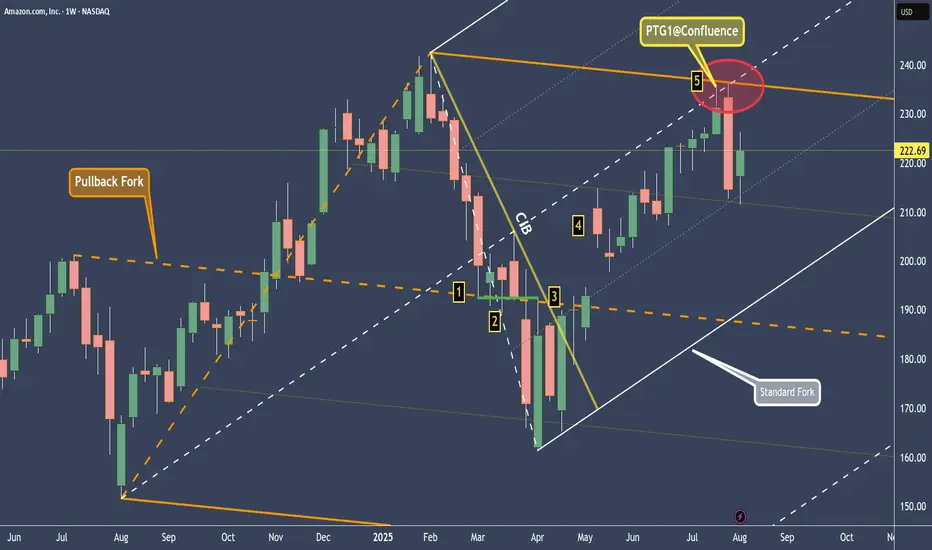
AMZN - Amazon Hit The 80% profit Target. Trend change ahead?On this chart we have 2 forks.
Orange: the pullback fork
It shows us where the equilibrium is — at the centerline, which the market respected to the tick (1).
After that, there were several bars that formed support (2).
When the CIB line was broken (3), the market gapped above the orange centerline and made its way up to the white centerline (5), the target that we can expect in around 80% of all cases.
Note the confluence point where the centerline of the white fork and the upper median line parallel (U-MLH) of the orange fork meet.
A day later, we saw a sharp sell-off within just one bar! Is this now another trend reversal?
No, clearly not.
For a trend reversal to occur, the market would have to break the white L-MLH (lower median line parallel). As long as the market is trading within the white fork, we remain long.
I’ll make a YT video soon, covering the details.
Wishing you all a successful new trading week.
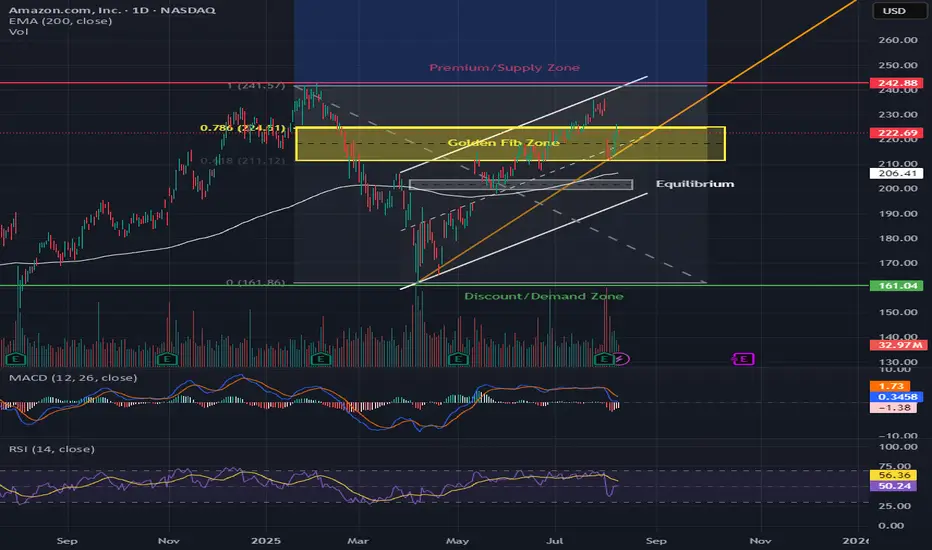
AMZN Breaking Out of Golden Fib Zone–Next Stop $243 or Pullback?📊 Market Breakdown
AMZN is trading at $222.69, having just broken out of the Golden Fib Zone ($211–$224) after bouncing off the equilibrium (~$206). The breakout puts price on track to test the Premium/Supply Zone ($242.88), but RSI at 56 shows there’s still gas left before hitting overbought territory.
Trend: Strong recovery rally from $161 lows, now riding an ascending channel.
Key Structure: Fib 0.786 retracement level ($224) now being tested; a clean hold here is bullish.
Volume: Breakout volume modest, meaning we still need confirmation from buyers.
Indicators:
MACD: Bullish crossover intact.
RSI: 56.36 – mid-range, plenty of upside potential.
🛒 CALLS (Bullish Scenario)
Buy Zones:
🎯 Aggressive Entry: Retest of $218–$220 support (Fib 0.786 area)
✅ Confirmation Entry: Daily close above $224 with increased volume
Take Profits:
1️⃣ $230 – Minor resistance
2️⃣ $242 – Premium/Supply Zone top
3️⃣ $250 – Channel extension target
Stop-Loss: $216
Why This Works: Holding above the Golden Fib Zone opens the path to supply at $242+ within 2–3 weeks.
🛑 PUTS (Bearish Scenario)
Sell Zones:
🚨 Aggressive Entry: Rejection at $224 resistance
📉 Breakdown Entry: Daily close below $216
Take Profits:
1️⃣ $206 – Equilibrium zone
2️⃣ $190 – Mid-channel support
3️⃣ $161 – Discount/Demand Zone
Stop-Loss: $227
Why This Works: A failed breakout with a close below $216 flips short-term momentum bearish, targeting $206 and possibly $190 in 1–2 weeks.
🔍 Technical Highlights
Golden Fib Zone: Price broke above but needs a retest hold for confirmation.
Supply Zone Test Ahead: $242 is a strong resistance area.
Macro Watch: AMZN often follows consumer spending & retail sales data; keep an eye on macro news.
⏳ Option Expiration Strategy:
1 Week: Rejection at $224 for quick puts
2–3 Weeks: Breakout holding $224 for calls toward $242
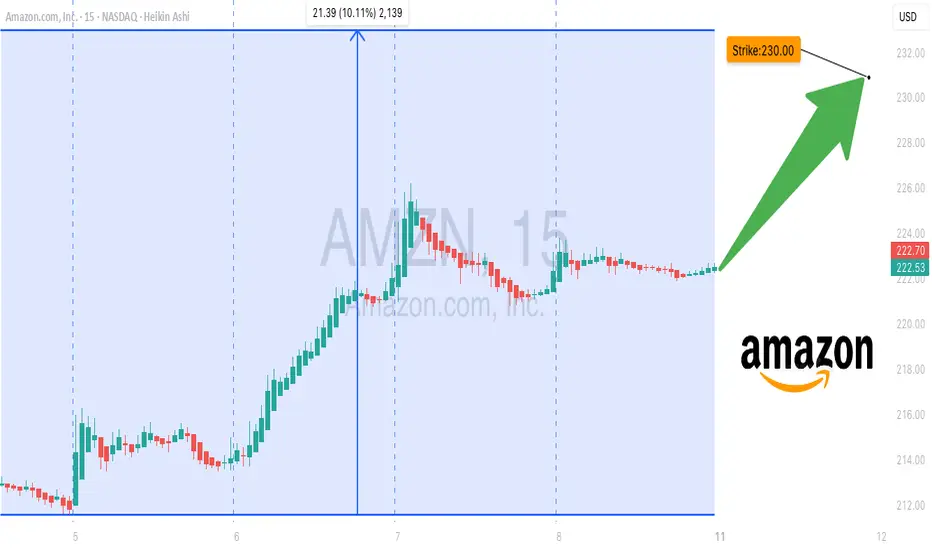
AMZN AMZN Bullish Setup --Don’t Miss Out🚀 AMZN Weekly Call Play — Riding the Bullish Flow**
Amazon (AMZN) shows strong institutional bullish flow with a **Call/Put ratio of 2.09**, backed by favorable RSI trends and low volatility conditions. While volume is weaker than last week, momentum and options flow point toward upside potential into next week.
**🛠 Trade Setup:**
* **Instrument:** AMZN
* **Direction:** CALL (LONG)
* **Strike:** \$230.00
* **Expiry:** 2025-08-15
* **Entry Price:** \$0.63
* **Profit Target:** \$1.26 (100% gain)
* **Stop Loss:** \$0.38
* **Size:** 1 contract
* **Entry Timing:** Market open
* **Confidence:** 65%
**📊 Key Factors:**
* Call/Put ratio: **2.09** — strong bullish options flow
* Daily RSI: 49.0, Weekly RSI: 58.3 — uptrend confirmation
* Low VIX (\~15.88) — supportive for directional plays
* Potential resistance at \$226–\$230
**⚠ Risks:**
* Weak weekly volume (0.8x prior week) may reduce conviction
* Broader market weakness could cap gains
---
**#AMZN #OptionsTrading #CallOptions #WeeklyOptions #BullishSetup #TechnicalAnalysis #TradingView #OptionsFlow #LowVIX #SwingTrade #MarketMomentum**
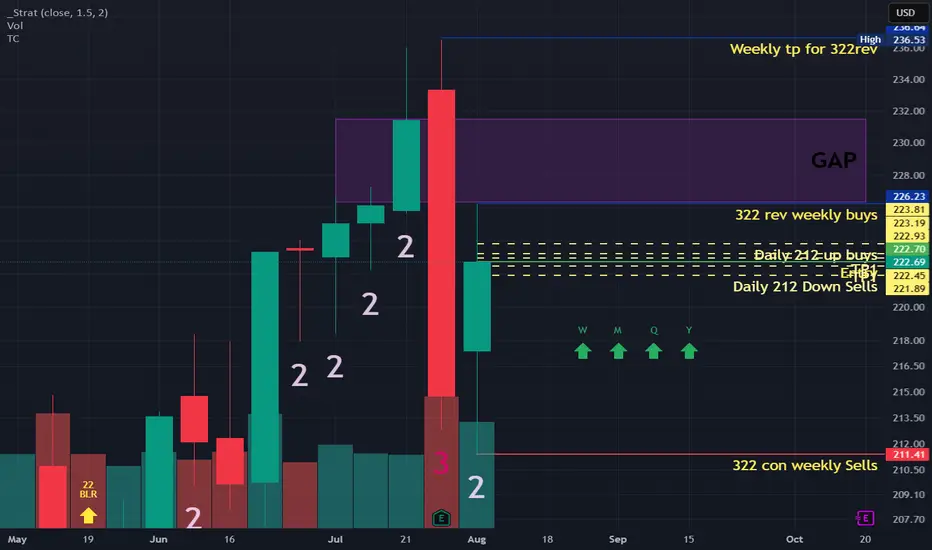
amazonMain set up is these 322 rev potentially back to previous highs all my boxes are check huge plus is that we got full time frame continuity on our side. Going 227 calls 1 or 2 weeks out to allow for the full move to be captured.
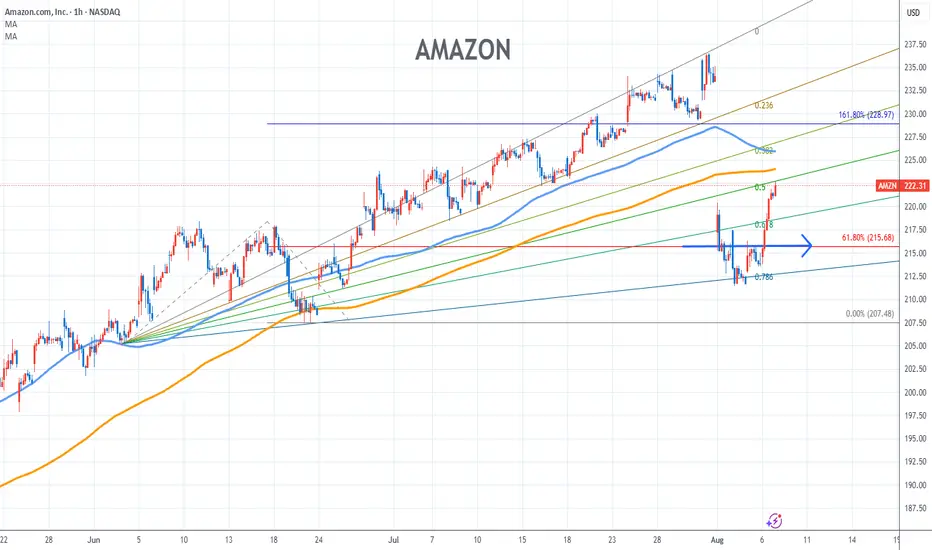
Amazon Stock Chart Fibonacci Analysis 080625Trading Idea
1) Find a FIBO slingshot
2) Check FIBO 61.80% level
3) Entry Point > 216/61.80%
Chart time frame:B
A) 15 min(1W-3M)
B) 1 hr(3M-6M)
C) 4 hr(6M-1year)
D) 1 day(1-3years)
Stock progress:A
A) Keep rising over 61.80% resistance
B) 61.80% resistance
C) 61.80% support
D) Hit the bottom
E) Hit the top
Stocks rise as they rise from support and fall from resistance. Our goal is to find a low support point and enter. It can be referred to as buying at the pullback point. The pullback point can be found with a Fibonacci extension of 61.80%. This is a step to find entry level. 1) Find a triangle (Fibonacci Speed Fan Line) that connects the high (resistance) and low (support) points of the stock in progress, where it is continuously expressed as a Slingshot, 2) and create a Fibonacci extension level for the first rising wave from the start point of slingshot pattern.
When the current price goes over 61.80% level , that can be a good entry point, especially if the SMA 100 and 200 curves are gathered together at 61.80%, it is a very good entry point.
As a great help, tradingview provides these Fibonacci speed fan lines and extension levels with ease. So if you use the Fibonacci fan line, the extension level, and the SMA 100/200 curve well, you can find an entry point for the stock market. At least you have to enter at this low point to avoid trading failure, and if you are skilled at entering this low point, with fibonacci6180 technique, your reading skill to chart will be greatly improved.
If you want to do day trading, please set the time frame to 5 minutes or 15 minutes, and you will see many of the low point of rising stocks.
If want to prefer long term range trading, you can set the time frame to 1 hr or 1 day.
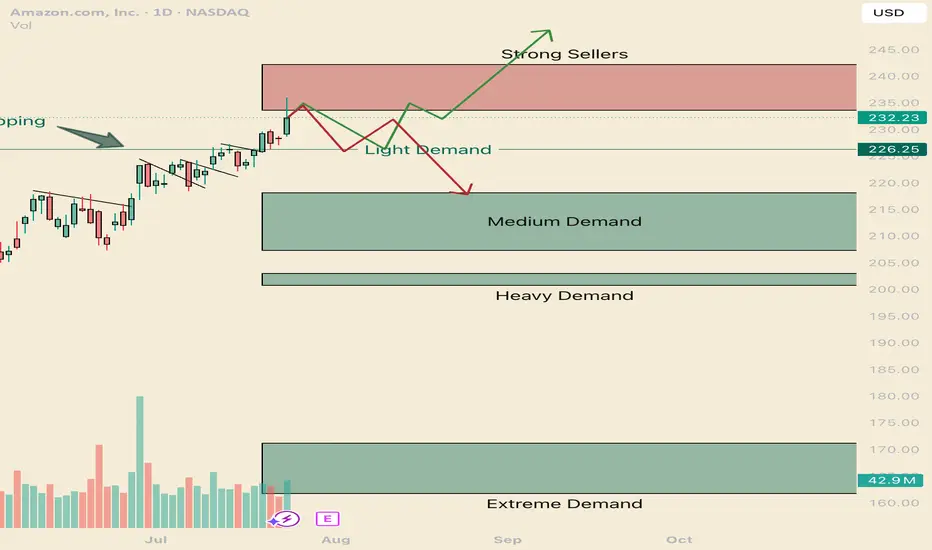
How to navigate the Amazonian Squeeze. AMZNHello I am the Cafe Trader.
This week has been a deep dive on the MAG 7 and today AMZN is up next.
We are going to look at long term and short term opportunities.
We are near the All Time Highs, with one final Seller to get through before making the break.
Today we tested to see if those sellers are there still (and indeed they are). Today was a key reaction, I'm going to give you the keys to profit.
Long Term
It's important to consider how aggressive you would like to be with pricing. This list of prices should align with your conviction with Amazon.
Aggressive: $226 is where the current aggressive players are sitting. They are going to look to buy again at this level, although they should be the weakest of the buyers.
Fair sentiment: 203-210 is where stronger buyers are sitting. I think this price is still realistic to get to.
Conservative: 161 - 171 Is a great price, buyers have shown to buy this with extreme demand. Amazon at this price is a fantastic purchase, if you are holding from here or lower, congradulations.
Short term
Testing the supply and rejecting tells us that sellers are still really active in this zone. We will see how tomorrow closes, if we do not close in the supply zone, there is a good chance that net week will have some bearish winds and a great chance of testing the light demand at 226. this brings us to the two trading ideas.
1 Green line
I think we will test those sellers by next week. and i think its very possible that we break trend and touch the light demand line. If its a slow drag down to the light demand, Shorts will have to cover as soon as any real demand shows up (Light Demand Line).
Entry 226.50
Stop 221.50
Partial TP 233, or you can hold for a test of the highs (242 would suffice)
2 Red Line
If we get a Hot reaction from the supply zone, or if we close below 233.50 tomorrow, Look for a retest and short entry off the supply zone. If the reaction starts to be slow (more than 5 days of red bars) it's likely this will turn into the green scenario.
Entry 233.5
Stop 237
Partial TP 226.5
Full TP 218
That's all for AMZN Follow for more!
Also comment if you would like me to chart a stock you are considering.
@thecafetrader
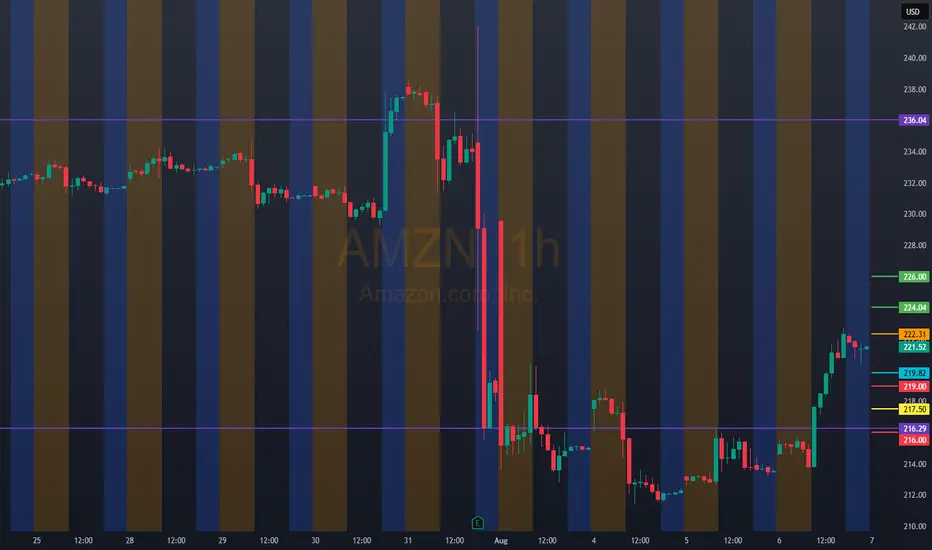
AMZN: 222.31Bullish Entry: Entry: 224.00 / 226.00
Stop: 216.00
Target: 228.00 / 230.00
Bearish Entry: Entry: 219.00/216.00
Stop: 224.00
Target: 213.00/210.00
learn how to read and use Angle of Descent
Angle of Descent is the inverse of Angle of Ascent. However, the downtrend runs faster and steeper than the uptrend. WHY? Because the uptrend builds on uncertainty and doubt from retail groups, while Dark Pools and professional traders buy quietly with the that the stock is at bargain prices and will resume and uptrend. Their buying creates the bottoms and nudges price to the upside. Their activity provides near term price direction for YOU to trade shortly after the Dark Pools have accumulated and when pro traders nudge price upward anticipating and setting up for HFT gap ups and smaller funds VWAPS chasing the HFT gaps.
Angle of Descent will always be faster, steeper and end abruptly as prices for shares fall well below the fundamental levels.
Studying the indicators that professionals use that indicate extreme selling helps you avoid getting into a sell short that whipsaws causing huge losses. When the Dark Pools start to trigger and buy, they are often buying stocks that retail day traders are trying to sell short.
Retail traders often lack an understanding of who controls price.
When a stock falls sufficiently below its fundamental values, Dark Pools will start buying in a slow steady TWAP Time Weighted at Average Price, creating a Buy Zone that can be seen on the stock chart if you know what to look for. That is your warning signal not to try and sell short.

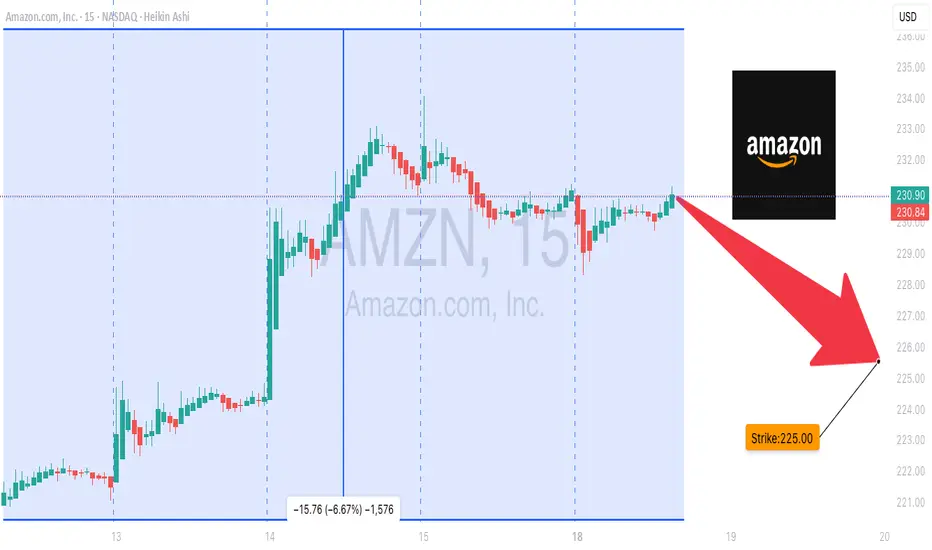
AMZN Losing Momentum? Put Flow on the Table
# 🛒 AMZN Weekly Options Setup (8/18 – 8/22)
📉 **Consensus: Neutral → Cautious Bearish**
* 🔻 RSI trending down (daily + weekly)
* 📉 Weak volume = no strong institutional conviction
* ⚖️ 4/5 AI models → **NO TRADE**
* 🐻 Only **DeepSeek** calls for puts → bearish divergence
---
## 🎯 Trade Setup (Aggressive Play)
* **Instrument**: AMZN
* **Direction**: PUT (SHORT)
* **Strike**: \$225.00
* **Expiry**: 2025-08-22
* **Entry**: \$0.82
* **Profit Target**: \$0.98 (scalp style)
* **Stop Loss**: \$0.50
* **Confidence**: 65% (only because DeepSeek flagged momentum divergence)
* **Timing**: Enter at open → monitor closely (don’t baghold into Friday ⚠️).
---
## 📈 Breakeven @ Expiry
👉 \$224.18 (Strike – Premium)
AMZN must **close < \$224.18 by 8/22** to finish ITM.
But plan = **exit early on IV / momentum pop**, not expiry hold.
---
## 🧠 Key Risks
* Theta burn 🔥 (short expiry puts bleed fast)
* Market news swings (AMZN often reacts to macro headlines)
* Lack of volume → potential for chop instead of follow-through
---
# ⚡ AMZN 225P WEEKLY PLAY ⚡
🎯 In: \$0.82 → Out: \$0.98
🛑 Stop: \$0.50
📅 Exp: 8/22
📈 Bias: Weak, but playing the downside momentum divergence 📉
AMAZON ARE WE HEADING TO $258 ? HERE IS THE FULL ANALYSIS Hi Trading fam
So we have Amazon and based on what we are seeing we see two scenarios playing out:
Bullish:
If we can break and hold above 219 then we can see levels of : 235,241,and 258 being hit
Bearish:
If break the low of 210 then we hit 207,204, 199, 190 and then 185
Trade Smarter Live Better
Kris
