(AMZN) | 1H Chart Long
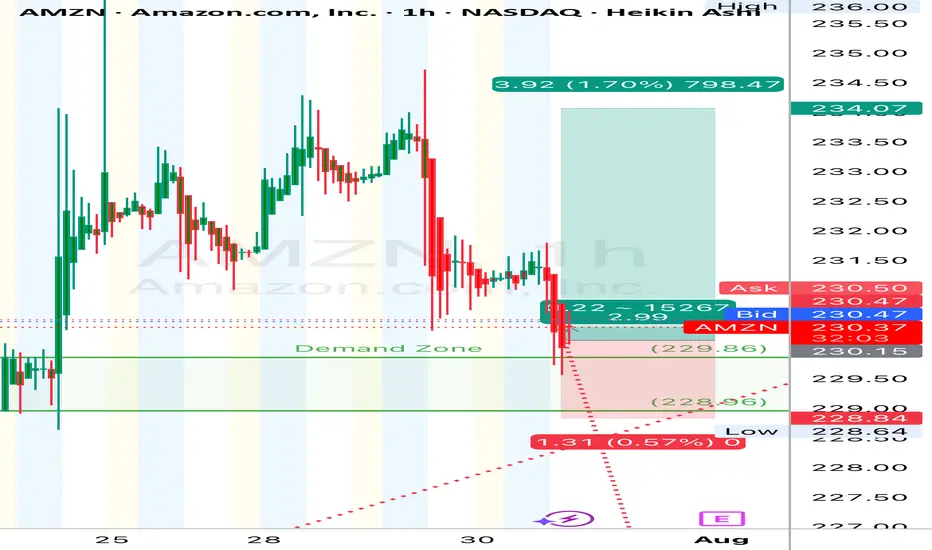
“Buyers defended the zone hard. Tight bull flag breakout setup forming after the demand tap. Looks like this thing wants to take another leg up. Clean R/R if managed tight.”
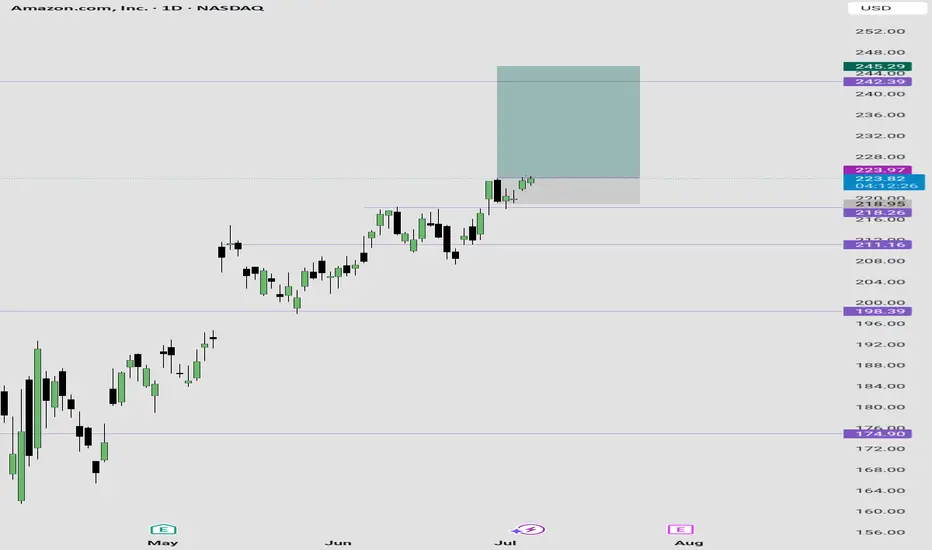
Price surged impulsively from mid-July lows, followed by a shallow correction—suggestive of a micro **Wave 4**.
* Current bounce off demand zone implies the potential start of **Wave (5)** to retest or break highs.
* **Demand Zone:** \$228.00–\$230.00 —
* **Supply Zone:** \$236.00 —234
🎯 **Trade Setup (Long Bias):**
* **Entry:** \$230.20 (current level near demand bounce)
* **Stop Loss:** \$228.80 (below the demand zone)
* **Take Profit :** \$236.00
* **Risk/Reward:** \~**1:3 RR**
*“The goal of a successful trader is to make the best trades. Money is secondary.” – Alexander Elder*
#### ⚠️ **Disclaimer:**
This is for educational purposes only and not financial advice. Trade at your own risk. Always manage your capital responsibly and use proper risk management.
AMZN trade ideas
8/1/25 - AMZN: new SELL mechanical trading signal.8/1/25 - AMZN: new SELL signal chosen by a rules based, mechanical trading system.
AMZN - SELL SHORT
Stop Loss @ 234.11
Entry SELL SHORT @ 214.75
Target Profit @ 181.53
Analysis:
Higher timeframe: Prices have stayed below the upper channel line of the ATR (Average True Range) Keltner Channel and reversed.
Higher timeframe: Victor Sperandeo's (Trader Vic) classic 1-2-3/2B SELL pattern...where the current highest top breakout price is less or only slightly peaking higher than the preceding top price.

I am buying AMAZONI am buying AMAZON
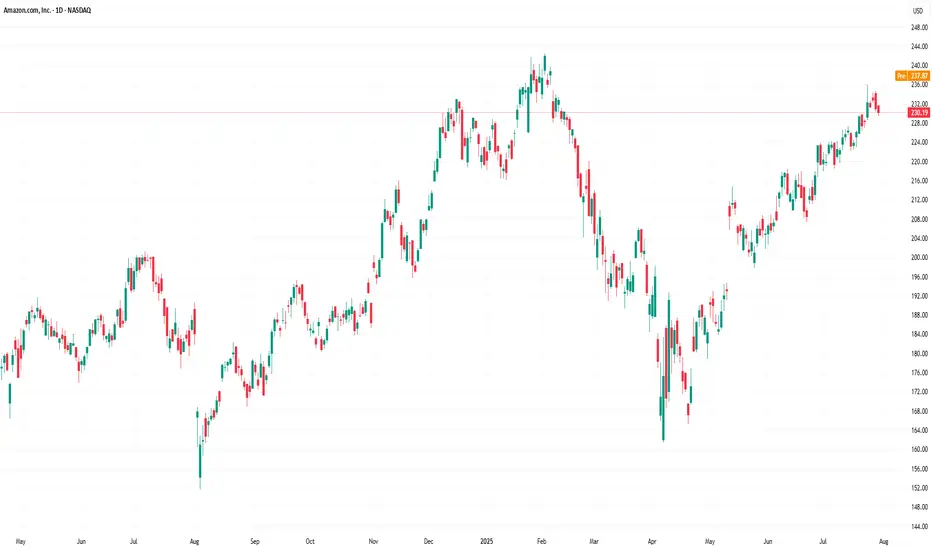
Amazon's stock lost over 10% last week, marking a significant decline within just one week.
I will start buying using dollar cost averaging (DCA) with $240 as my long-term to mid-term target.
I will hold
Please like, share, comment and follow.
I look forward to connecting with you

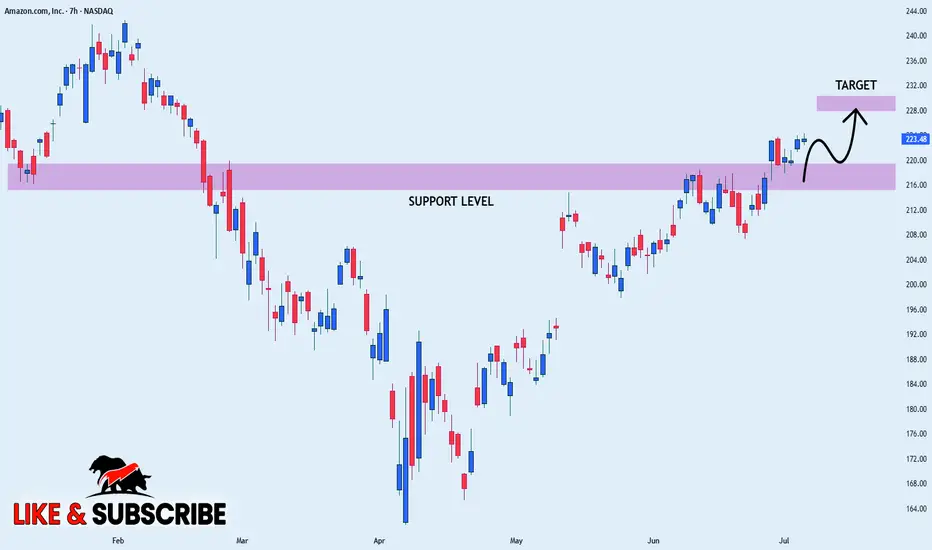
AMZN is ready to lift offPrice has successfully retest support zone around 185$.
Expecting trend continuation, targets are on chart.
NFA
DYOR
AMZN dip buyAMZN was one of the names hit the most after today's/this weekly drop. over 8% fall. no need to check the RSI to see how oversold it is lol. I think the market will see a mag 7 stock drop this large as a buying opportunity which made me look at TA. the 4 hr has a red hammer and has a new higher high on the 15m.

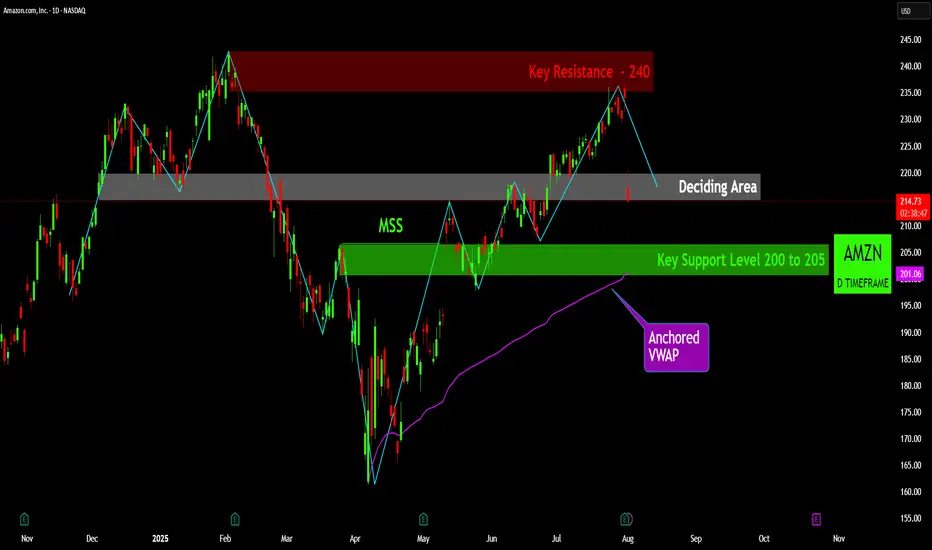
AMZN: The Battle for Direction at a Critical JunctureThe recent price action for Amazon (AMZN) is currently navigating a critical juncture, having pulled back from a significant resistance level and now consolidating within a pivotal "Deciding Area." A detailed review of the key technical levels reveals the following insights:
Key Resistance ($240): A formidable resistance zone is established around the $240 price point. This level represents a major overhead supply area, where prior selling pressure has been strong enough to halt upward price movements on multiple occasions. A decisive breach of this level on strong volume would be a highly bullish development, signaling a potential move to new highs.
Key Support Level ($200 to $205): A robust support zone is identified between $200 and $205. This level has historically served as a strong price floor, absorbing selling pressure and providing a foundation for subsequent rallies. The integrity of the current uptrend is heavily dependent on the price holding above this critical area.
Market Structure Shift (MSS): The formation of a "Market Structure Shift" earlier in the year was a pivotal technical event. This change in market dynamics marked a significant transition, signaling a potential reversal from a prevailing downtrend to the current bullish phase. The subsequent rally from the lows validates this structural change.
Anchored VWAP: The Anchored Volume-Weighted Average Price (VWAP), anchored from the most recent major low, is serving as a dynamic and trend-defining support level. This indicator reflects the average price paid by investors since the start of the current trend. A sustained close below this line would be an early warning sign of weakening momentum.
Deciding Area: The stock is presently trading within a "Deciding Area" situated just below a previous swing high. This zone represents a period of consolidation and indecision as the market digests the recent pullback from resistance. The outcome of this consolidation will likely dictate the short-term directional bias. A break to the upside would suggest a renewed attempt to challenge the $240 resistance, while a breakdown would likely lead to a retest of the primary support level at $200-$205.
Summary of Outlook: The overall technical picture for AMZN indicates that the stock is at a critical inflection point. The health of the underlying uptrend remains intact as long as the price holds above the key support levels and the Anchored VWAP. A definitive move out of the "Deciding Area" will provide the next clear signal for either a renewed push toward resistance or a deeper pullback to test established support.
Disclaimer:
The information provided in this chart is for educational and informational purposes only and should not be considered as investment advice. Trading and investing involve substantial risk and are not suitable for every investor. You should carefully consider your financial situation and consult with a financial advisor before making any investment decisions. The creator of this chart does not guarantee any specific outcome or profit and is not responsible for any losses incurred as a result of using this information. Past performance is not indicative of future results. Use this information at your own risk. This chart has been created for my own improvement in Trading and Investment Analysis. Please do your own analysis before any investments.
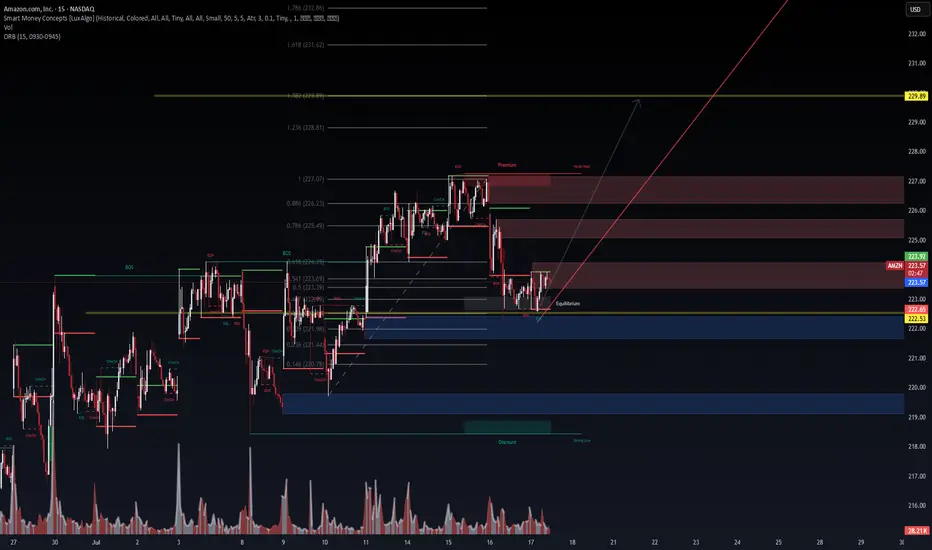
AMZN 15m – Institutional Demand Reclaim in Progress | VolanX Pro📈 AMZN 15m – Institutional Demand Reclaim in Progress | VolanX Protocol Alert
Amazon (AMZN) is staging a potential bullish reversal from a deep discount zone following a strong rejection near the 0.146–0.236 Fibonacci confluence at ~$220.78–221.44. We are now consolidating near the equilibrium zone (223) with signs of early accumulation.
📊 Technical Thesis:
Break of Structure (BOS) at 223.92 sets short-term bullish intent.
Reclaiming the ORB high and equilibrium.
Price rejected from deep demand (blue zone) and now printing EQH + BOS microstructures.
Premium liquidity sits above 227–229, with a magnet at FIB extension 1.618–1.786 = 231.62–232.86.
Volume profile shows declining sell pressure post-demand sweep.
📌 Key Levels:
Support: 222.53 | 221.44 | 220.78 (deep value zone)
Resistance: 226.23 (0.886 FIB) → 229.89 (FIB target zone)
Smart Money Premium: 226.5–229.8
🧠 VolanX Protocol Bias:
This is a long-biased setup, favoring institutional reaccumulation. If AMZN maintains above 223 with volume absorption, we anticipate a liquidity sweep through the premium zone, targeting 229.89.
🎯 Probabilistic Targeting:
60% → Retest 226.23 (EQH magnet zone)
30% → Breakout and reach 229.89 (measured move)
10% → Breakdown below 222.53 invalidates the setup
⚠️ Risk Note (VolanX Standard):
This post reflects strategic technical modeling, not financial advice. Trade your own system. View this as a signal integrity alignment, not a directive.
AMZN – Wedge Complete, Decision Imminent📦 AMZN – Wedge Complete, Decision Imminent
Price action has carved out a clean rising wedge into a known inflection zone. The top of this formation aligns with a macro breakdown level from Q1—likely to attract both breakout chasers and smart sellers.
📍 Key Levels:
Bull Break Target: $242.52
Bear Breakdown Target: $216.20
Decision Point: ~$228
This is a textbook volatility pocket. WaverVanir's DSS signals suggest we're nearing exhaustion. Watch for confirmation before positioning.
⚙️ VolanX Protocol – Predictive AI meets Market Structure.
#AMZN #WaverVanir #VolanX #SmartMoney #TradingView #NASDAQ #WedgePattern

Amazon (AMZN) Shares Rise Ahead of Earnings ReportAmazon (AMZN) Shares Rise Ahead of Earnings Report
Today, 31 July, Amazon is set to release its quarterly earnings after the close of the regular trading session. Available data show that Amazon (AMZN) shares are exhibiting bullish momentum, reflecting positive market expectations:
→ In July, AMZN shares have outperformed the S&P 500 index (US SPX 500 mini on FXOpen);
→ Yesterday, following the end of the regular session, AMZN shares surged by approximately 3% in after-hours trading.
The rise in AMZN comes amid strong earnings reports from other tech giants, such as Microsoft (MSFT) and Meta Platforms (META). For example, MSFT shares rose by more than 8% in post-market trading. Their success has likely fuelled optimism that Amazon’s upcoming report will also impress.
All of this has brought noticeable changes to the technical outlook for the AMZN stock price.
Technical Analysis of the Amazon (AMZN) Chart
Following the release of the previous earnings report, price movements have formed an upward channel, as indicated by the Regression Trend tool. However, in recent days, a series of bearish signals emerged:
→ On Thursday, AMZN broke above the $230 level (marked by an upward arrow), but the session closed well below the highs – a sign of selling pressure;
→ Friday and Monday’s sessions produced candles with small bodies, indicating market indecision;
→ On Tuesday, bears took the lead (marked by a downward arrow), with a relatively long candle closing near the session low.
Thus, the chart gave reason to assume that optimistic sentiments were waning. However, today’s session is likely to open near the $237.30 level, effectively negating the bearish interpretation of the previous five candles and shifting momentum back in favour of the bulls.
In this context:
→ Support could be provided by the $230 level as well as the median of the Regression Trend channel;
→ Key resistance could be found at the previous high of $242.23 and the psychological level of $250.
Whether AMZN can surge to a new all-time high will largely depend on the company’s performance in AI – a theme that remains highly relevant in 2025.
This article represents the opinion of the Companies operating under the FXOpen brand only. It is not to be construed as an offer, solicitation, or recommendation with respect to products and services provided by the Companies operating under the FXOpen brand, nor is it to be considered financial advice.
AMZN Earnings Play — July 30 (AMC)
## 🚀 AMZN Earnings Play — July 30 (AMC)
**💵 High Conviction Call Trade | 85% Confidence**
📈 **Amazon (AMZN)** — Cloud + Consumer Power Combo
🧠 Setup driven by earnings momentum, bullish flow, and macro strength.
---
### 🔍 FUNDAMENTALS SNAPSHOT
✅ **Revenue Growth**: +8.6% TTM
✅ **Margins**: Profit 10.1%, Op 11.8%, Gross 49.2%
🎯 **EPS Beat Streak**: 8/8 with avg. surprise of +34.7%
🔮 **Consensus Target**: \$252.03 (+9.4% upside)
📌 AWS + AI + Cost control = 🔥 upside setup
🟢 **Score: 9/10**
---
### 📊 OPTIONS FLOW SIGNAL
💰 **High OI**: \$232.50, \$240, \$247.50 calls
📈 **Call/Put Ratio**: Bullish Skew
🛡️ **Put Hedging** ≠ Bearishness
📉 Expected Move: \~5%
⚖️ **Gamma Bias**: Bullish above \$240
🟢 **Score: 8/10**
---
### 📉 TECHNICAL SETUP
📍 Price: \$231.01
📈 20D MA: \$226.21 (Support)
📉 RSI: 66.71 (momentum building)
🔒 Resistance: \$242.52 (watch for breakout)
🟢 **Score: 8/10**
---
### 🌐 MACRO TAILWINDS
🧠 AI & Cloud Momentum 🚀
💹 Consumer spending rebound
🔧 Regulatory risk mitigated via diversification
🟢 **Score: 8/10**
---
## 🎯 TRADE IDEA
🟩 **AMZN 08/01 \$247.50 Call**
💸 Entry: \$0.86
🎯 Target: \$2.58 (200%)
🛑 Stop: \$0.43 (50% loss)
⏰ Entry: **July 30 — Pre-close**
📏 Max Risk: \$86
💰 Max Reward: \$258
🧠 IV Crush Defense: Exit 2H post-ER
---
## ⚡️ WHY THIS WORKS
✅ 8-straight beat streak
✅ Fundamentals + Technicals = aligned
✅ Flow + Macro confirm direction
📈 Setup = asymmetrical upside
---
🎯 Tag your earnings sniper crew
📈 #AMZN #EarningsTrade #OptionsFlow #AmazonStock #CloudAI #OptionsStrategy #EarningsPlays #TradingView #SwingTrade #CallOptions #VolatilityTrade #EarningsMomentum

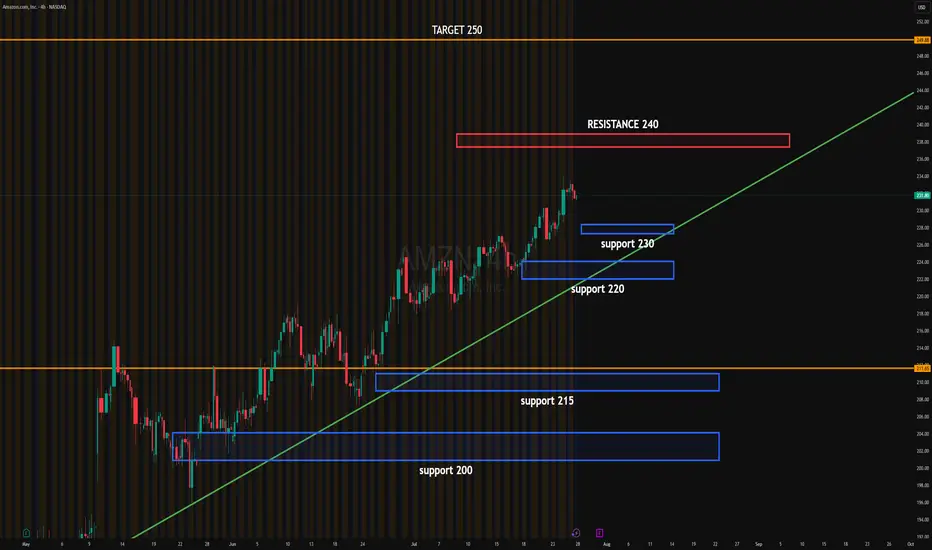
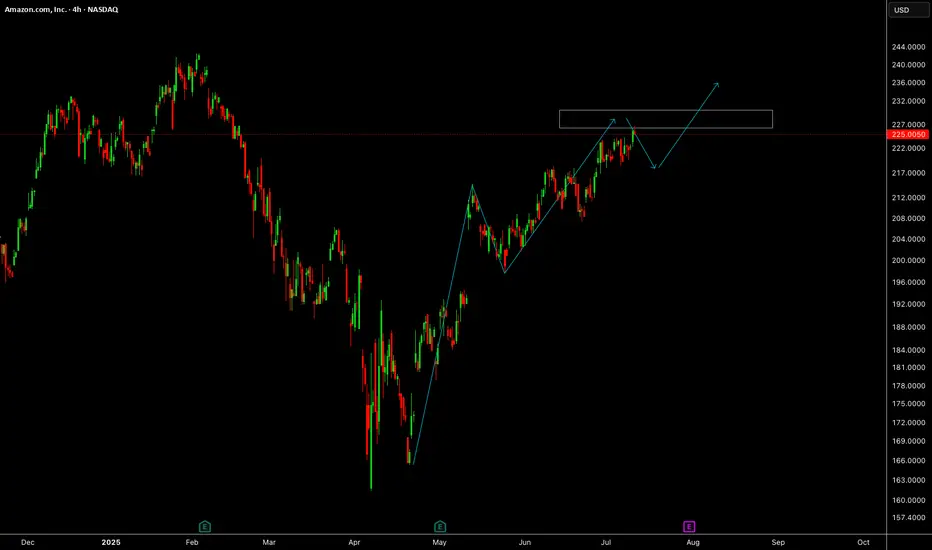
AMZN EARNINGSAMZN price action update:
Price is consolidating below the 240 resistance after a steady climb. Buyers are defending the 230 level, showing signs of absorption just above the ascending trendline.
The 233.50 breakout level could trigger momentum towards the 240 resistance. If breached, institutional targets extend toward 250.
Current consolidation suggests the Market Maker is trapping liquidity below 230 while buying time for a directional move.
Upside target: 250
Downside target: 220 if 230 fails
#AMZN #globaltrade #investment #investing #stockmarket #wealth #realestate #markets #economy #finance #money #forex #trading #price #business #currency #blockchain #crypto #cryptocurrency #airdrop #btc #ethereum #ico #altcoin #cryptonews #Bitcoin #ipo
Real Sellers Vs Passive Sellers AMZNHello I am the Cafe Trader.
I was fortunate enough to get an editors pick, and I wanted to expound on how I came to those conclusions.
In this video we talk about passive sellers vs aggressive sellers and how we identify them. Also why it's important to identify these players in the market. This will help give you depth and help you get really good pricing in the markets.
Hope you enjoy the voiceover, Feel free to take a look at the previous article that this was pulled from on my profile.
Please share a boost if you enojoyed, and consider following for more.
Until next time! Happy Trading!!
@thecafetrader

AMZN HEADING INTO AUG 25'SHORT AMAZON
Amazon is current going to retest all time highs.
I want amazon again for a buy in the $209-218 range.
I don't think see Amazon below $208 again.
Going to fail on retest of ATH right now and cool off, bring rsi down back to 50-60 Zone, before consolidating for a break of the all time highs to close out the year.
Amazon always shines in Q4 with Holidays, so expect a great close to the year, but it's an overbought stock right now. (isn't it always??...lol)

Amazon Has a Mixed Technical Picture Heading Into EarningsNext week will see four of the "Magnificent Seven" stocks report quarterly earnings -- Apple NASDAQ:AAPL , Amazon NASDAQ:AMZN , Microsoft NASDAQ:MSFT and Meta Platforms NASDAQ:META . Let's check out AMZN ahead of its results.
Amazon's Fundamental Analysis
FactSet recently reported analysts' consensus view calls for S&P 500 companies to see 9.3% earnings growth for 2025 as a whole, of 9.3%, up from 9% in 2024.
But very interestingly, FactSet also said that earnings growth across the "Magnificent Seven" is projected at 14.1% year over year for just Q2 alone.
By contrast, analysts project just 3.4% y/y earnings gains for the S&P 500's other "Less Than Magnificent 493." That illustrates the Mag-7's impact on the broader market.
As for Amazon, analysts estimate that the e-commerce giant will see $1.32 in Q2 GAAP earnings per share on roughly $162 billion of revenue.
This would represent 4.8% y/y growth from Q2 2024's $1.26 in GAAP EPS, as well as a 9.5% y/y gain from the approximately $148 billion in revenues that AMZN saw in the same period last year.
This has become the norm for Amazon, as revenue growth has landed between 9% and 11% for each of the past four quarters (and is projected to print within that range for the next four quarters as well).
But significantly, of the 34 sell-side analysts that I can find that track AMZN, 27 have reduced their Q2 earnings estimates for the firm since the current quarter began. (The other seven swam upstream and actually boosted their forecasts.)
Amazon's Technical Analysis
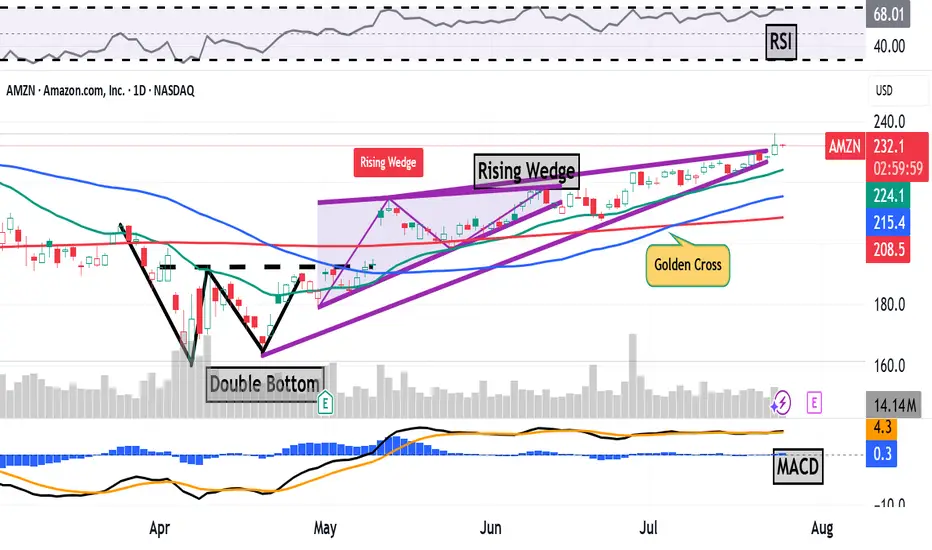
Next, let's look at AMZN's chart going back some six months and running through Tuesday afternoon:
This is an interesting chart, with both positive and negative technical signals.
On the positive side, the stock saw a "double-bottom" pattern of bullish reversal that spanned the month of April, with a $193 pivot (marked "Double Bottom" at the above chart's left).
That produced an upside breakout that appeared to accelerate, with a "golden cross" occurring on July 7 (marked at the chart's right).
A golden cross is generally seen as a bullish technical pattern that occurs when a stock's 50-day Simple Moving Average (or "SMA," denoted with a blue line in the chart) crosses above a rising 200-day SMA (the red line).
There's a catch, though.
While breaking out higher in the chart above, AMZN appeared to develop a "rising-wedge" pattern of bearish reversal, marked with purple diagonal lines in the chart above.
Readers will note that this pattern actually began at the nadir of the double bottom's second bottom in late April. The rising wedge's upper trendline then kicked in on May 13, but the pattern's two lines appear to be closing.
When a wedge closes after two to three touches on each trendline (which we have here), the resultant move can be explosive.
However, it's not necessarily clear which way a stock will move from there -- up or down. A true closing pennant can explode violently in either direction, but as noted above, what we're seeing with Amazon is a pattern of bearish reversal.
This does give me pause about AMZN and makes me more cautious than I might otherwise be about getting involved with the stock ahead of earnings. (I don't currently own any AMZN shares.)
Meanwhile, Amazon's Relative Strength Index (the gray line at the chart's top) looks strong, but nowhere near being technically overbought.
That said, the stock's daily Moving Average Convergence Divergence indicator (or "MACD," marked with black and gold lines and blue bars at the chart's bottom) isn't telling us much at all.
The histogram of Amazon's 9-day Exponential Moving Average (or "EMA," marked with blue bars) is flat-lining right around the zero bound, while the 12-day EMA (black line) is running in line with the 26-day EMA (gold line).
While both lines are running above zero, it matters greatly which one ends up on top. For the short to medium term, the bulls will be rooting for the black line, while the bears will be hoping that the gold line can wind up on top.
(Moomoo Technologies Inc. Markets Commentator Stephen “Sarge” Guilfoyle had no position in AMZN at the time of writing this column.)
This article discusses technical analysis, other approaches, including fundamental analysis, may offer very different views. The examples provided are for illustrative purposes only and are not intended to be reflective of the results you can expect to achieve. Specific security charts used are for illustrative purposes only and are not a recommendation, offer to sell, or a solicitation of an offer to buy any security. Past investment performance does not indicate or guarantee future success. Returns will vary, and all investments carry risks, including loss of principal. This content is also not a research report and is not intended to serve as the basis for any investment decision. The information contained in this article does not purport to be a complete description of the securities, markets, or developments referred to in this material. Moomoo and its affiliates make no representation or warranty as to the article's adequacy, completeness, accuracy or timeliness for any particular purpose of the above content. Furthermore, there is no guarantee that any statements, estimates, price targets, opinions or forecasts provided herein will prove to be correct.
Moomoo is a financial information and trading app offered by Moomoo Technologies Inc. In the U.S., investment products and services on Moomoo are offered by Moomoo Financial Inc., Member FINRA/SIPC.
TradingView is an independent third party not affiliated with Moomoo Financial Inc., Moomoo Technologies Inc., or its affiliates. Moomoo Financial Inc. and its affiliates do not endorse, represent or warrant the completeness and accuracy of the data and information available on the TradingView platform and are not responsible for any services provided by the third-party platform.
AMZN: Daily Trend Change with Bullish Continuation Setup
🗓 Published: June 26, 2025
📍 Ticker: NASDAQ:AMZN – Amazon.com Inc.
🕒 Timeframes: Daily & 4H
📊 Technical Bias: Bullish
📈 Trend: Higher Highs & Higher Lows
🧠 Analysis Summary
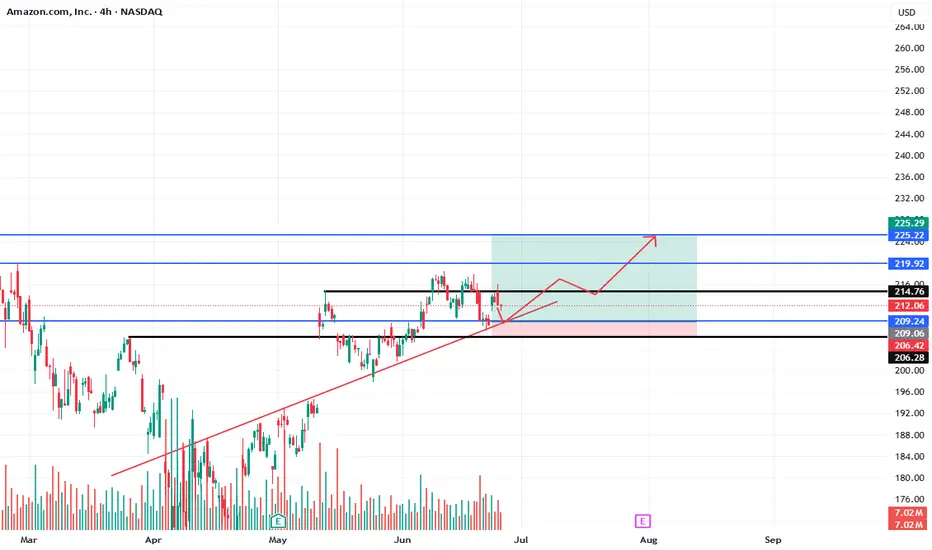
Amazon has successfully reclaimed a bullish market structure on the daily chart by forming higher highs and higher lows since late April. Price is now retesting a key support zone around $209–$212, which aligns with both horizontal support and the rising trendline.
On the 4H chart, the price is stabilizing near the trendline support, offering a high-probability long entry setup if the current structure holds.
📍 Key Levels
Price Level Description
206.28–206.42 Key support zone (invalidation area)
209.06 Local demand area
212.06 Retest level, potential entry
214.76 Local high / minor resistance
219.92 Intermediate target zone
225.22–225.29 Main bullish target / resistance
✅ Trade Setup
Entry Zone:
🔵 Long between $209.00 – $212.00 on confirmation of support
Take Profit Targets:
TP1: $214.76
TP2: $219.92
TP3: $225.22–225.29
Stop Loss:
🔴 Below $206.00 (break of structure + trendline invalidation)
Risk:Reward Potential: ~1:2.5
🔍 Confluence Factors
Daily trendline acting as dynamic support
Demand zone overlap at $209
Volume spike near base, suggesting buyer interest
Higher low formation + potential breakout of local range
⚠️ Risk Note
Only valid if price holds the $209–$212 demand area. If $206.00 is broken with strong bearish candles, the long setup is invalidated and a reassessment is required.
💬 Do you think AMZN will reclaim $225 by earnings? Let me know your outlook!
🚀 Stay patient, follow price structure, and manage your risk properly.
Rendon1
Amazon Wave Analysis – 21 July 2025
- Amazon broke resistance zone
- Likely to rise to resistance 240.00
Amazon recently broke the resistance zone between the resistance level 227.30 (top of the previous impulse wave i) and the resistance trendline of the daily Rising Wedge from May.
The breakout of this resistance zone accelerated the active impulse wave 5 of the intermediate impulse sequence (C) from April.
Given the strength of the active impulse wave 5, Amazon can be expected to rise further to the next resistance level 240.00 (former multi-month high from February and the target price for the completion of the active impulse wave iii).

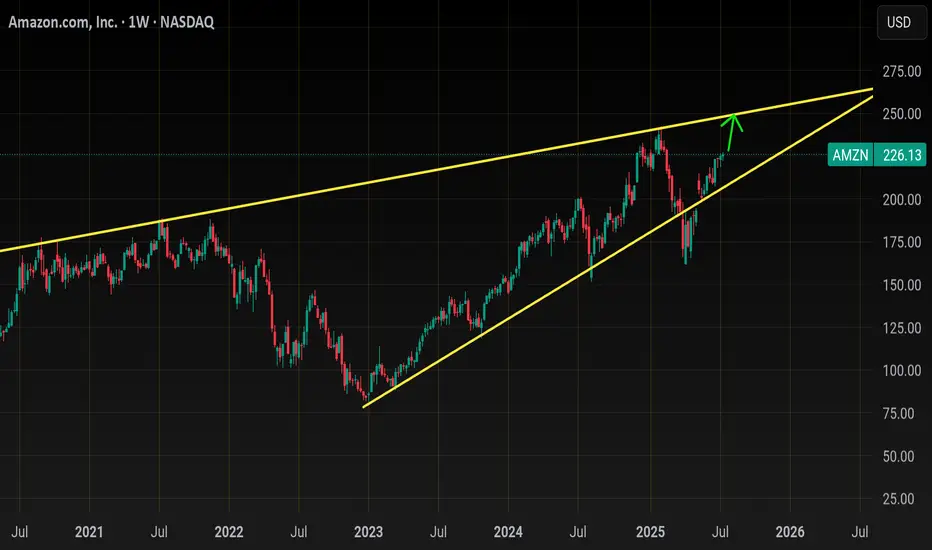
AmznLooks like 250 is incoming on this stock
V-shape recovery happening in real time
Don't put too much Emphasison this rising wedge in terms of bearishness.. just use it as a range to trade... Will most likely trade inside of it until a catalyst comes to push it to breakout to the upside
Looking for 230 this week
I like any Dips down to 222. Range will be tight so keep that in mind if you are swinging short dated
AMZN Short1.Liquidity Landscape
Buy-Side Liquidity Cleared:
Liquidity above the recent swing high was taken — likely triggering breakout traders and stop orders from earlier shorts.
This move appears to be a classic liquidity raid before a reversal.
Sell-Side Liquidity in Focus:
Price is now targeting sell-side liquidity resting below recent higher lows (e.g., below ~222 and especially near 218.50).
This aligns with the direction of your arrow, suggesting price may hunt liquidity pools beneath internal lows.
2. Confirmation via Reaction
The strong rejection from that supply zone confirms no intent to hold price above 227, meaning that was likely a liquidity raid, not a genuine breakout.
Price has already broken below the midpoint (0.5 level at 222.85), adding confidence to the short bias.
3. Liquidity Targets Below
The next likely targets are sell-side liquidity pools resting below:
Around 218.50 (marked zone)
Deeper lows near 211–212, and potentially 208–209, where untouched demand and previous stop clusters lie.

AmazonAmazon needs small correction and further push up towards 235 level.
Disclosure: We are part of Trade Nation's Influencer program and receive a monthly fee for using their TradingView charts in our analysis.
AMZN Ending DiagonalFrom an Elliott Wave point of view, we could be near a downside correction (wave C).
The rise from late May doesn´t have the same momentum, and looks like an ending diagonal.
A break from the bottom of the ascending wedge would indicate wave C is in progress

AMAZON STRONG UPTREND|LONG|
✅AMAZON is going up
Now and the stock made a bullish
Breakout of the key horizontal
Level of 220$ and the breakout
Is confirmed so we are bullish
Biased and we will be expecting
A further bullish move up
LONG🚀
✅Like and subscribe to never miss a new idea!✅
Disclosure: I am part of Trade Nation's Influencer program and receive a monthly fee for using their TradingView charts in my analysis.
Amazon I Strong Bullish Outlook Welcome back! Let me know your thoughts in the comments!
** Amazon Analysis - Listen to video!
We recommend that you keep this pair on your watchlist and enter when the entry criteria of your strategy is met.
Please support this idea with a LIKE and COMMENT if you find it useful and Click "Follow" on our profile if you'd like these trade ideas delivered straight to your email in the future.
Thanks for your continued support!Welcome back! Let me know your thoughts in the comments!

Amazon Long IdeaBuying Amazon shares here...
Reason:
Bouncing off support with good bullish price action candles.
I expect the price to reach $245 per shares between now and next week Friday....
My stop loss price is on the chart.