AMZN Heating Up – GEX Shows There's Room to Run!
Alright, guys – here's the scoop on Amazon (AMZN) right now based on the latest GEX map and price action.
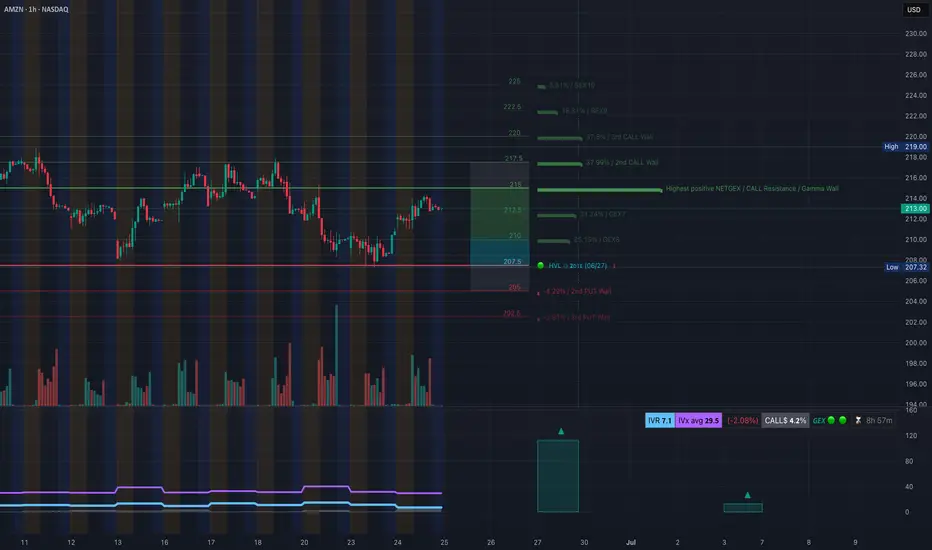
🧠 GEX Setup:
We’re seeing solid call gamma buildup from 213 → 220, and a strong positive NET GEX wall near 215–217. That tells us market makers might start pushing price toward those high-gamma
0.040 USD
52.62 B USD
566.64 B USD
About Amazon.com
Sector
Industry
CEO
Andrew R. Jassy
Website
Headquarters
Seattle
Founded
1994
ISIN
ARBCOM460176
Amazon.com, Inc. is a multinational technology company, which engages in the provision of online retail shopping services. It operates through the following segments: North America, International, and Amazon Web Services (AWS). The North America segment offers retail sale of consumer products, including from sellers, advertising, and subscriptions services through North America-focused online and physical stores. The International segment focuses on retail sale of consumer products, including from sellers, advertising, and subscription services through internationally-focused online stores. The AWS segment is composed of global sales of compute, storage, database, and other services for start-ups, enterprises, government agencies, and academic institutions. The company was founded by Jeffrey P. Bezos in July 1994 and is headquartered in Seattle, WA.
Related stocks
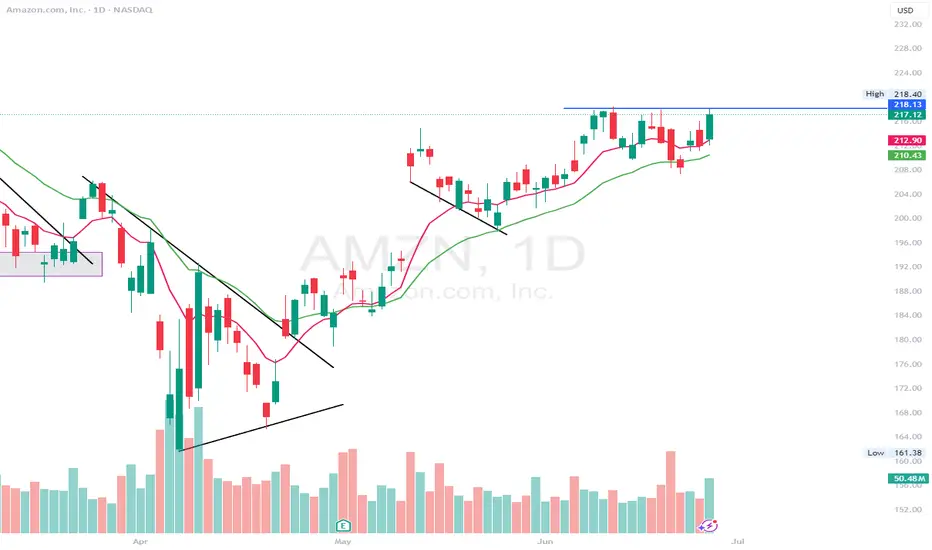
AMZN: Daily Trend Change with Bullish Continuation Setup
🗓 Published: June 26, 2025
📍 Ticker: NASDAQ:AMZN – Amazon.com Inc.
🕒 Timeframes: Daily & 4H
📊 Technical Bias: Bullish
📈 Trend: Higher Highs & Higher Lows
🧠 Analysis Summary
Amazon has successfully reclaimed a bullish market structure on the daily chart by forming higher highs and higher lows sin
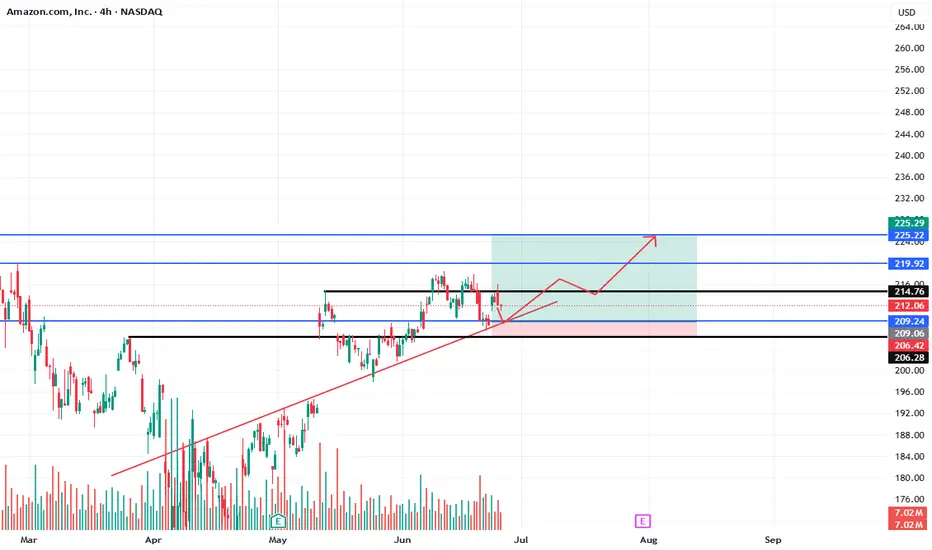
AMAZONAMZN needs some more upside before a pullback.
Disclosure: We are part of Trade Nation's Influencer program and receive a monthly fee for using their TradingView charts in our analysis.
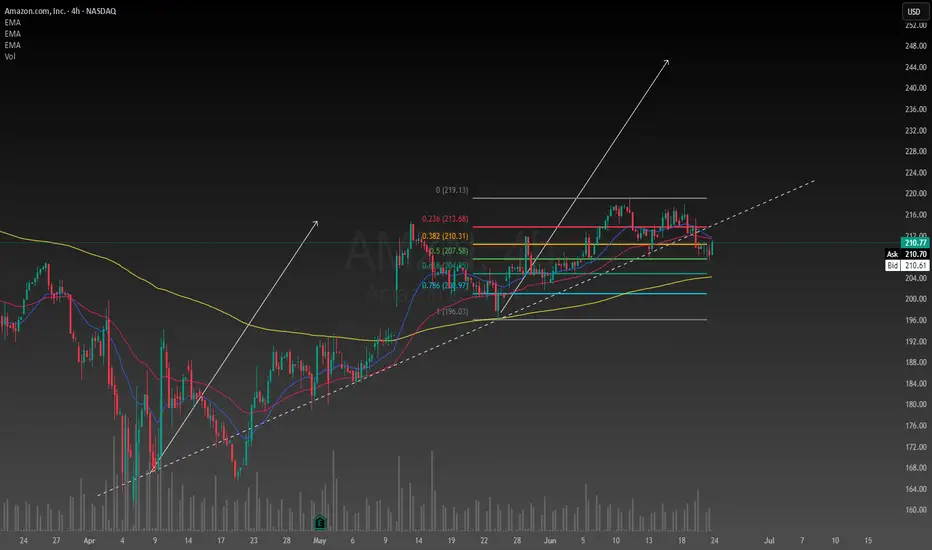
Amazon swing trade ideaAmazon has fallen below its trendline and started to dip slightly despite the fact that the broad market is going higher. I have found an opportunity for a decent long entry and have ran the numbers, the intrinsic value of Amazon right now is between $180 and $520. Not only is it a retail giant but
Amazon “All-In” on UK InvestmentIon Jauregui – Analyst at ActivTrades
Amazon announced on Tuesday an ambitious £40 billion investment in the United Kingdom over the next three years. The goal: to boost technological innovation, expand its logistics network, and strengthen the infrastructure needed for artificial intelligence deve
$AMZN - $2128.20 break for move higher. Multiple catalystAMZN - Stock rejecting daily highs at $218.20 and rejecting it trice. Long and swing calls added in the group. July has been a good month for the stock. Prime day coming in the next 2 weeks. looking for more calls above $220 for a move towards $240 and higher
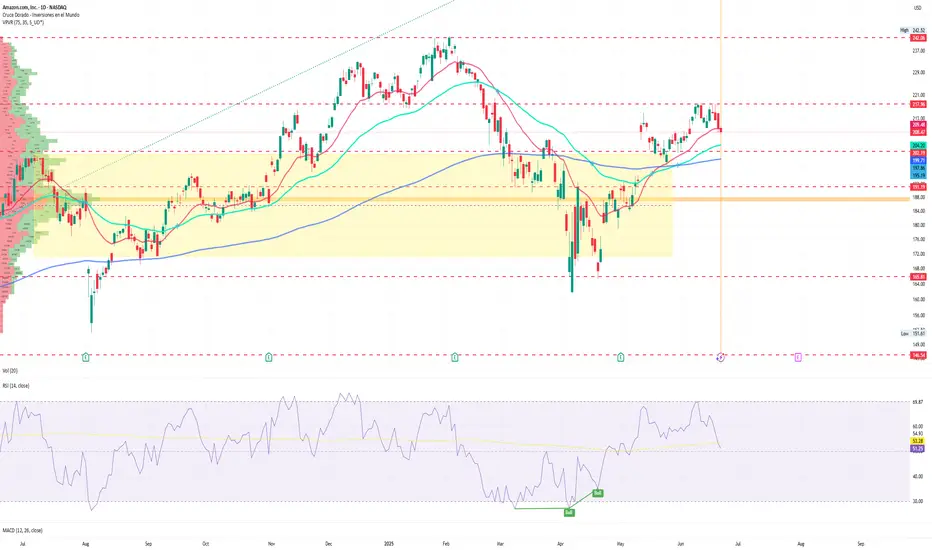
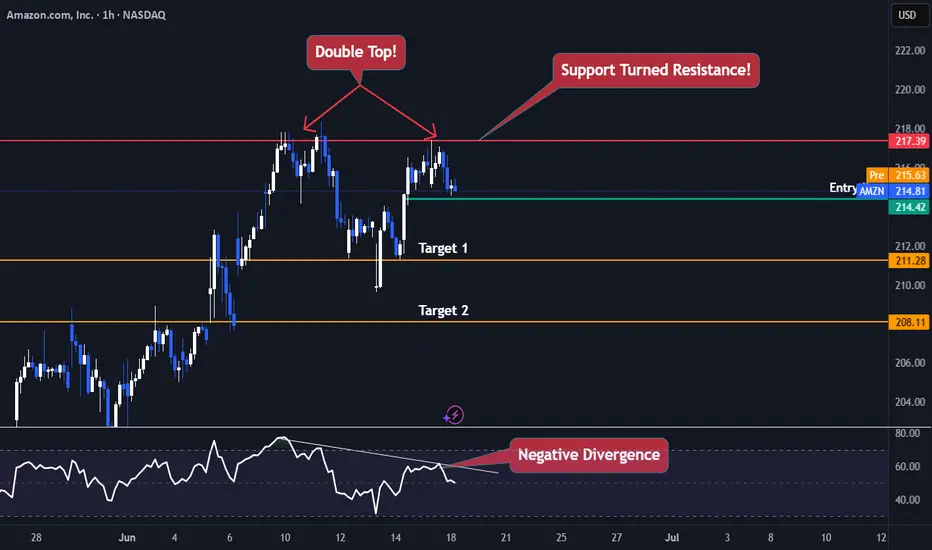
AMAZON TROUBLENASDAQ:AMZN Is currently trading Just 11% below its all time high and currently Facing exhaustion.
Amazon is currently trading 217$ range which was previous support now turned resistance (Daily Timeframe) , making a double top pattern and a negative divergence on the RSI.
The best Trades are th
Amazon getting ready for another leg downAmazon is now in consolidation mode right below the 200MA which also happens to line up with a previous area of resistance. As long as it continues to consolidate below the 200MA, look for another leg down. If it breaks above the 200MA and closes an entire candle above then that would cancel the bea

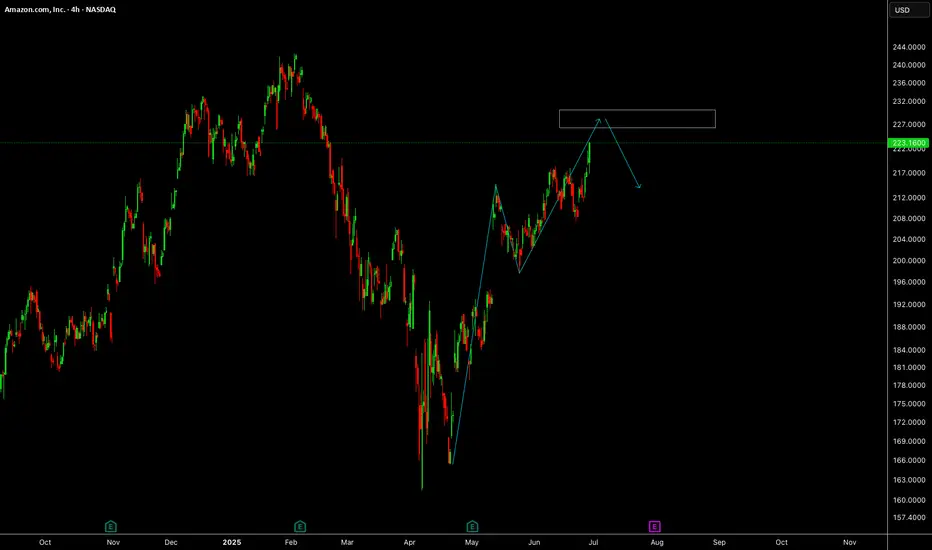
Amazon: Continuing to RiseWith Amazon’s recent climb, prices are edging closer to the top of wave (1) in magenta. However, there is still a bit of upside potential in the short term before wave (2) makes its corrective move. Our primary scenario does not anticipate a new low below $160.50. Instead, we expect wave (3) in mage

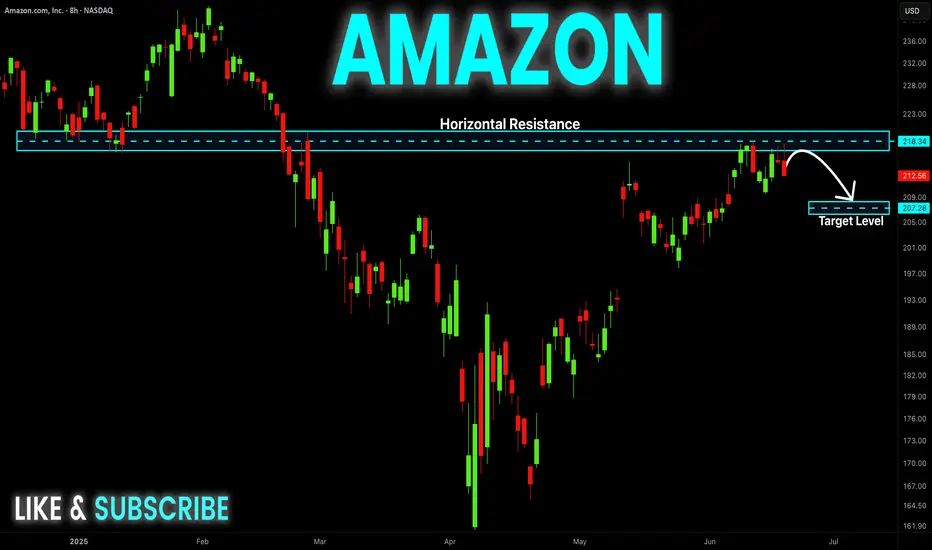
AMAZON Local Short! Sell!
Hello,Traders!
AMAZON made a retest
Of the horizontal resistance
Around 219$ and the stock
Is already making a local
Bearish pullback so a further
Bearish correction
Is to be expected
Sell!
Comment and subscribe to help us grow!
Check out other forecasts below too!
Disclosure: I am part
See all ideas
Summarizing what the indicators are suggesting.
Oscillators
Neutral
SellBuy
Strong sellStrong buy
Strong sellSellNeutralBuyStrong buy
Oscillators
Neutral
SellBuy
Strong sellStrong buy
Strong sellSellNeutralBuyStrong buy
Summary
Neutral
SellBuy
Strong sellStrong buy
Strong sellSellNeutralBuyStrong buy
Summary
Neutral
SellBuy
Strong sellStrong buy
Strong sellSellNeutralBuyStrong buy
Summary
Neutral
SellBuy
Strong sellStrong buy
Strong sellSellNeutralBuyStrong buy
Moving Averages
Neutral
SellBuy
Strong sellStrong buy
Strong sellSellNeutralBuyStrong buy
Moving Averages
Neutral
SellBuy
Strong sellStrong buy
Strong sellSellNeutralBuyStrong buy
Displays a symbol's price movements over previous years to identify recurring trends.
Curated watchlists where AMZNC is featured.