CAT: 5 Impulse & 3 Corrective Waves Flash Sell Signal, Part 1CAT has flashed a sell signal. A five wave (with three corrective waves) harmonic pattern has been completed. Not shown on this chart is the recent strength in DXY. A stronger US Dollar hurts CAT via currency exchange rates. Besides the harmonic pattern evidence, what does the TRADE-MAP analysis suggest?
Here are the letters and what "TRADE-MAP" means to me (first the letters in TRADE):
1. T : Time and space (Fractals); 2. R : Repeating Cycles; 3. A : Advancing Trend; 4. D : Declining Trend; 5. E : Energy in Phase Forces.
Now the letters in MAP:
6. M : Momentum and Velocity; 7. A : Analysis of Structure; 8. P : Price Performance. There you have it: Don's personal "TRADE-MAP.
"Don's Top Ten Technicals": 1. The Ichimoku Cloud is lower than in October, 2015. 2. Prices are falling into the cloud. 3. Prices are falling BELOW the thick red Ichimoku Cloud Conversion line. 4. The thick red conversion line is moving LOWER. 5. The thick black line is the Ki jun-Sen baseline of the Ichimoku Cloud and this is HEADING DOWN. 6. The indicator on the top of the page is RSI / Stochastic , and this is FAILING.. 7. The top-side middle indicator is vortex and this is NEGATIVE (red over green). 8. The Top (bar-type) indicator measures the "phase energy", and this HAS JUST STARTED A ZERO-LINE CROSS-OVER TO THE DOWN SIDE. This suggests the selling has just begun and has more to go. 9. The red fractal arrows (not pictured) are DOWN. 10. Look to the far middle right on the chart, around $72.79. You will notice a yellowish line on the bottom (jaws), with black dots above (teeth), and a blue line (jaw) still below the black dots (but starting to cross). Now, all three are BEGINNING TO CROSS AND OPEN, correct? This is where I ask you to use your imagination and envision these three items as the "jaws, lips, and teeth of a NOW AWAKENING, FEEDING alligator, and the alligator will feed into the DOWN-TREND.
Another huge negative - the recent corrective waves (a-b-c) have BROKEN THE UP TREND REGRESSION LINE (large red arrow).
The combination of all of these technical and harmonic patterns suggest a decline in CAT price.
This is part one of two in this series. Please view part two, a slightly different harmonic pattern for CAT - but every bit as negative.
I hope this article has been helpful, entertaining, and informative. May all of your trades go well. Don.
CATD trade ideas


CATERPILLARLet's analyze Caterpillar:
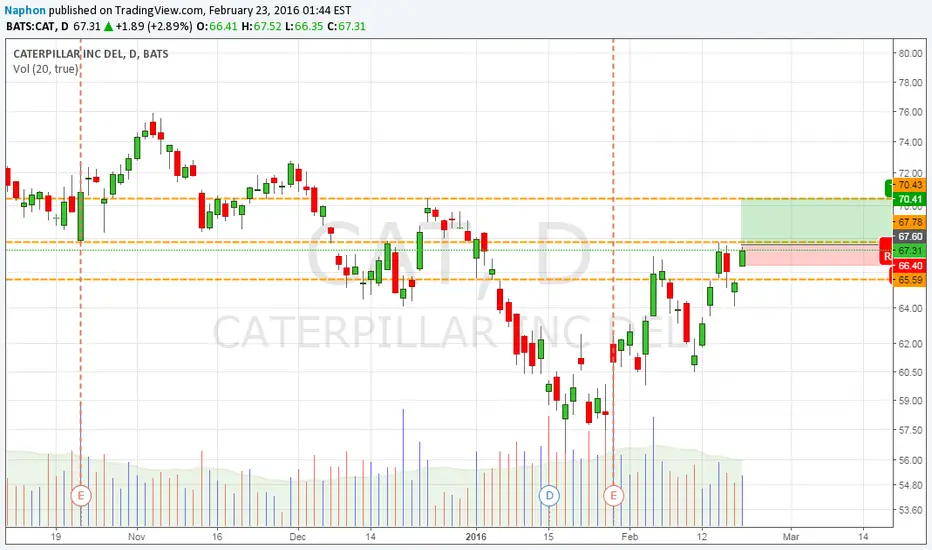
1. The last candle is a Dojy on an imprtant resistance line
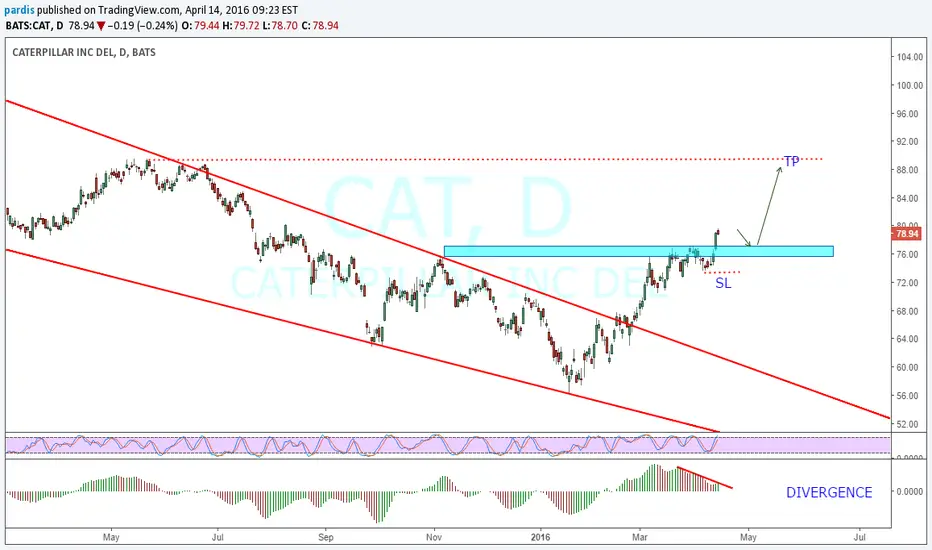
2. The RSI has made a new high, while price has not
3. The last impulse came after a RSI divergence
The conclusión is: SHORT Caterpillar with Stop Loss above $80.65

CatCat went shooter on the week and hammer, let’s just include United Rentals $URI same thing kinda. I like Caterpillar because it has dividends can Caterpillar pull this off?
Simple Trading Techniques – Pullback Candlestick Strategy
Go long the CAT if it trades at 75.62 or higher. If triggered, place your stop at 73.69 and exit the position for a profit at 77.44 or at your own discretion. (Signals are valid for 1 day only. Always invest wisely).
Learn the rules of this strategy at: www.udemy.com

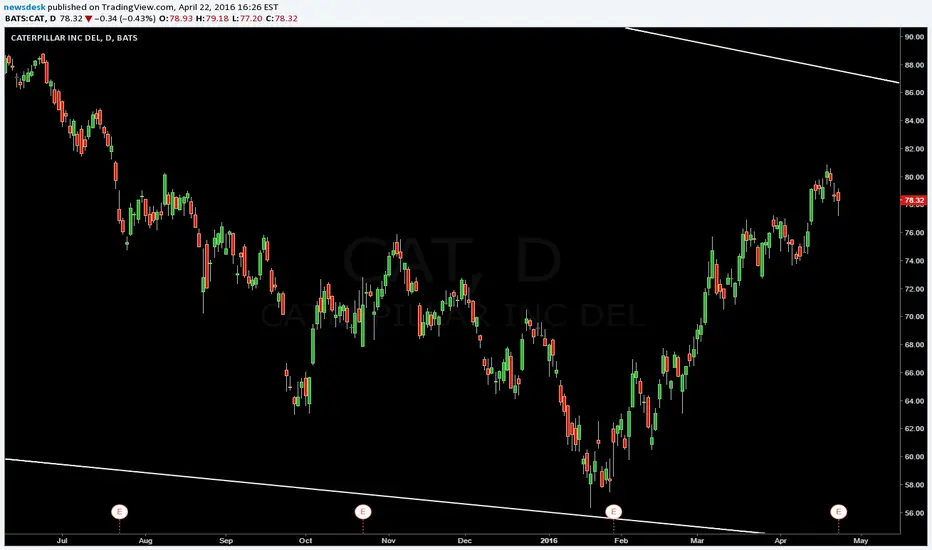
changing trend....bullish trendtrend has changed ....descending trend line is broken and my suggestion is entry to uptrend
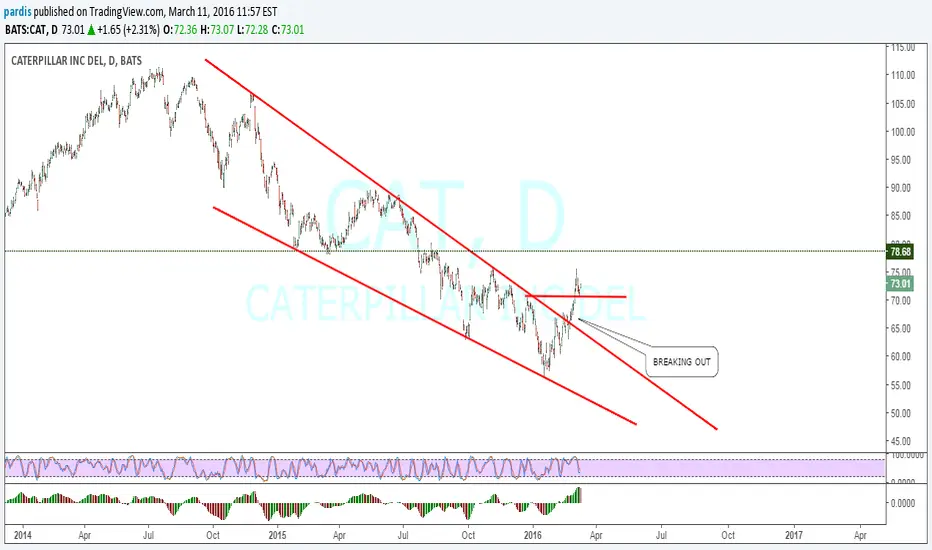
CAT - Industrial Sector is over heated. Here is a stock from the sector to watch out for. Also Keep an eye on CMI.
CAT going up to previous supportI think CAT can make it back up to previous structure support within the next 2-3 months.

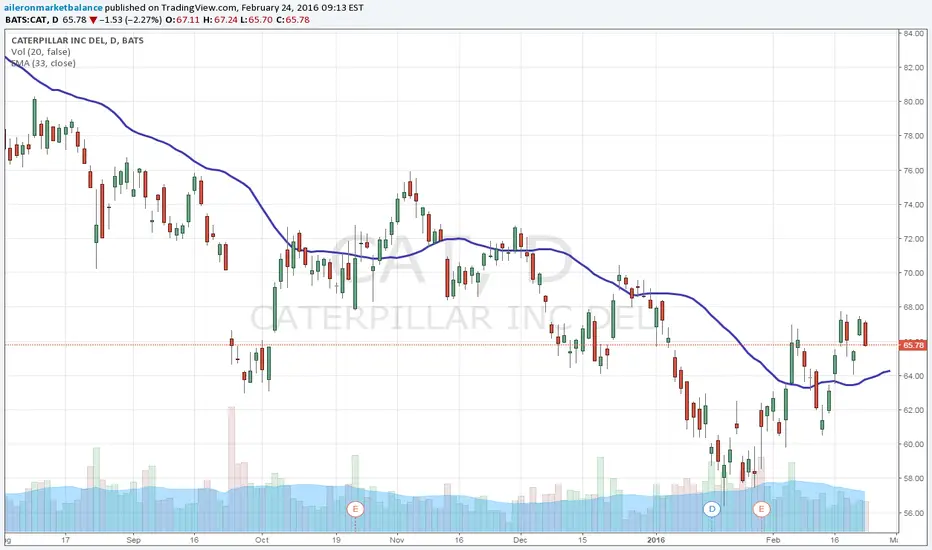
Dogs of the DOW - One Year EntranceThe current Dogs are: CVX, CAT, VX, PFE, CSCO, IBM, BA, MRK, INTC, XOM. CVX is waiting. CAT IS A BUY. Take a look at each one of those names on a DAILY CHART. Set only ONE Exponential moving average on the chart. Just one. Nothing else. A 33 Exponential Moving Average, offset by 3. As soon as you get a Daily Close of any of those stocks, above that 33 Exponential moving average, buy the stock, and hold it for the year, up to February 24th, 2017. That's it, that's the entire strategy

CAT show Head and Shoulder patternCAT show Head and Shoulder pattern.
Price should be decline equal to the price from head to neck line.
Wish can hit the target na ka :)
Harmonic analysis - Caterpillar probably on its way to 55$I always find it amazing how the media starts talking about crisis when it almost over.
Although $CAT is still far from the important buy zone I'll mentioned below, $CAT had to lose almost half of its value for this guy to start paying attention: www.cnbc.com (Jim Cramer realizing the $CAT is in trouble).
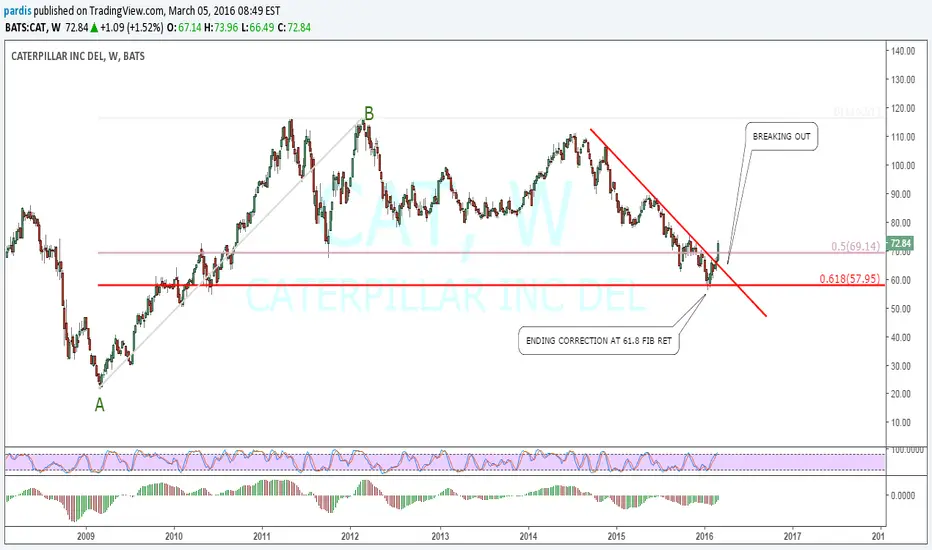
In fact, the bearish opportunity on $CAT was about a year ago as $CAT created weekly triple top with bearish harmonics - on Sep 20th (2014!) I posted a bearish setup for $CAT with the bearish weekly Bat that completed near 112$ (see the setup posted a year ago - goo.gl)
The final target zone of this bearish setup was the strong structure zone near 80$ - 30$ decline from its peak.
When $CAT broke below 75$, the bottom of the weekly structure zone, it actually created a very strong bearish signal that suggests that $CAT will not create higher highs any time soon.
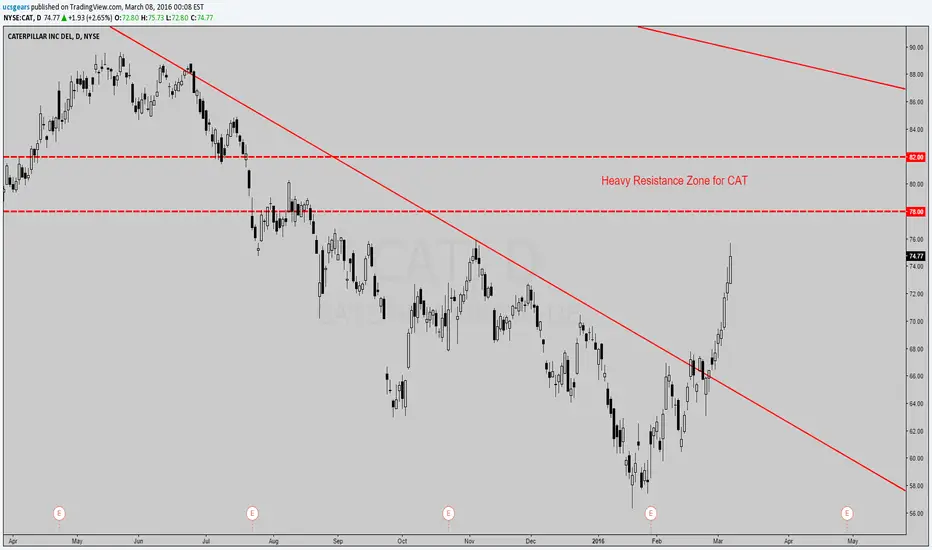
80$ Became a major resistance zone right now (weekly zone) that should prevent $CAT from any longer term rally attempt.
Still, recommending to sell $CAT now, is irresponsible (Yes Mr. Cramer).
$CAT reached a weekly support zone (64-65$) that can create short term pullback, perhaps towards the 80$ zone. Buying $CAT right now is too risky, and If' I'd planned to buy it here, I'd wait for at least some sort of daily reversal pattern or at least a weekly Pinbar pattern.
The better opportunity will be if (and I believe ..when) $CAT will decline towards the 55$ zone.
The 55$ is a strong weekly structure zone (support) and the completion zone of a bullish Butterfly pattern.
55$ should definitely be marked as potential Buy Zone for those who seek to buy $CAT stock (obviously you need to look for smaller time frames and seek for confirmation signals before jumping in front of this speeding bearish train).
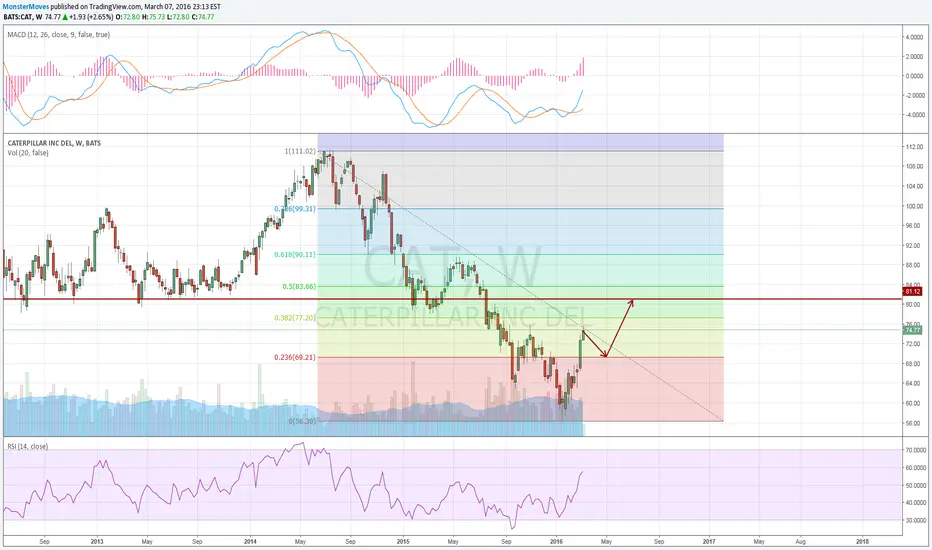
So 65$ and 55$ are two potential buy zones (with clear advantage to 55$). Both of these buy zones have the same target zone - 75-80$.
80$ will a major sell zone to monitor over the next weeks/months. If $CAT will rally (Year End Rally), 80$ will be the zone to monitor for possible selling opportunities....but, pay attention also to 88$. A weekly False Break to 88$ isn't something I'd rule out (not likely at this stage but put it in mind).
One last thing.. If, the highly unlikely scenario that $CAT will break below 50$ will occur, there's also a bullish Bat completing near 30$ (32$). It really looks highly unlikely but.. hey.. no one thought that $CAT will lose almost half of its value in about a year
If you like this analysis, please press the like and follow.
You can visit and follow my blog for more analysis and trading ideas (for stocks and Forex) - goo.gl
Subscribe to the Weekly Markets Analysis newsletters - goo.gl

CATHello everyone, we have two patterns: the first one being bullish crab (blue pattern)
: the second one is gartley (potentially not valid as of now)
The blue one might still be intact on the other hand we have potential pattern (pink). We can catch the C leg towards the D leg, depending on one's liking.
The targets are highlighted on the chart.
Lets see and Good Luck :)

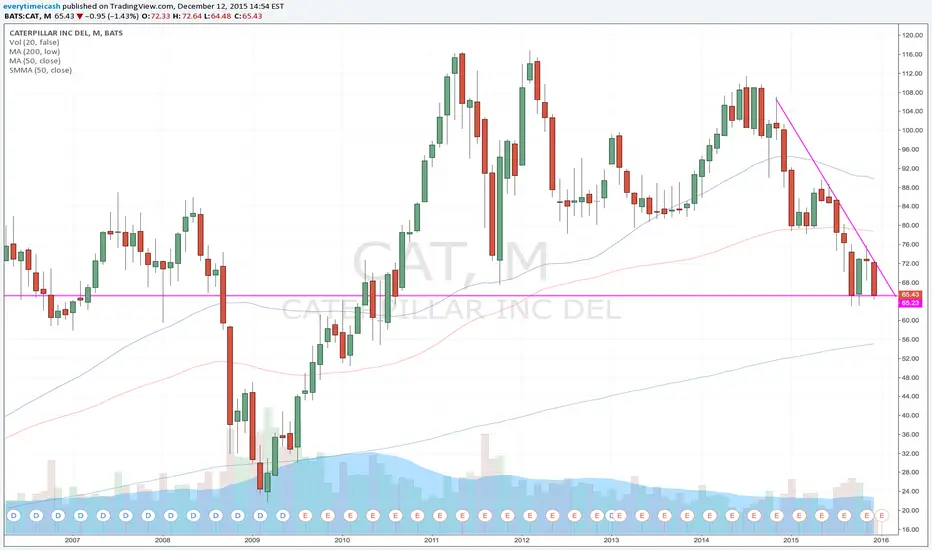
DOW JONES OVERVIEW: CAT IS ON RISK OF A MAJOR DOWNMOVECAT is on risk of both long term and short term downtrend.
On long term basis, price is trading below lower 1st standard deviation from 5-year mean (at 80), risking a downtrend on 5-year basis.
Price has also broken below 10-year mean (at 77), so it has no major support there - and is free to go down.
On short term basis, price ii trading below both 1st standard deviation on 1-year and quarterly basis - thus CAT is in a full fledged downtrend there
What is interesting, quarterly mean is now very close to lower 1st standard deviation on 5-year basis, ad lower 1st standard deviations from quarterly and 1-year means are close to 10-year mean.
Thus CAT is on risk of a major fall, until it breaks above quarterly mean, which will cancel all risks - both on short and long term basis!

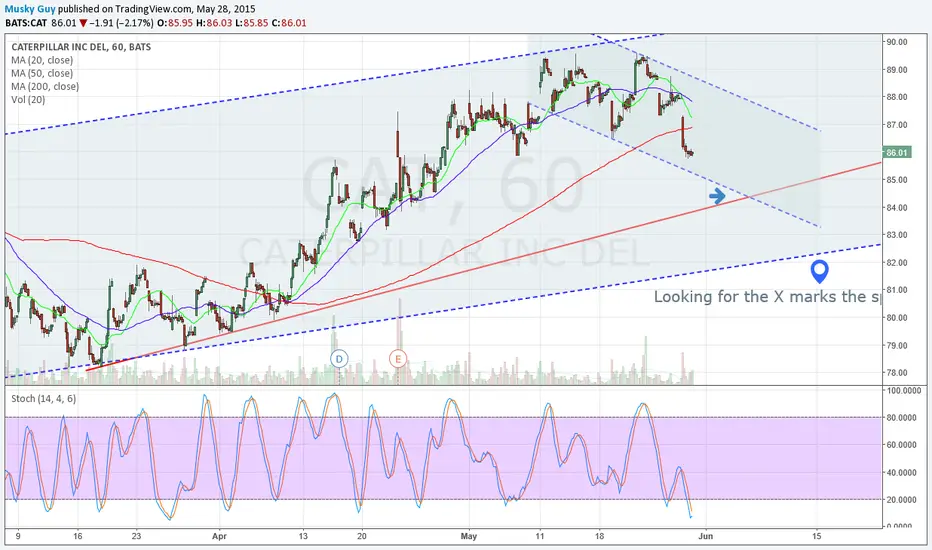
CAT 60 minute pull backCAT has been on a good run but a strong pull back will set up for a nice bounce. Looking for a bounce off the X marks the spot area. Will entry Calls when the time is nearing.
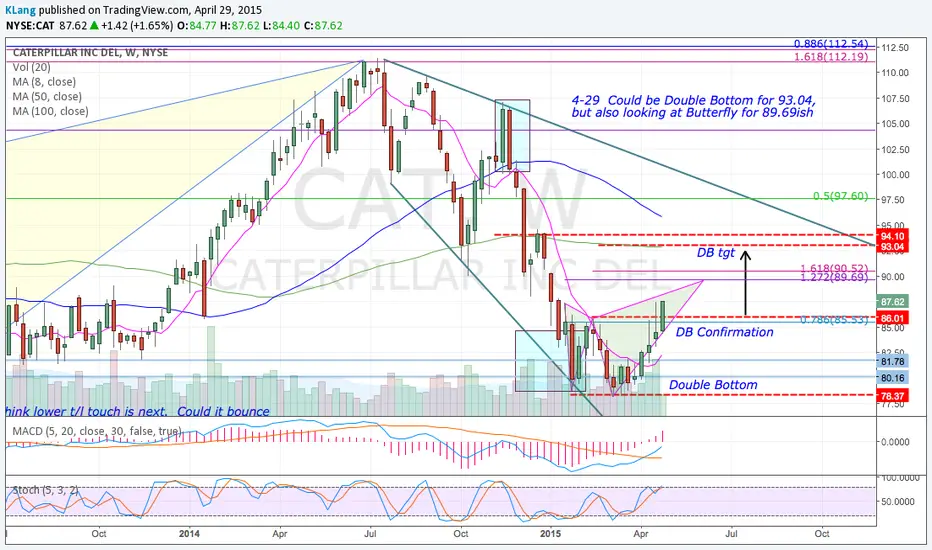
CATDouble Bottom OR Butterfly. While I don't LOVE the formation on the weekly view, since it often trades with oil and I believe there is a Shark in play in USO which does not have much more upside, the Butterfly would make sense