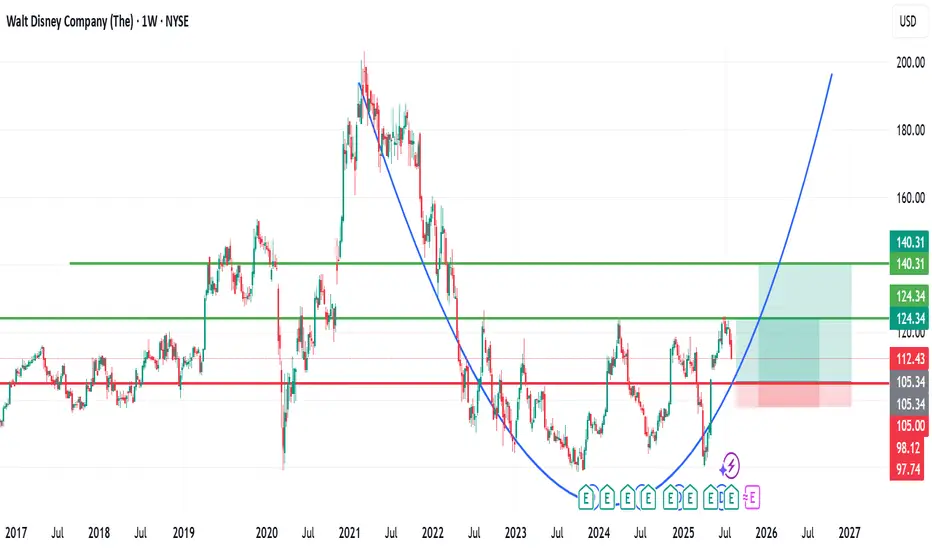
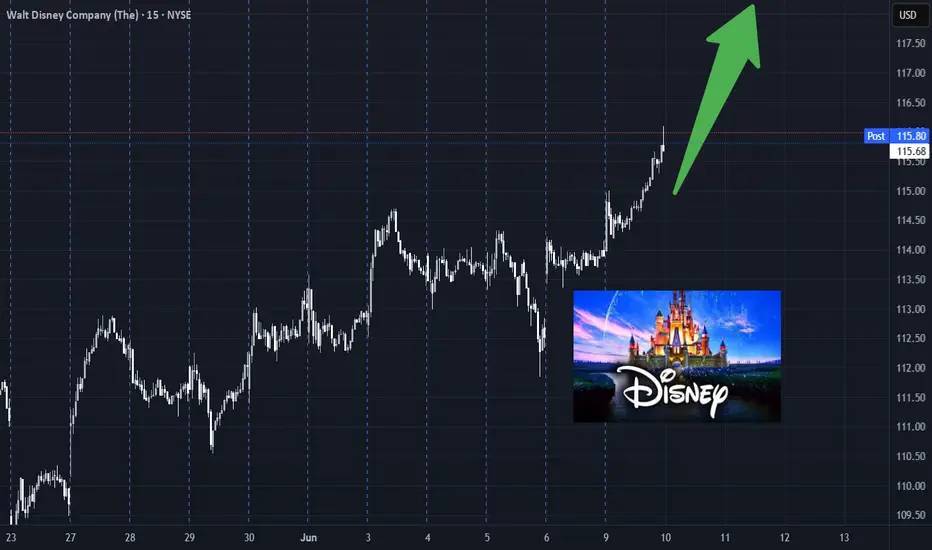
DIDNEY is bullish long-termDIDNEY is bullish long-term
Following its drop from ATH and a long consolidation, it seems this stock has started its upward push.
I will start buying using DCA strategy from $105 - $104 zone.
It is going to be a long term holding
Key facts today
2.55 USD
3.98 B USD
72.80 B USD
About Walt Disney Company (The)
Sector
Industry
CEO
Robert A. Iger
Website
Headquarters
Burbank
Founded
1923
ISIN
ARDEUT110137
FIGI
BBG000FCR4K6
The Walt Disney Co. engages in the business of international family entertainment and media enterprise. It owns and operates television and radio production, distribution and broadcasting stations, direct-to-consumer services, amusement parks, and hotels. It operates through the following business segments: Disney Entertainment, ESPN, and Disney Parks, Experiences, and Products. The company was founded by Walter Elias Disney on October 16, 1923 and is headquartered in Burbank, CA.
Related stocks
Is Disney Losing Its Magic or Just Pulling Off One More SpectacuToo often, we exhaust ourselves asking, “What will this stock do next?” and “Why will it go up or down?” We scan headlines, debate macro trends, and craft elaborate forecasts, only to find the market moving in ways we never imagined.
This happens because, as retail investors, we don’t have acces
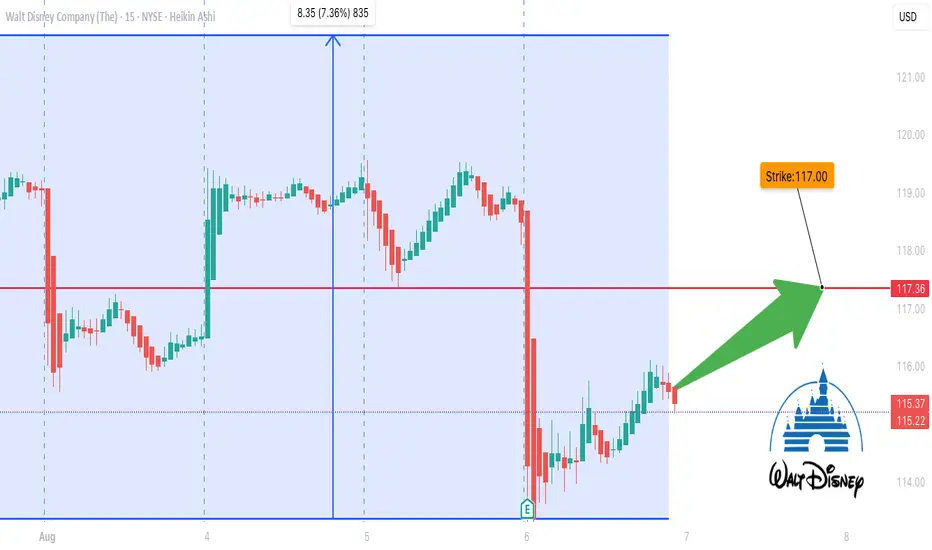
DIS Call Option Loading – $117 Breakout Imminent?## 🎯 DIS Weekly Call Setup – 117C by Friday? Institutions Are Betting Big! 💥
**🧠 Summary of Smart Model Consensus (2025-08-06)**
> ⚖️ *Mixed Momentum, But Bullish Flow Stands Out*
---
### 🔍 5 AI Models – Here's What They're Seeing:
**📈 Grok/xAI:**
✅ *Bullish Weekly Flow* (Call/Put ratio: 2.54)
DIS Long The broader market structure on the 1-hour chart shows a clear downtrend with successive lower highs and lower lows. A Change of Character (CHoCH) is marked at 111.35, indicating a potential reversal after the recent strong bullish move from the demand zone below. However, no Break of Structure (BOS
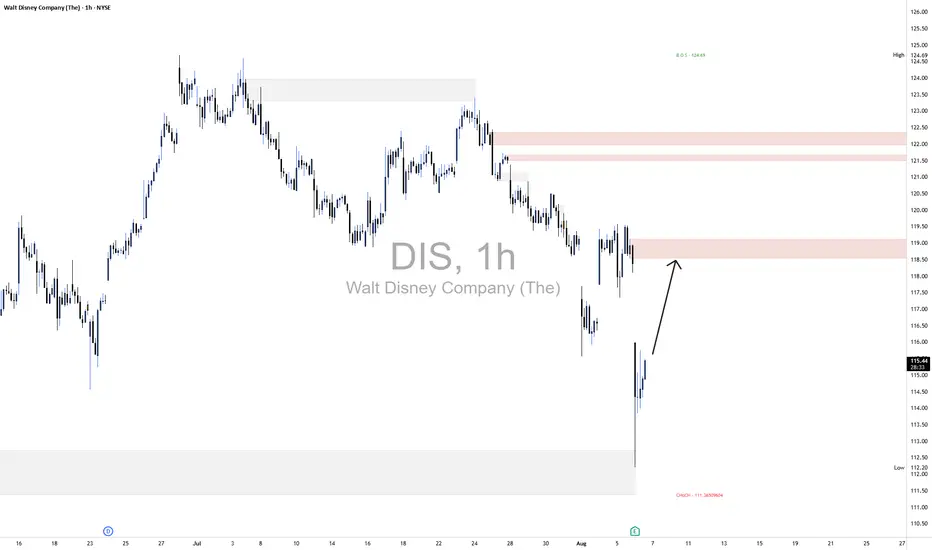
Disney: Positioned for Upside with Strong Streaming MomentumCurrent Price: $112.43
Direction: LONG
Targets:
- T1 = $115.90
- T2 = $118.80
Stop Levels:
- S1 = $111.00
- S2 = $109.00
**Wisdom of Professional Traders:**
This analysis synthesizes insights from thousands of professional traders and market experts, leveraging collective intelligence to i
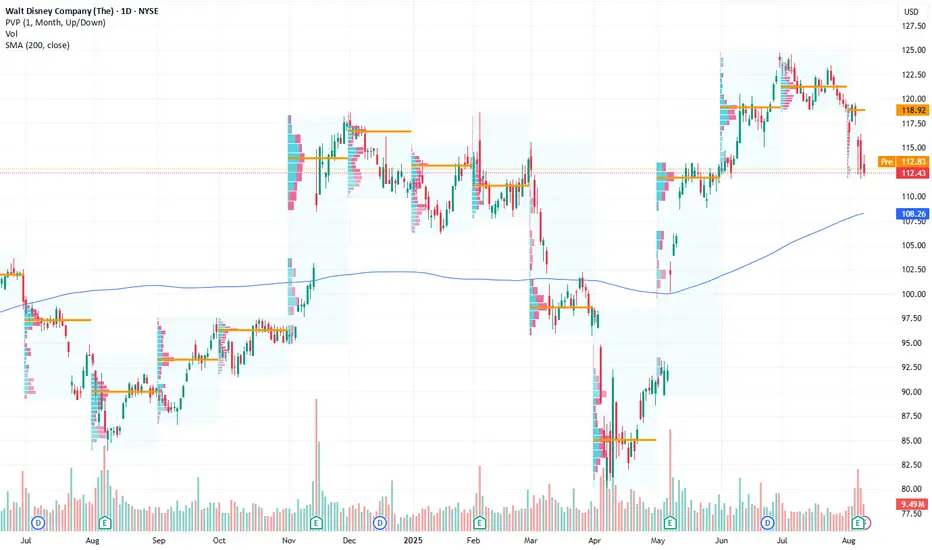
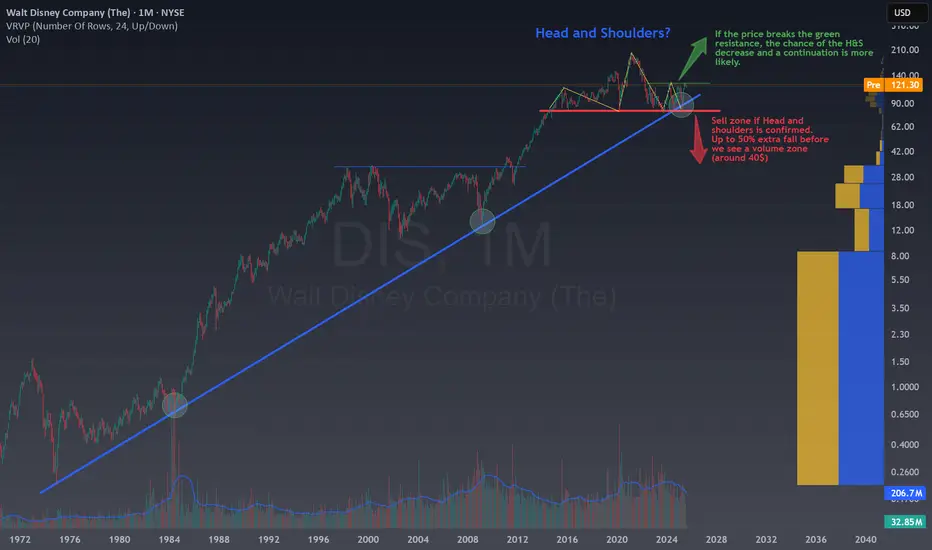
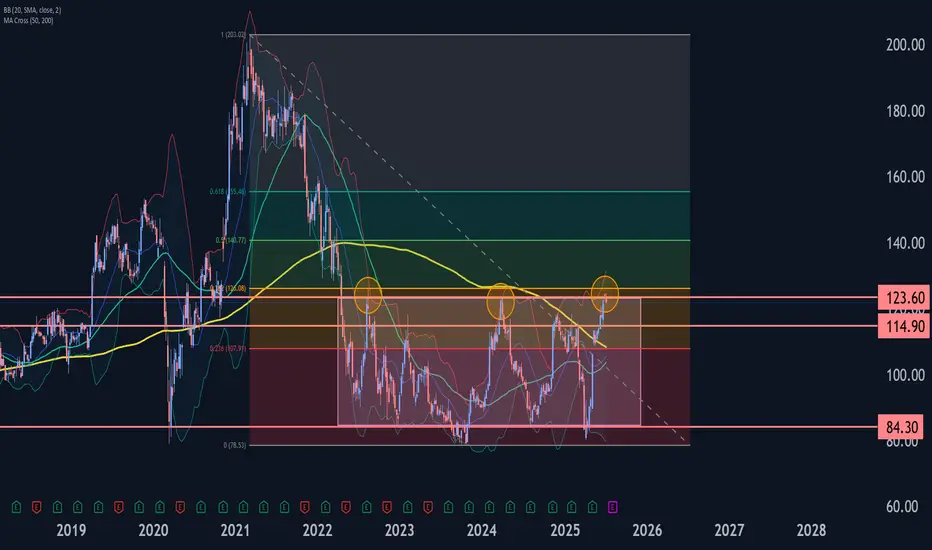
Disney Wave Analysis – 8 July 2025- Disney reversed from multi-month resistance level 123.60
- Likely to fall to support level 114.90
Disney recently reversed from the strong multi-month resistance level 123.60 (which is the upper border of the sideways price range inside which the price has been trading from 2022) standing near th
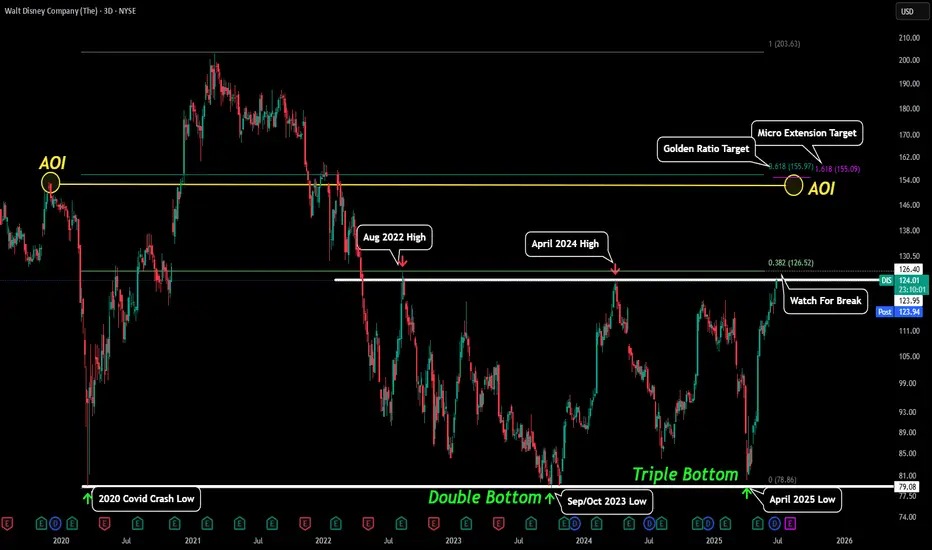
DIS - Magical Breakout LoomingDisney is preparing for an explosive breakout! There is a lot going on this chart so lets break it down for you.
This first thing to note is this is the 3day chart. Therefore this market structure has been developing over the last 5 years!
The first low of this mega trend was established during
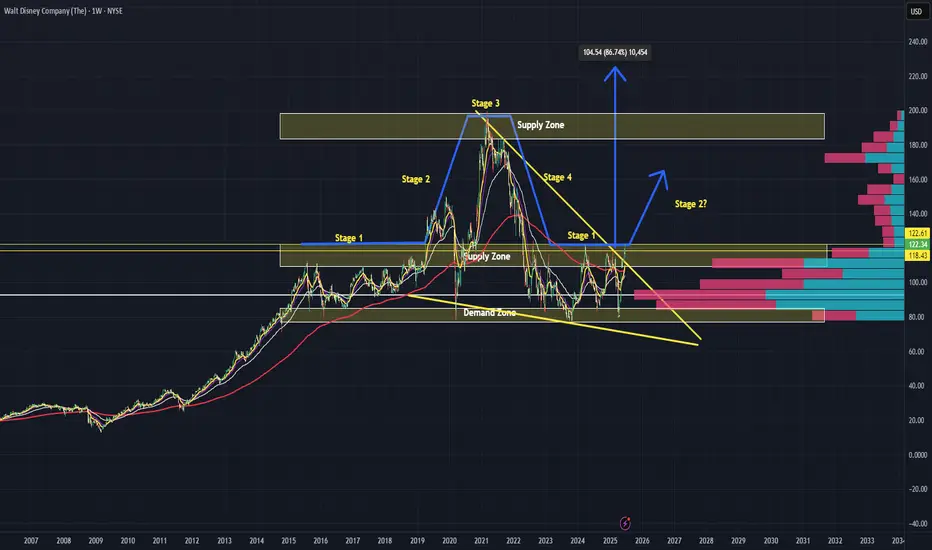
Disney: A Magical Breakout in the Making?
🏰After 3 years of consolidation, Disney ( NYSE:DIS ) is finally showing signs of life on the charts. Price action is breaking out of a well-defined falling wedge, aligning almost perfectly with a classic Wyckoff Price Cycle — and it now looks poised to enter Stage 2: The Uptrend.
For traders wait
TradingView Show: New Trade Ideas and The Leap TradeStationJoin us for a timely TradingView live stream with David Russell, Head of Global Market Strategy at TradeStation, as we break down the latest rebound in the markets and what it could mean for traders and investors. In this session, we’ll dive into:
- The upcoming Fed meeting and what policymakers

DIS Weekly Options Outlook (Week of 2025-06-09)📈 DIS Weekly Options Outlook (Week of 2025-06-09)
🧠 Multi-Model AI Consensus | NYSE:DIS
This week, multiple AI models show short-term bullish momentum for Disney ( NYSE:DIS ), but technical overbought signals and options market dynamics point to potential pullback risks near $113 into Friday’s e
See all ideas
Summarizing what the indicators are suggesting.
Oscillators
Neutral
SellBuy
Strong sellStrong buy
Strong sellSellNeutralBuyStrong buy
Oscillators
Neutral
SellBuy
Strong sellStrong buy
Strong sellSellNeutralBuyStrong buy
Summary
Neutral
SellBuy
Strong sellStrong buy
Strong sellSellNeutralBuyStrong buy
Summary
Neutral
SellBuy
Strong sellStrong buy
Strong sellSellNeutralBuyStrong buy
Summary
Neutral
SellBuy
Strong sellStrong buy
Strong sellSellNeutralBuyStrong buy
Moving Averages
Neutral
SellBuy
Strong sellStrong buy
Strong sellSellNeutralBuyStrong buy
Moving Averages
Neutral
SellBuy
Strong sellStrong buy
Strong sellSellNeutralBuyStrong buy
Displays a symbol's price movements over previous years to identify recurring trends.
Curated watchlists where DISND is featured.