GS Goldman Sachs: $245 artificially undervalued towards $1,000new markets new customers when the rich becomes richer and the rise of middle class require more banking needs
Goldman shall dominate this space in the next decade.
That liquidity from the FED and make America great again shall benefit strong hands
Price action wise it's a Parabolic to fresh highs
--
LOADED for the long run
warren may just mark this up to $300 to make a statement
REMINDER: this listed most issues and as underwriter packager
it knows how to surprise the PUBLIC
GSD trade ideas


Goldman running into earnings Having lagged its peers throughout 2019, recent upgrades and optimism coming into earnings on the 14th Jan have sent the stock on a fantastic bull run.
Strong historical price resistance on the horizon so less risk is to trade the break above or indeed wait for earnings to see the stock reaction, it could very well be a sell the news event.
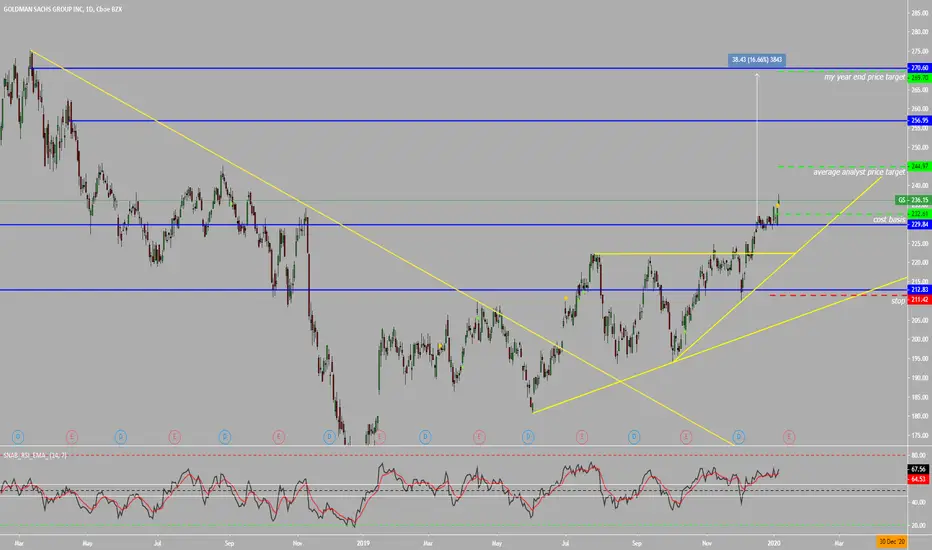
GS to SOARAccording to goldman sachs, their stock is unfairly undervalued. They believe their stock should be trading at $400 per share, which tells me that they're gearing up for some changes. My year end price target is back to all time highs. If it hits, I will hold should accumulation present itself.
Thank you for your likes and your FOLLOW! Let me know if you have any questions or comments. Cheers!
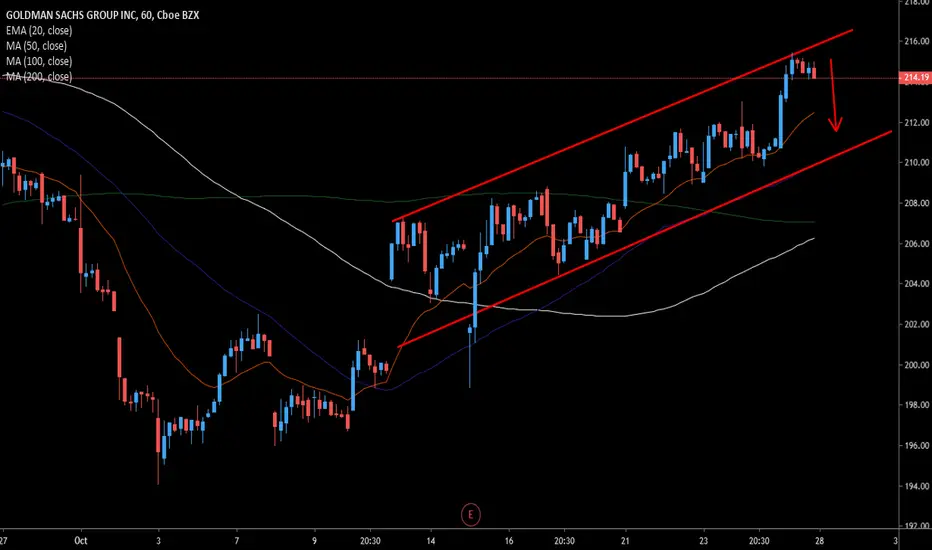
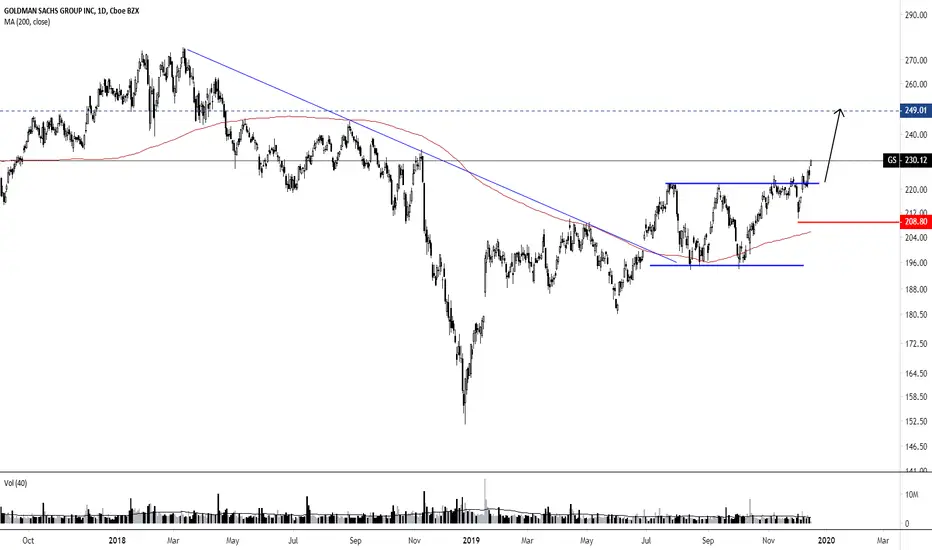
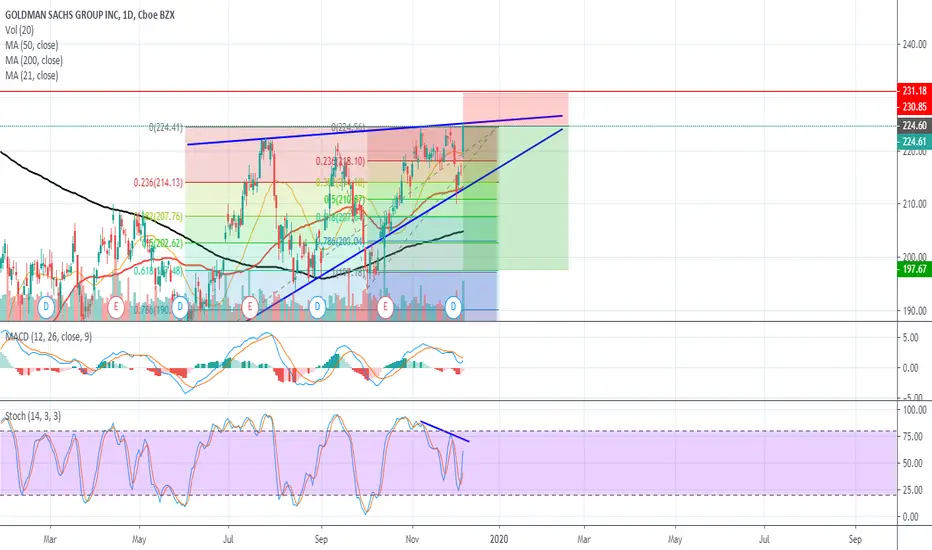
Goldman Sachs running out of steamThey banks have been on a rally in 2019 and although GS still lags behind and has actually broken through some major resistance, they indicators are signalling that a retrace is on the cards.
Moving averages also need to catch up to provide some support.
Pullback could be as low as $209
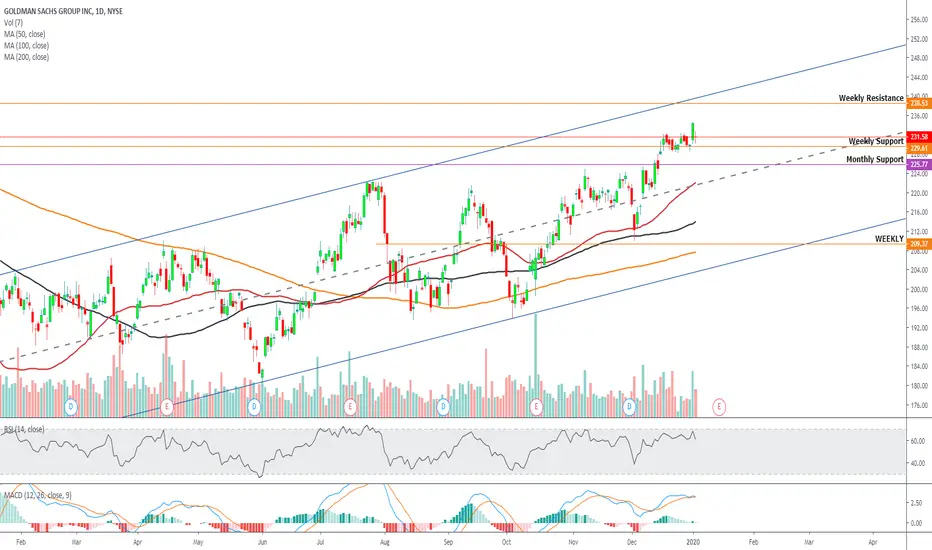
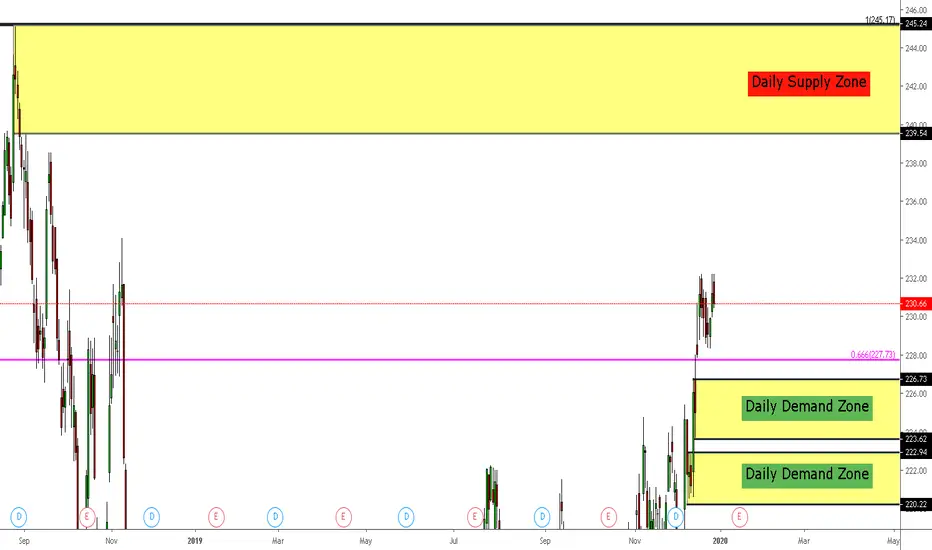
Goldman Sachs Monthly Income--LongStock is trading in an uptrend on the Weekly chart. I have identified fresh Supply Zones and fresh Demand Zones on the Daily charts.
Goldman short play?looking at GS on the daily seems like we have a bearish div looking to play out pull back on the horizon.
short to 225 this coming week.
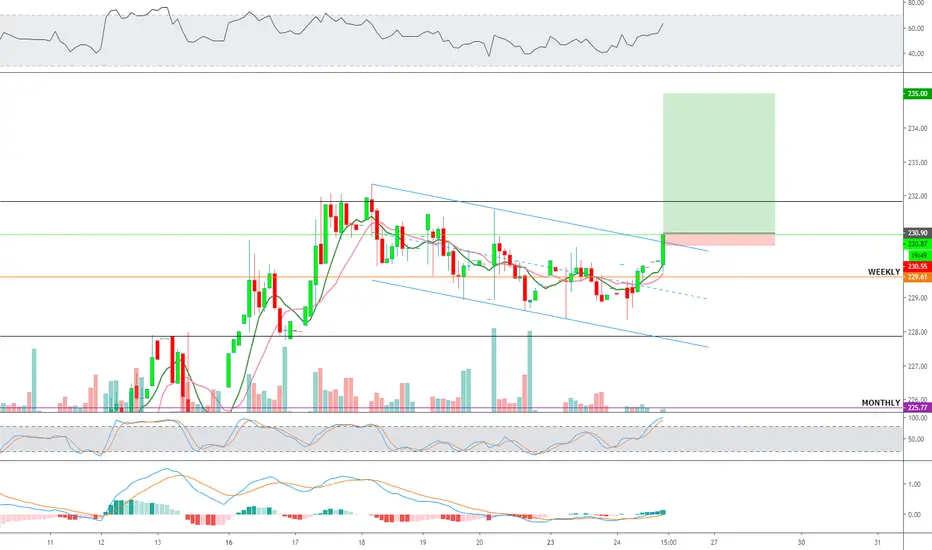
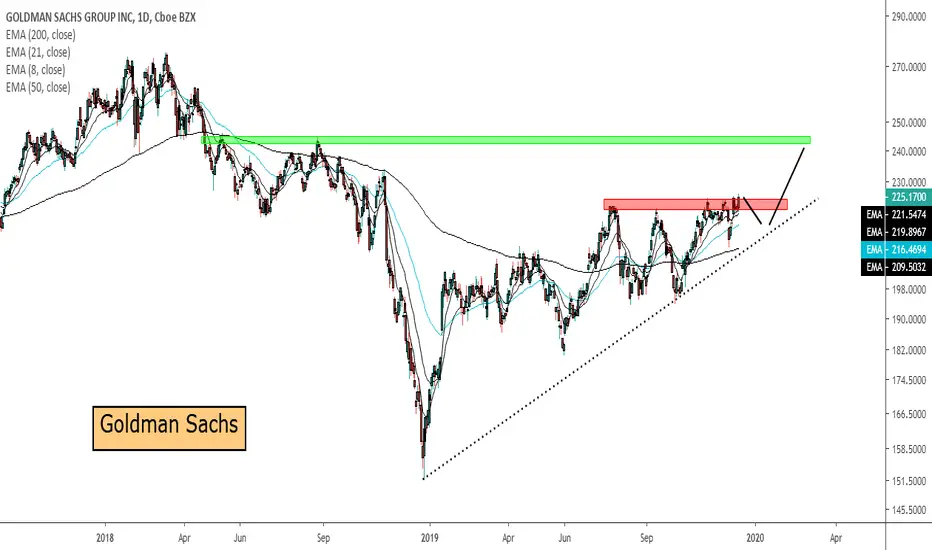
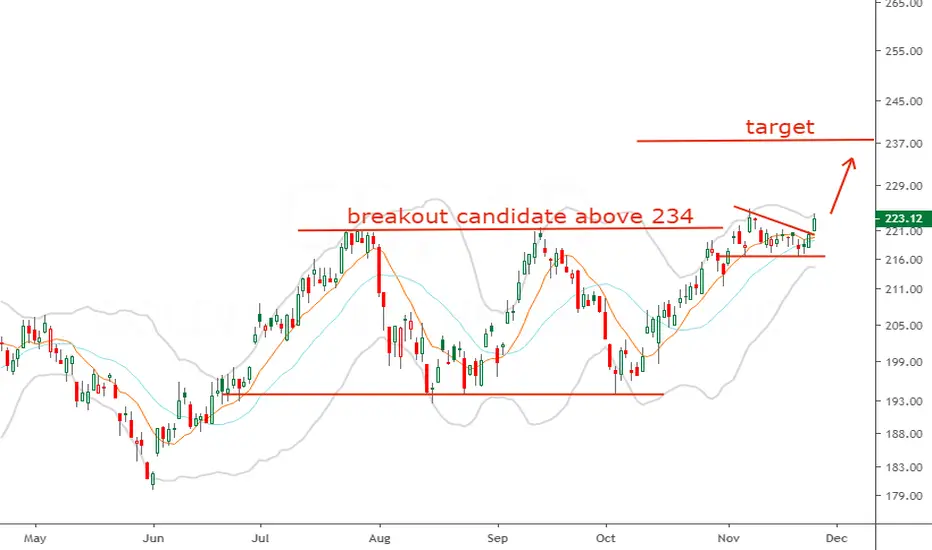
Goldman Day trade possibleStock breaking out from well defined channel (flag) with $235 first target
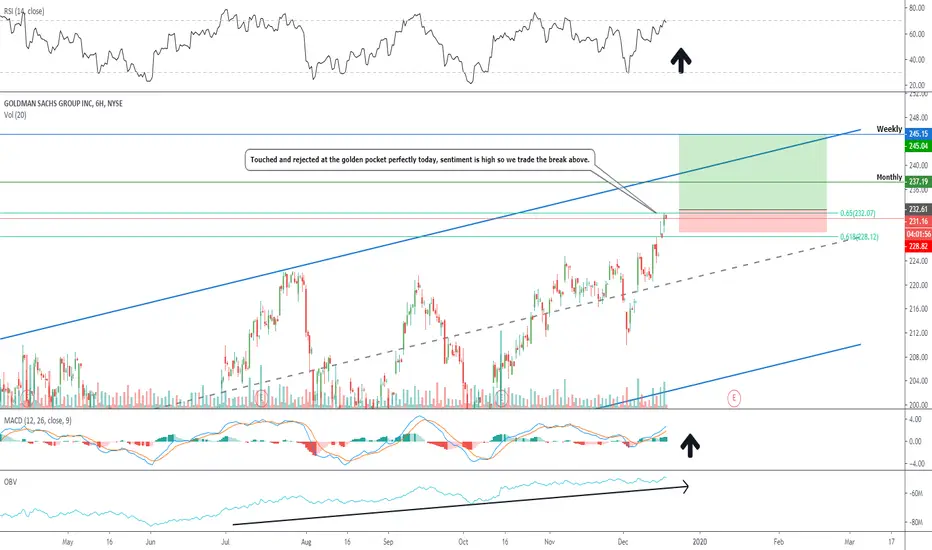
$GS Buy the break above Resistance in Goldman Sachs Entry level $232.61 = Target price $245.04 = Stop loss $228.82
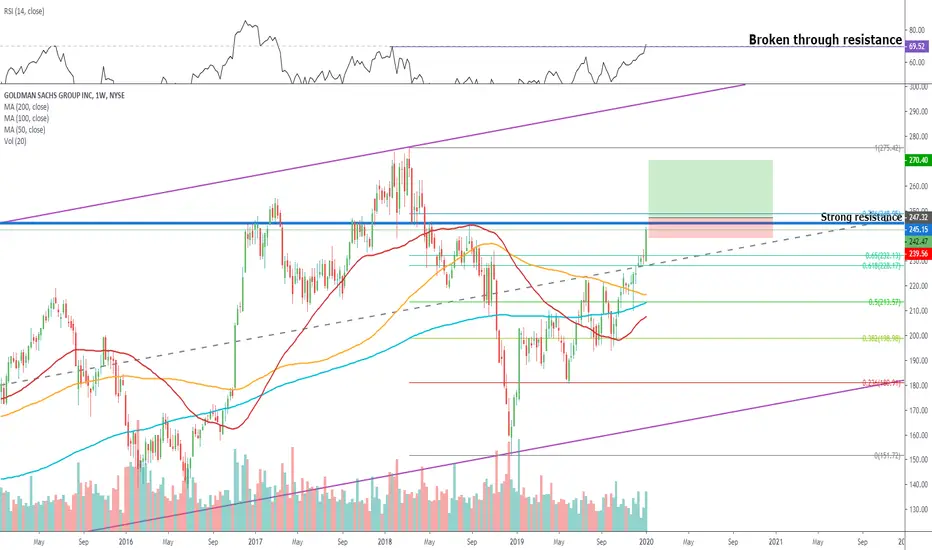
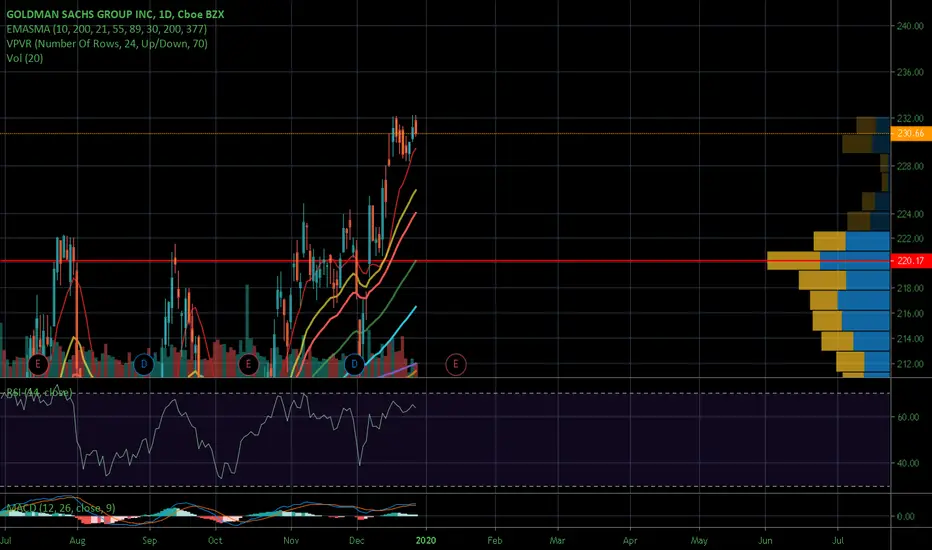
Upgrades galore for Goldman this week.
The OBV and RSI in very strong uptrend.
The stock lags its peers so may attract some catch up money into the end of the year.
The compnay is changing its structure and its cooperation with AAPL is a major boost.
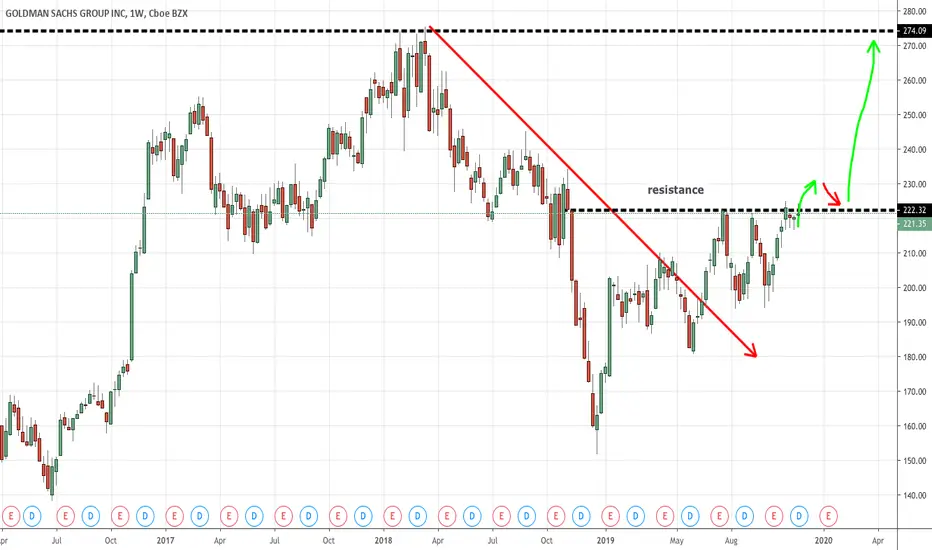
$GS Goldman Sachs approaches resistanceAlthough GS has lagged its peers in recent weeks it has trundled up a well defined channel but those advances have now stalled at horizontal and Fibonacci resistance.
It will take a almighty market rally to get GS back to its highs of 2018.
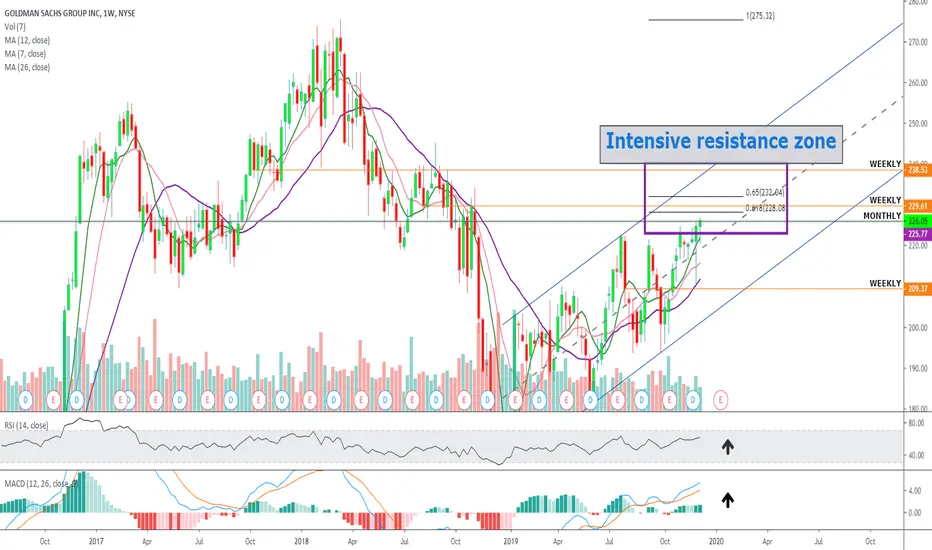
Goldman Sachs Equities Offshore | Goldman Sachs GS
The price testing the 4 1/2 month horizontal resistance. Shoulder we see another pullback to below $218 - combined with continued buying support - trader could use the opportunity to take a buy long for a breakthrough to $241.
NYSE:GS
Short on #GSAfter a triple top pattern, the stock did unexpected pullback. This caused negative divergence with Stochastic oscillator and it is confirmed by MACD.
The support and resistance are set to buy Fibonacci retracement & Fibonacci projection.
.80% exit on 0.786
.20% on 1
The main use of the analysis is to follow personal progress. Feedback is highly appreciated.
Always do your own analysis before entering a trade.
Stock of the Week: Goldman Sachs Group (GS)Local Breakout after Bullish Behaviour Suggests Further Advance
WYCKOFF STORY
Upsloping price structure of higher highs and higher lows suggests accumulation that happens on diminished supply signature.
Last bar acts as a local breakout which is confirmed by increased demand signature.
Up trending OBV suggests that institutions are actively getting into this position. Relative Strength is improving.
Trading Target $180 Count Line + (21 boxes * 3 reversal * $2 box size)= $306
Pattern Confirmation Continuation of rally above $230
Pattern Failure Close below $190

GS has gap to fillGS ready to fil gap going into next week on the 30min, made a solid run on Friday.
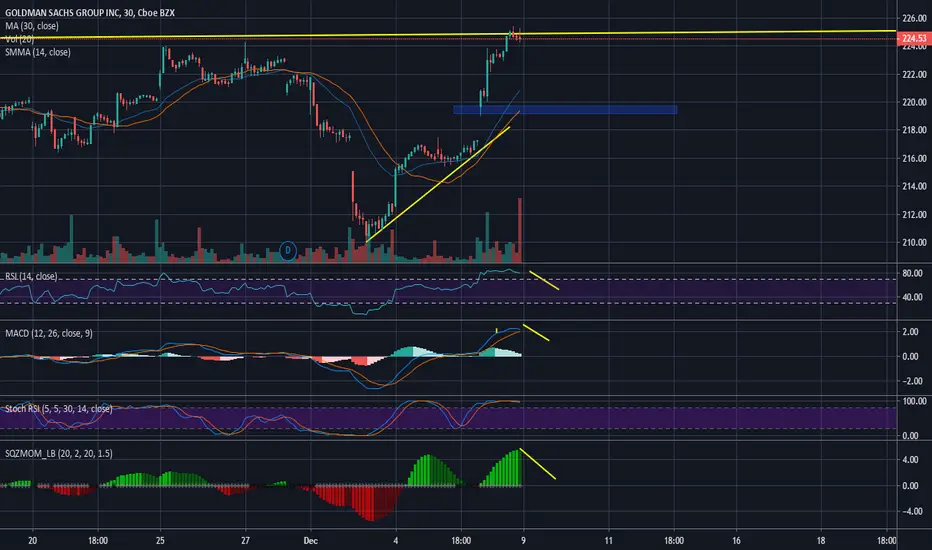
GS longCan we sustain this breakout ?
I can c a few positive signs
well formed @W@
A cup & handle
Breaking a 3 month sideways move
Moving avg r just in place
Can u c more signs?

The Goldman Sachs Group, Inc. (GS) – breakout ideaThe Goldman Sachs Group, Inc. (GS) – approaching potential breakout point at 234.
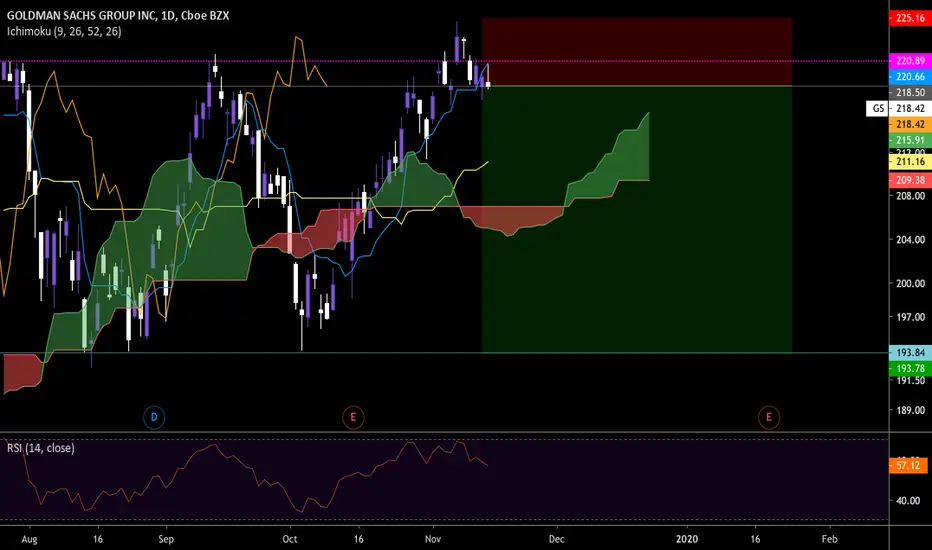

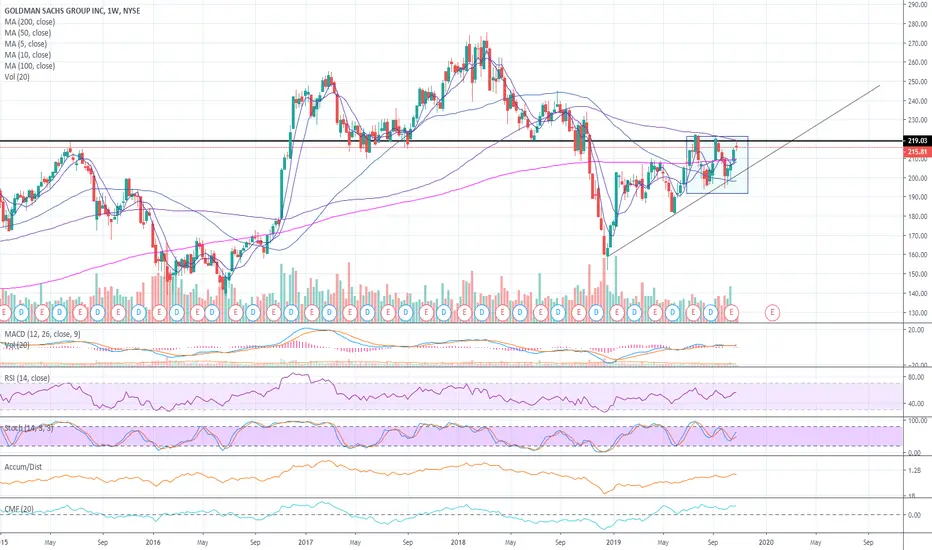
GS shortThe daily candle for today rejected at a previous resistance. We also see the lagging span reject the same area as last time.
The previous two times when the price closed under the $219.25 price level, it continued downwards.
I am planning to short until $215.72-ish, which is where I will be watchful waiting since I expect a bit of resistance there. It is still possible for GS to continue its upward trend, which I will be watching for carefully.

Goldman Sach
Goldman Sach is in bullish trend.
For short term price will form a corrective wave and may come down to the levels of 210.
Long term trend is bullish and we can enter once correction is over.