Goldman Sachs: Bullish Call After Q4 Earnings AnnouncementGoldman Sachs (GS) and Bank of America delivered stronger-than-expected earnings results for the fourth quarter, sending the banks’ stocks higher.
Goldman reported fourth quarter adjusted earnings per share of $6.05, outpacing analysts’ estimates of $4.53. The firm posted revenue of $8.08 billion for the quarter, topping analysts’ forecasts of $7.54 billion.
"We are pleased with our performance for the year, achieving strong top and bottom line results despite a challenging backdrop for our market-making businesses in the second half," CEO David Solomon said in a statement.
Shares of Goldman spiked more than 4% in the pre-market.
However, Goldman’s fixed income trading posted a big miss, delivering revenue of $822 million, 18% lower than the fourth quarter of 2017. The firm said the results reflected “significantly lower net revenues in credit products and lower net revenues in interest rate products.”
Elsewhere in banking, Bank of America (BAC) reported record earnings on Wednesday, delivering adjusted earnings per share of 70 cents, beating analyst estimates of 63 cents.
Revenue for the fourth quarter came in at $22.7 billion, also beating estimates of $22.36 billion.
Shares of Bank of America popped more than 3.5% in the pre-market.
GSD trade ideas

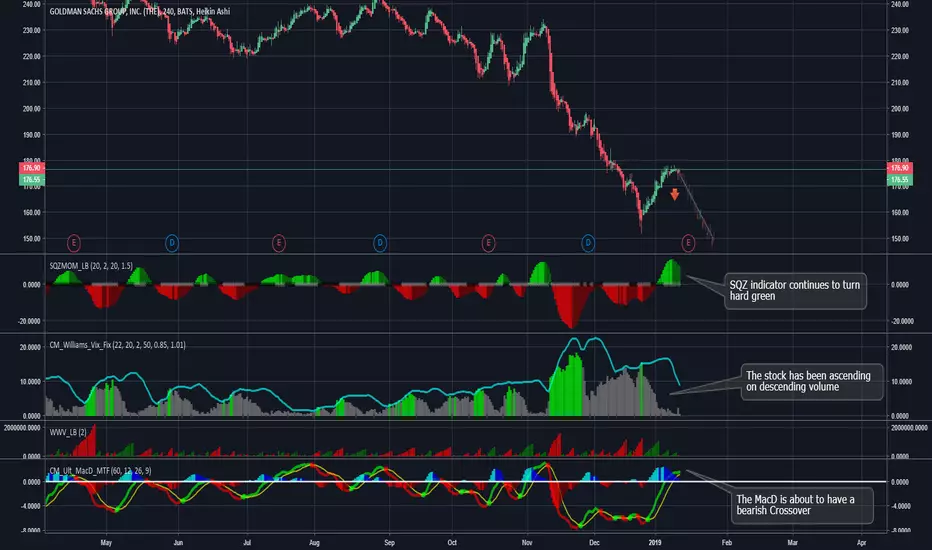
Goldman Sachs | Outlook & Earnings bearishLooking at Goldman Sachs chart.
The SQZ indicator continues to turn hard green. Indicating further down side.
The stock has been ascending on descending volume. Bearish sentiment.
The MacD is about to have a bearish crossover.
The chart follows the bearish sentiment that is seen across the market.

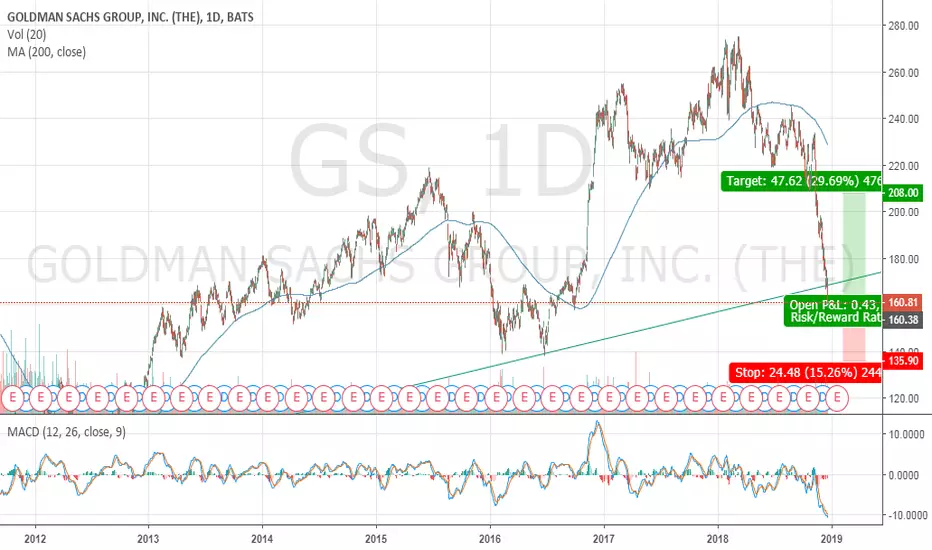
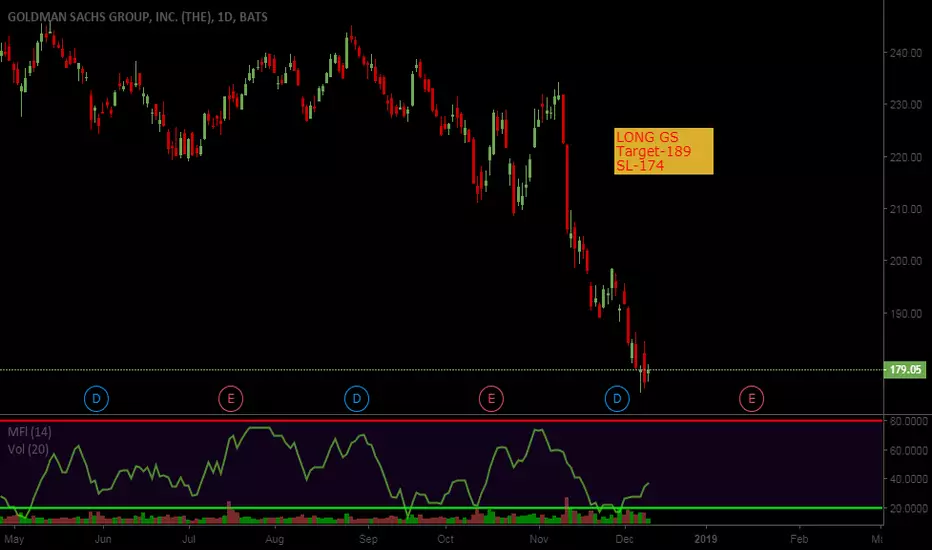
GS for Short (momentum weakening)My quant model predicts
Profitability: it has a high probability(62%) to rebound at this level.
Entry Level: 163.03
Worst Case Level: $183.5
Money Management: Bet no more than 15% of capital
Suggested Strategy: Short stock for 5 Days
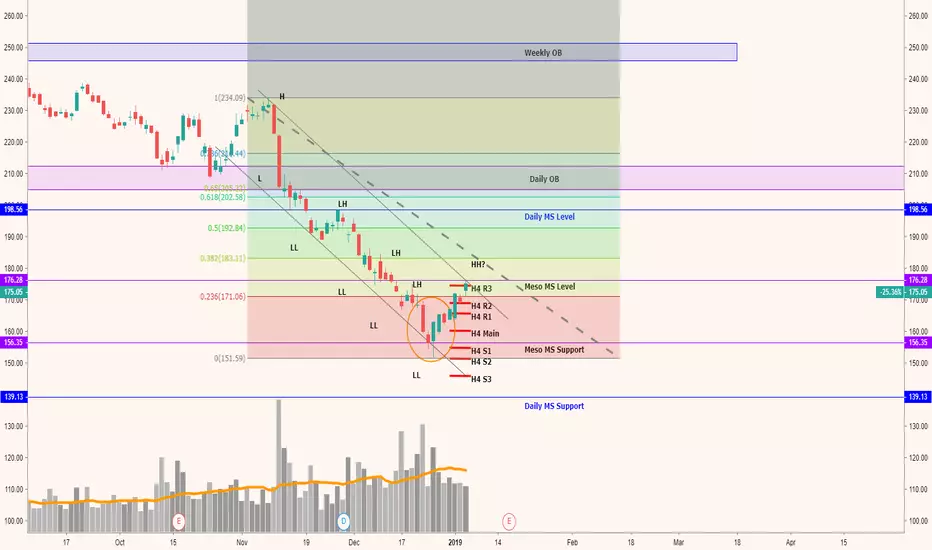
$GSA break on 172ish resistance could take us to the 0.382 fib retracement for a dead cat bounce. IF that happens and 172ish support helds, will create a HL and with the previous HH could confirm a downtrend reversal.

GS Broke Out Of Major Support, Potential Drop!GS broke out of its major support turned resistance at 171.75 where it could potentially drop further to its support at 137.33 (horizontal swing low support).
Ichimoku cloud is also showing signs of downward pressure which contributes to our bearish bias.

GS Broke Out Of Major Support, Potential to Drop!GS broke out of its support-turned-resistance line at 171.75 (23.6% Fibonacci retracement) where it could potentially fall further to its support at 137.15 (horizontal swing low support).
Ichimoku cloud is also showing signs of downward pressure.

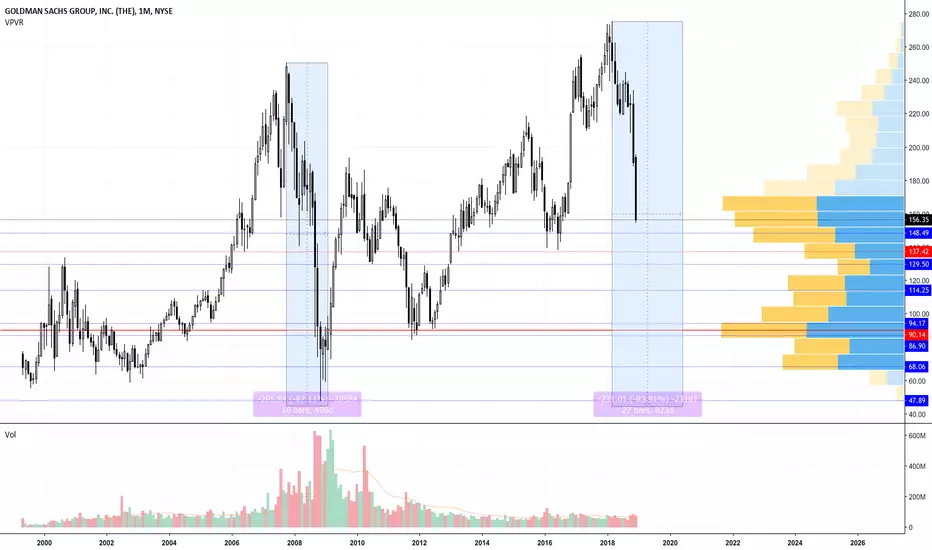
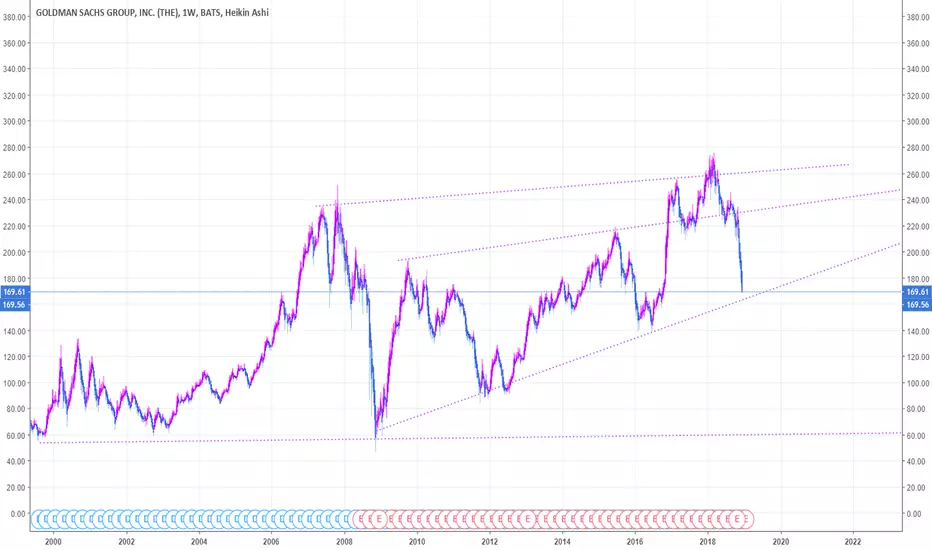
Dow Stocks Goldman Sachs (GS)A look at Goldman , this is a younger company than most and seem particularly vulnerable to a financial crash
I used mostly monthly resistance, very rare will weekly matter in this case
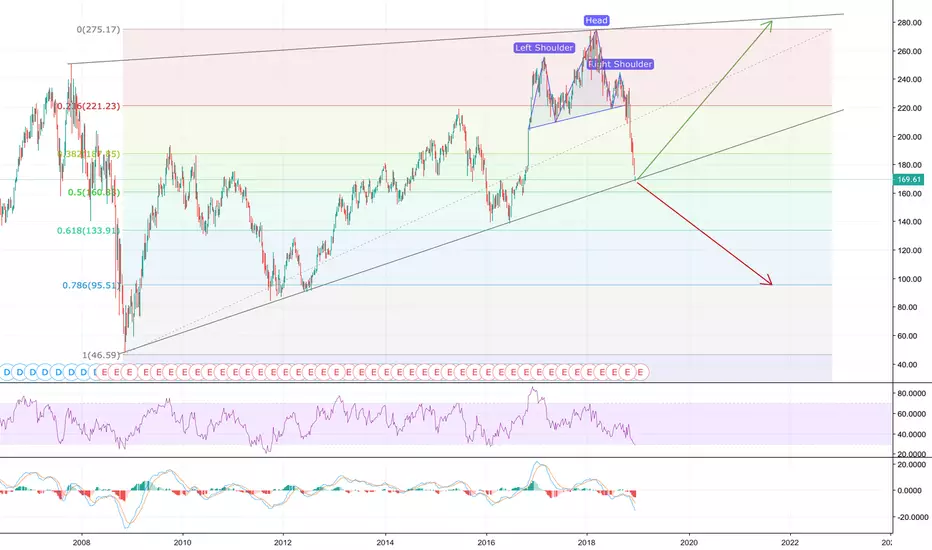
Goldman Sachs: Nice H&S ReversalBack to the low 170's? Seems reasonable. Poor sector performance, nice H&S pattern. We're going for it...

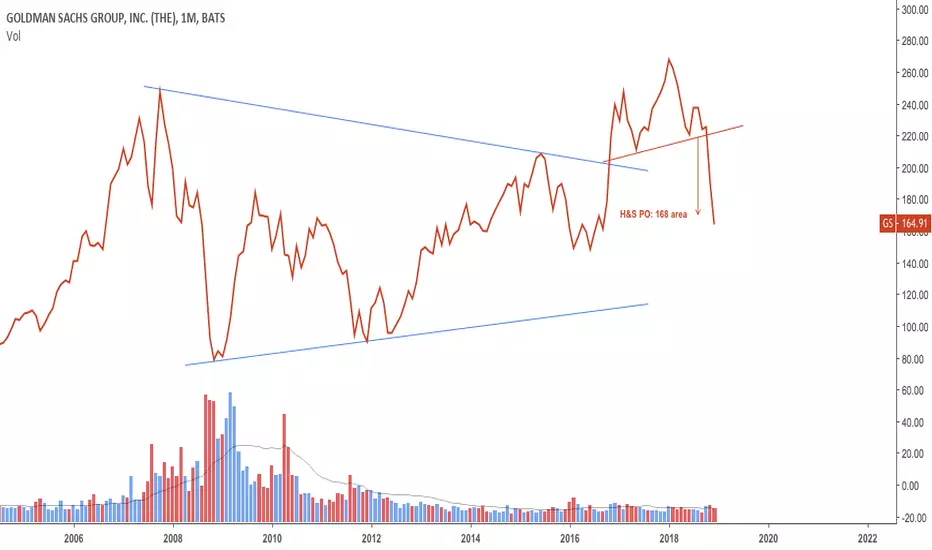
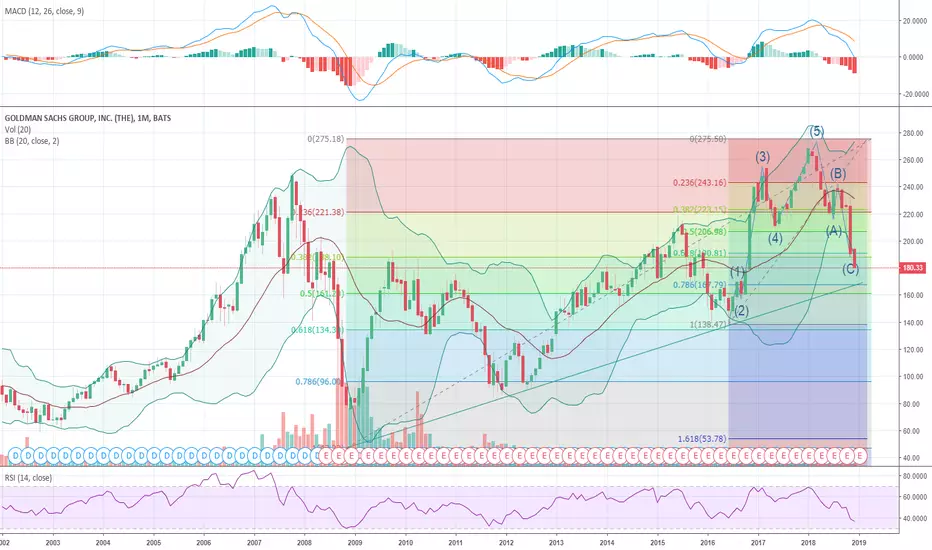
Decision Time for Goldman SachsThe H&S target has been reached, leaving GS at the rising trend line of the large rising wedge that has been in play since the 2008 crash. The RSI is showing that GS is oversold while the MACD is still taking a plunge. A MACD recovery and bullish cross would be a good sign. If the price closes under the rising trend line, I expect a large plunge to the 0.786 Fibonacci retracement. If the support holds, expect return to the top of the rising wedge .
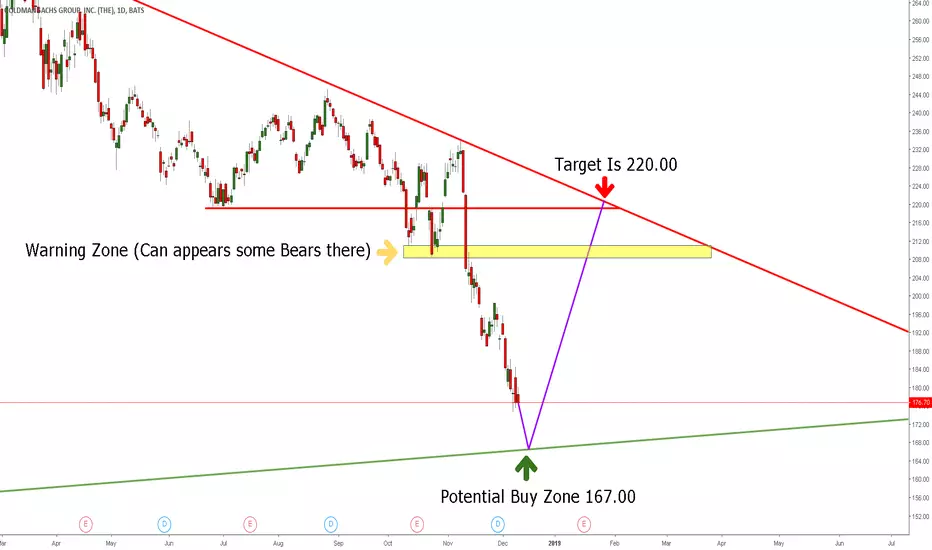
GS Approaching Support, Potential Bounce!GS is approaching support at 171.75 (61.8% Fibonacci extension, 76.4% Fibonacci retracement, horizontal overlap support) where it could potentially rise to its resistance at 209.46 (horizontal pullback resistance).
Stochastic (89, 5, 3) is approaching support at 3.1% where a corresponding bounce could occur.

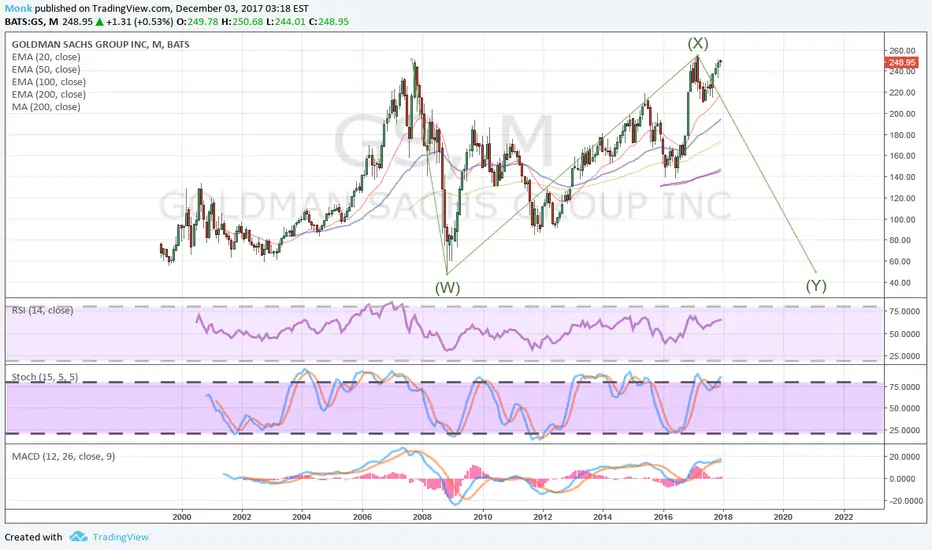
GOLDMAN SACHS: when a giant stumblesGoldman Sachs has stumbled and now there is much debate out there about what next to do. As usual some are shouting "enter long now", whilst others are saying "stay out" etc.
For me, it's very simple i.e. I just need to wait on a favourable time frame, somewhere between 2 - 6 hourly if I'm to go north. It's difficult to go short as there could be a rebellion of hopefuls heading north anytime soon. A northward push (if it happens) could attempt to test what I see as the base of a not so well-defined head and shoulders on the weekly.
The other major problem is that we are in dangerous economic times - far worse than 2008. So, GS could well head into a massive dive just like around 2008.
My strategy in the short term:
1. Wait for a pulse north and follow that if it happens on a microtrend (long position).
2. If that microtrend happens to get near the base, I'll be out - then look to short.
(Emphasis on the word 'if').
Longer term strategy:
1. If price goes into a deep dive like in 2008-ish probably months away, then look for favourable trend heading north, to go long.
2. Stalk for a double bottom if it happens.

Autonomous AI Vision Fund Upgrades Goldman Sachs to Sell $179.5Autonomous AI Vision Fund Upgrades Goldman Sachs to Sell $179.5
Strong Sell Rating $270

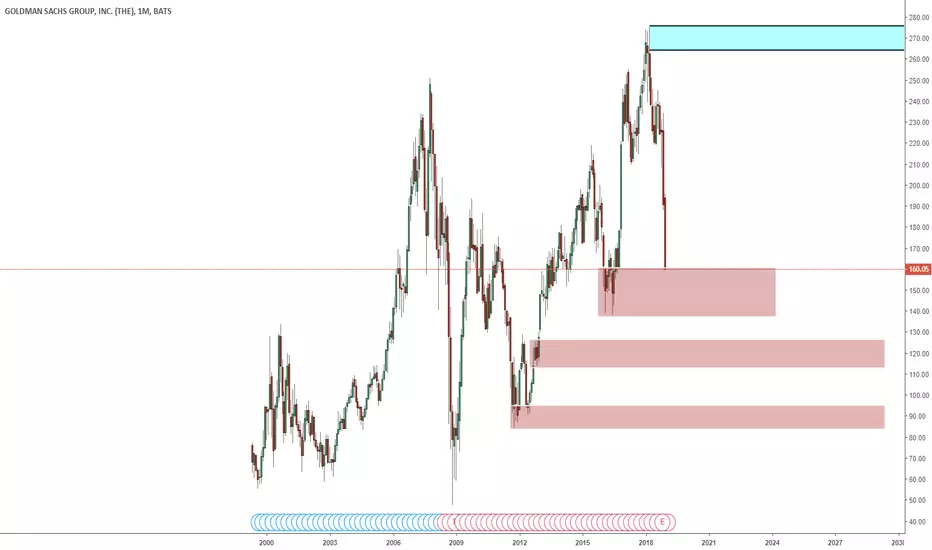
LAST STAND FOR GS AND MAYBE INVESTMENT BANKING The break of 188 support now gives a last stand support in the 161 to 168 area after that NOT GOOD AT ALL
GS Approaching Support, Potential Bounce!
GS is approaching support at 171.75 (61.8% Fibonacci extension, 76.4% Fibonacci retracement, horizontal overlap support) where price could bounce up to its resistance at 209.46 (61.8% Fibonacci retracement, horizontal pullback resistance).
Stochastic (89, 5, 3) is approaching its support at 3.15%.
