Take a bullish position on TSLA as price action confirms upside
Current Price: $325.31
Direction: LONG
Targets:
- T1 = $335.00
- T2 = $345.00
Stop Levels:
- S1 = $320.00
- S2 = $315.00
**Wisdom of Professional Traders:**
This analysis synthesizes insights from thousands of professional traders and market experts, leveraging collective intelligence to identify high-probability trade setups. The wisdom of crowds principle suggests that aggregated market perspectives from experienced professionals often outperform individual forecasts, reducing cognitive biases and highlighting consensus opportunities in Tesla.
**Key Insights:**
Tesla has shown substantial resilience in the tech-heavy market, with bullish sentiment linked to its innovative product lineup, particularly autonomous vehicles and the forthcoming robo-taxi launch. Institutional investors have actively increased positions, signaling long-term confidence in Tesla’s disruptive growth narrative. However, mixed profitability metrics and emerging competition in the global EV space keep valuations under scrutiny. Tesla’s price action around $325.31 suggests that the optimism surrounding potential catalysts outweighs near-term concerns, with technical momentum favoring further upside gains.
**Recent Performance:**
Tesla has demonstrated significant strength in recent trading sessions, successfully recovering from a minor pullback that aligned with broader market volatility. The stock climbed steadily from its $300 support level and has outperformed the broader tech sector during a period of overall market uncertainty. Heavy volume and speculative trading suggest strong engagement from both institutional and retail participants.
**Expert Analysis:**
Technical outlook for Tesla indicates bullish divergence on the daily Relative Strength Index (RSI) coupled with a successful retest of its 50-day moving average. These factors affirm that momentum remains firmly to the upside. Analysts highlight Tesla’s ability to set remarkable trends within the EV sector, backed by advancing autonomous technologies and renewable energy solutions. Near-term resistance sits at $335, where a breakout would likely trigger further upward movement toward $345.
**News Impact:**
Recent news regarding Tesla’s upcoming robo-taxi launch in June has considerably bolstered investor sentiment. Market participants view this innovation as a key milestone that could redefine Tesla’s growth trajectory. However, declining EV sales in Europe and the United States remain a concern, potentially capping excessive bullish momentum. Traders should watch for more clarity on macroeconomic factors influencing demand.
**Trading Recommendation:**
Tesla’s combination of technical strength and ground-breaking product developments underpins a favorable trading outlook. A long position with well-defined stops below $320 offers an attractive risk/reward setup, targeting $335 and $345 sequentially. While global sales trends warrant close monitoring, Tesla’s leadership within the EV and tech space supports a bullish thesis in the short term.
TSLA trade ideas
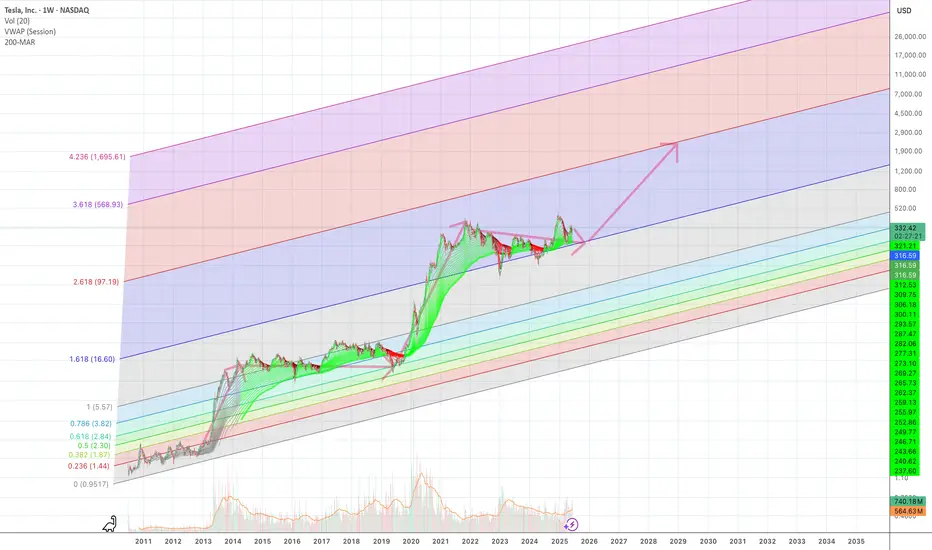
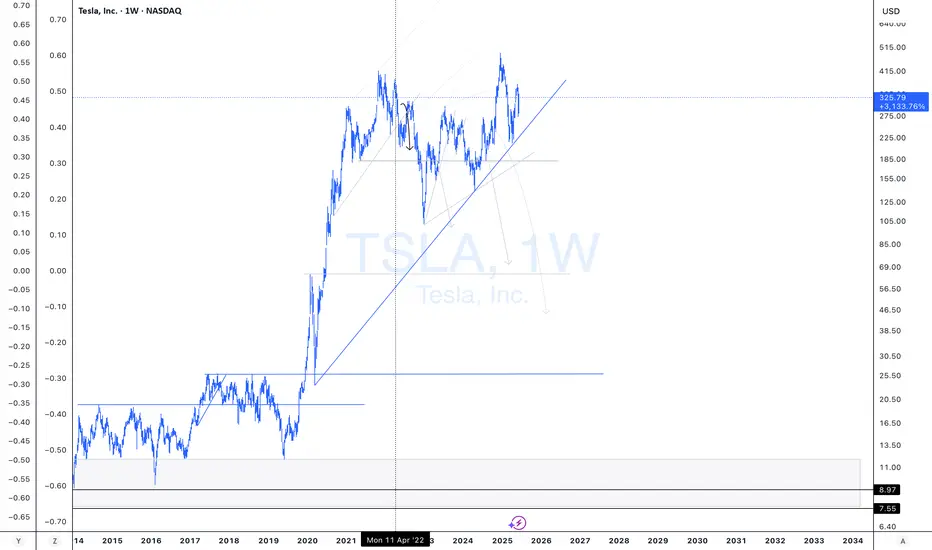
Near bottom. On The way To $2k as The Singularity Approaches see chart.
Near bottom. On The way To $2k as The Singularity Approaches .
looking hella bullishThe price will likely shoot up during premarket, then capitualate, then have the real price movement when the market opens.
Price is getting squeezed tighter, likely will have a dramatic move.

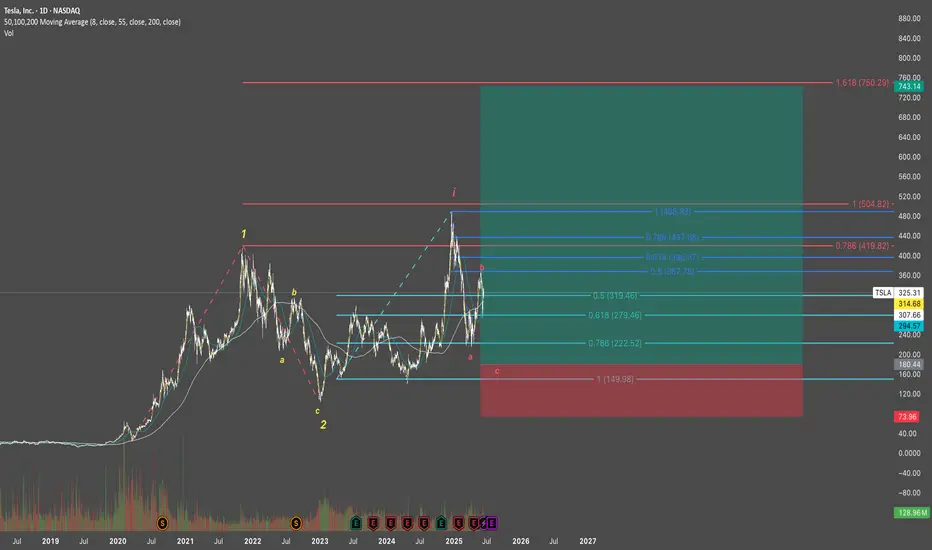
TSLA UPSIDE? BULLISH?Thoughts on Elliott Wave pattern applied to TSLA DAILY chart. Please do share thoughts, my belief is were are in a primary third wave, expect 5 impulse waves of minuet up. Hearing good things from tesla again recently.
TSLA Short Entry | Recession UnderwayI have added to NASDAQ:TSLA short.
I have also linked my previous Tesla short chart from 2022.
Nothing has changed with Tesla. The company is severely over-valued.
I will continue to provide updates.
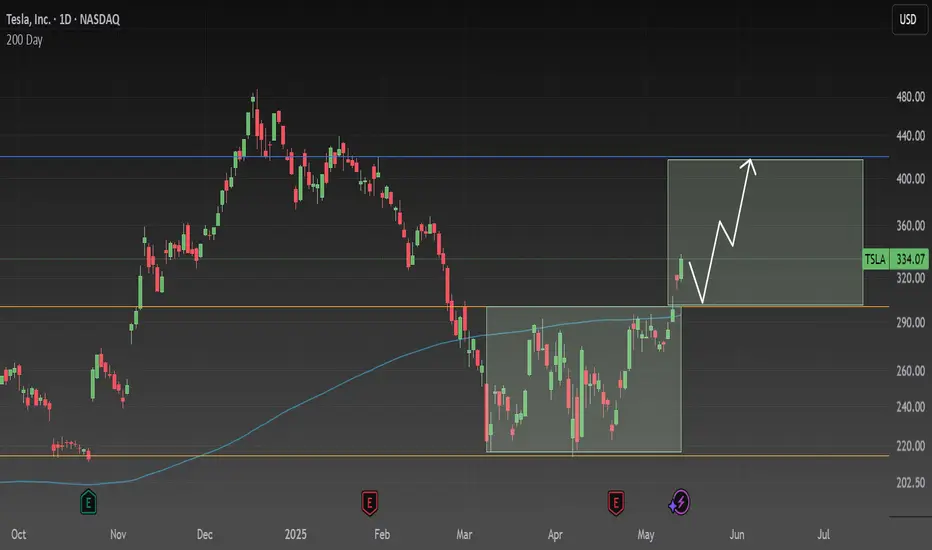
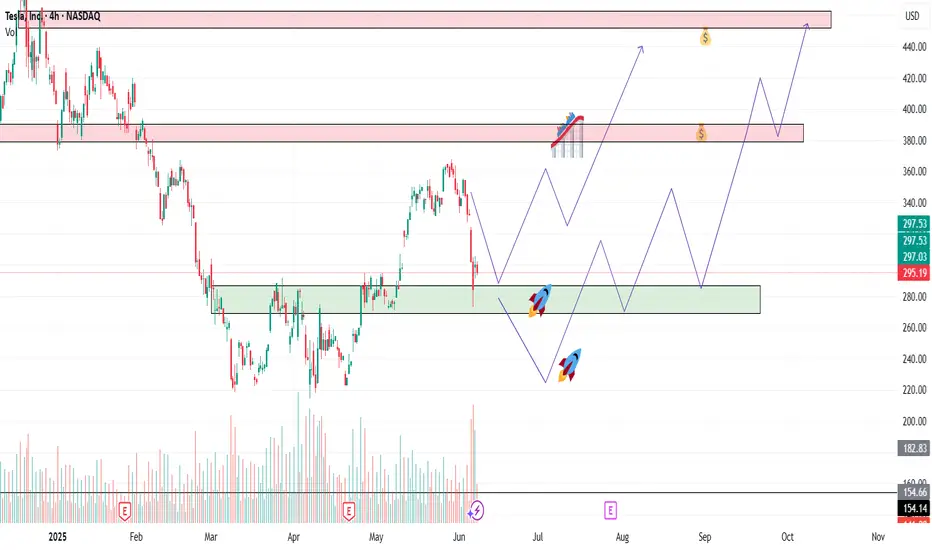
Tesla TSLA 🧠 Breakdown of this setup:
The pattern is an inverse head‑and‑shoulders, signaling a reversal from bearish to bullish momentum.
Technical commentators highlight crucial support near $300, suggesting that’s the fueling station before lift-off
After breaking the neckline, measured upside targets land in the $400–420 zone, fitting that “rocketship” trajectory vibe
🎯 Launch Pad & Destination
Pre‑launch dip: ~$300 sets the inverse H&S bottom.
Ignition point: Breakout above neckline brings liftoff.
Orbit target: ~$420—your mission succesfully completed.

How I Got My Win Rate to 94.12% ($4.59 per $1 risk expectancy)There's a lot of people who talk smack about high win rates, probably to justify their low win rates.
The justification usually sounds something like this 'You do know the best traders have win rates under 50% and win rates mean nothing right?'. Nothing could be further from the truth in the context of the archetypal character who writes such a thing in trading view minds. A high win rate shows something very very important.. proof of edge.
Now if someone wants to believe I'm taking penny wins and dollar losses, be my guest but use your head...in fact, one better... use your eyes. There is a nice little stat there called 'profit factor', what it tells you is how many dollars profit per trade my expectancy is. Wake up, understand that not everyone is a trading guru scammer. Not everyones stats are fake, and if you want to see for yourself... its easy to do. Simply watch my livestream, there is no better proof of edge than that.

TSLA shortPart of a larger analysis, at the moment Tsla rejected 332 B pivot and imo retesting possible b.o. area. missed gap up open, retest of highs sent 305p strike. looking to close at 310-305 tgt zone. n.f.a. g.l.h.f

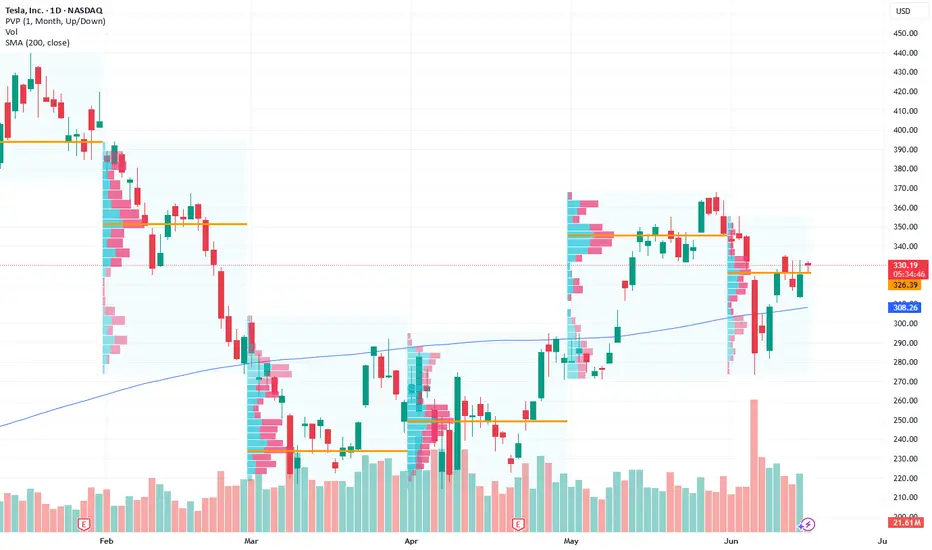
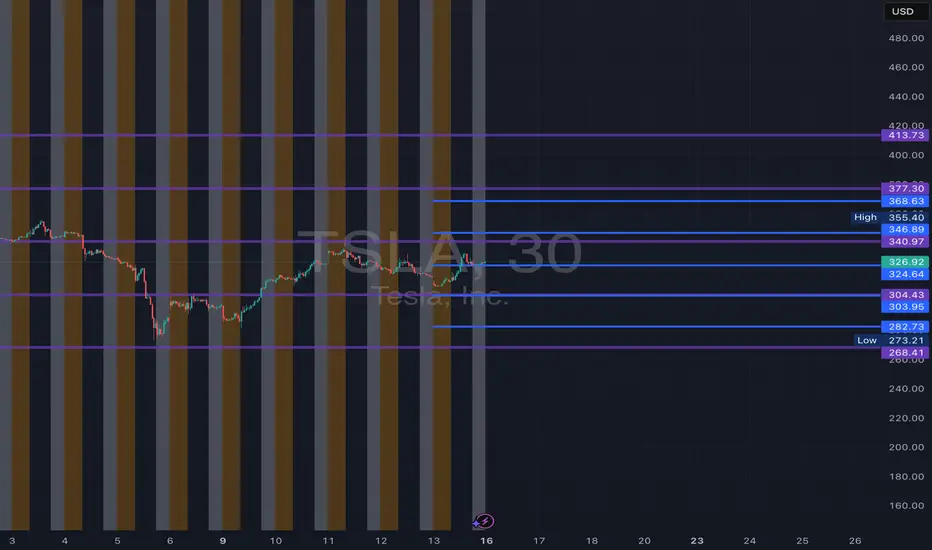
TSLA June 2025 Monthly Support & Resistance Lines Valid till EOMOverview:
The purple lines serve as support and resistance levels for TSLA stock throughout the month of June. When the price approaches these lines from either the bottom or the top, I will consider taking long or short positions in TSLA stock, depending on the direction of the price movement.
Trading Timeframes
I usually use 30min candlesticks to swing trade options by holding 2-3 days max. Some can also use 3hr or 4hrs to do 2 weeks max swing trades for massive up or down movements.
I post these 1st week of every month and they are valid till the end of the month.
Extra:
I added Blue Lines which are weekly line for June 16th to 20th.
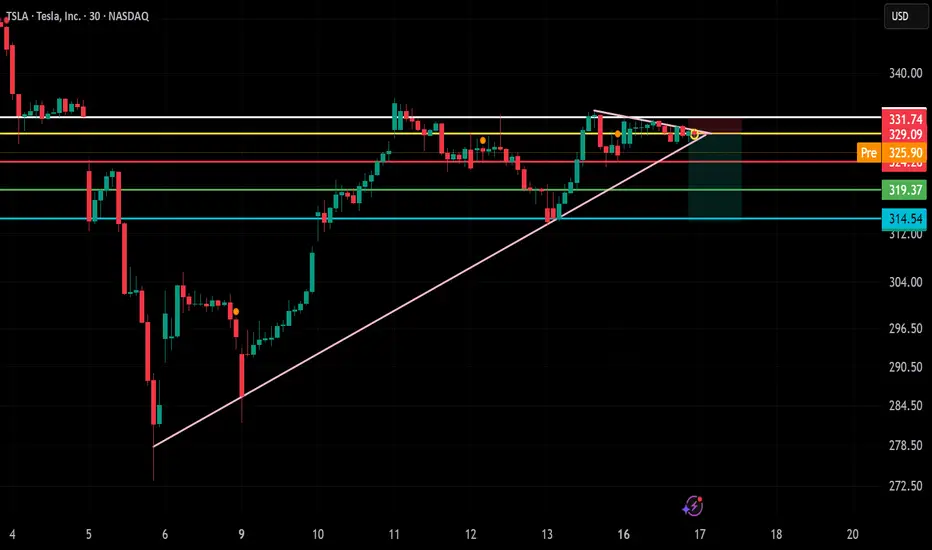
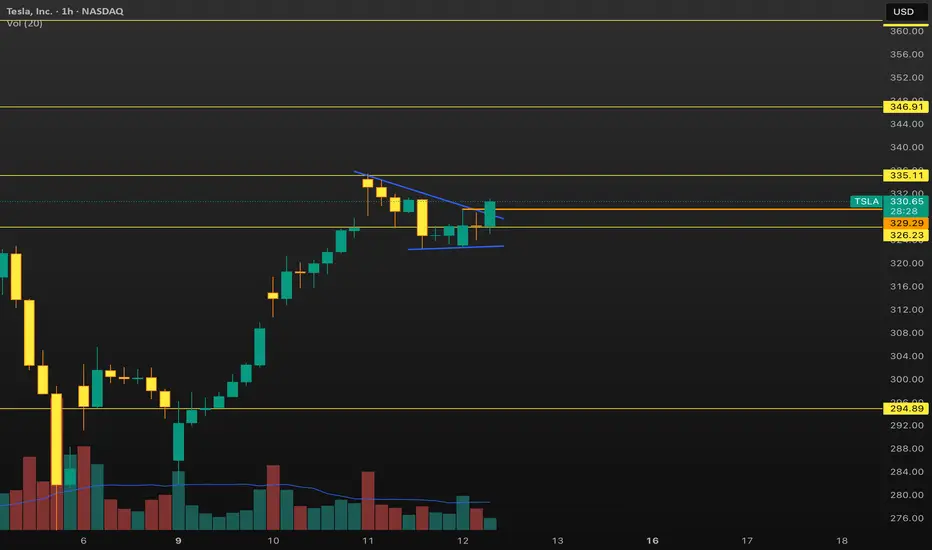
TSLA – Short Trade Setup!📉
🔍 Pattern: Rising wedge breakdown
📍 Entry: ~$329.09 (breakdown candle near resistance)
🎯 Target: $319.37 (first support), $314.54 (major support)
🛑 Stop-loss: $331.74 (above wedge and resistance zone)
✅ Why this setup?
Price is rejecting from wedge top + supply zone
Bearish structure with lower highs forming
Clear breakdown below ascending trendline
Good risk-reward targeting previous demand zones
🕒 Timeframe: 30-minute
📈 Bias: Short / Reversal from resistance
$TSLA | Robotaxi Launch Incoming? - Plan Rock Solid w/ 3 TradesNASDAQ:TSLA
Launch could be as soon as Sunday, June 22. However, Musk has emphasized safety as priority. There is the potential to undercut traditional taxi services at less than $0.20 per mile. Tesla’s government and military contracts are key growth drivers but further clash between Musk and President Trump could cause further volatility in price action. Long-term $271 is a critical price point. There are several ways to play Tesla:
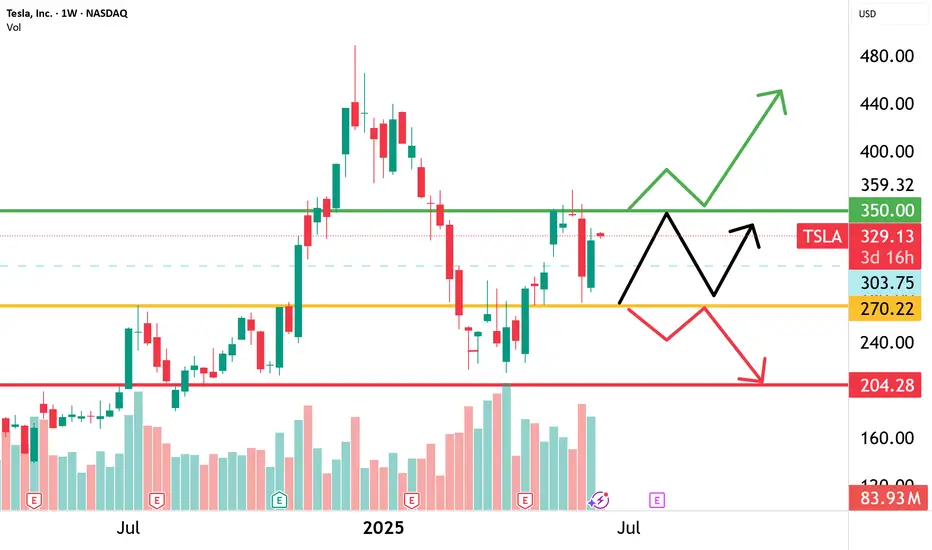
* Range between $270 and $350
* $330 to $400 into price discovery
* Breakdown under $270 targeting $212 and $204
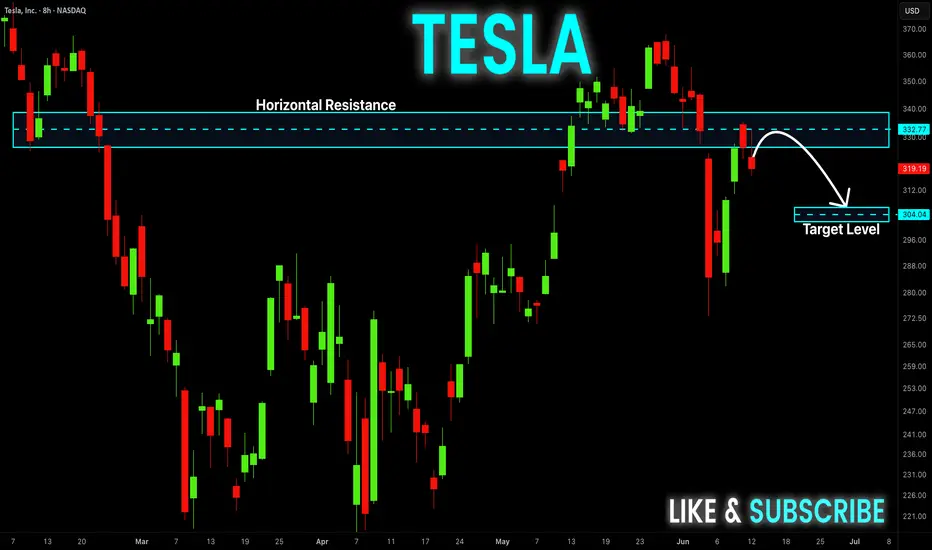
TESLA Will Fall! Sell!
Hello,Traders!
TESLA went up from the
Horizontal support but has
Hit a horizontal resistance
Of 335$ and we are already
Seeing a bearish pullback
So we will be expecting
A further local move down today
Sell!
Comment and subscribe to help us grow!
Check out other forecasts below too!
Disclosure: I am part of Trade Nation's Influencer program and receive a monthly fee for using their TradingView charts in my analysis.
SPY & MegaCap strengthSPY saw a very strong gap up, negating most of the selling from last week.
despite rising tensions in the middle east - investors have shrugged off volatility and bought the initial dip.
This may be proving that "war" is good for stocks.
we observed a very close correlation between the indices and oil today.
As oil reversed higher - markets saw a bit of weakness. As oil fell markets rallied.
TSLA trying to break a 4 hour bullish pattern
META new Smart Glasses release causing a surge.
MSFT new all time high tap
NVDA firm with ripping semiconductors
GOOGL looking strong for continuation
AMZN moving nicely off support
AAPL lagging the mega's but positive

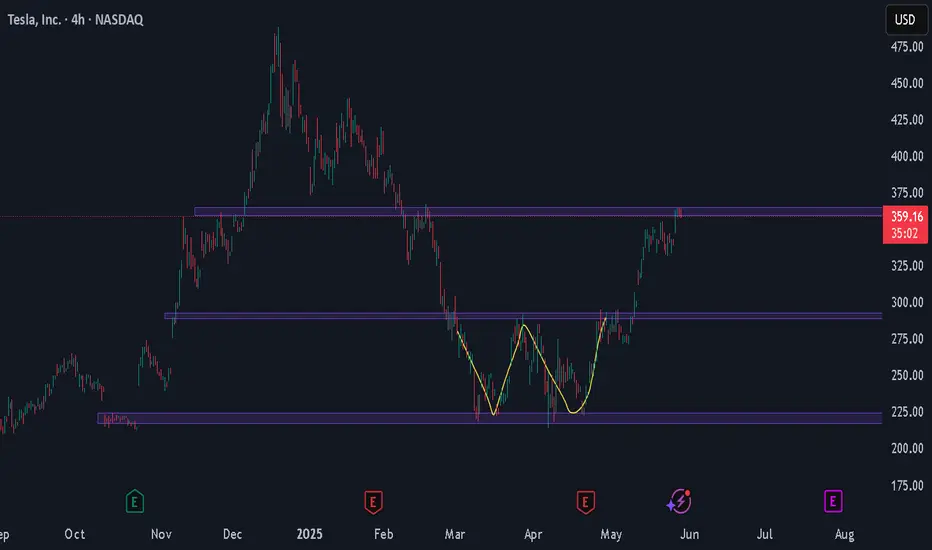
Tesla (TSLA) Share AnalysisHello, Tesla investors!
Tesla stock has gained good momentum recently, breaking the downtrend and rising to $362. This rise has been fueled by investor interest in Elon Musk's full-time return to the company's helm and the upcoming Robotaxi launch.
Technically speaking , the stock has formed a "double bottom" (W) pattern, and its target, $362, has been reached. However, we are now facing strong resistance at this level. If this resistance level is not surpassed with sufficient trading volume, we may see a short-term pullback.
The possibility of a short-term correction increases, especially with the RSI indicator approaching the overbought zone.
The $335 and $290 regions stand out as support levels. These levels are important to watch for possible pullbacks.
In summary , Tesla stock is in an important resistance zone. Breaking through this level with high volume could signal the start of a new uptrend. Otherwise, we may face a short-term correction. Consider these levels and technical indicators when making investment decisions.
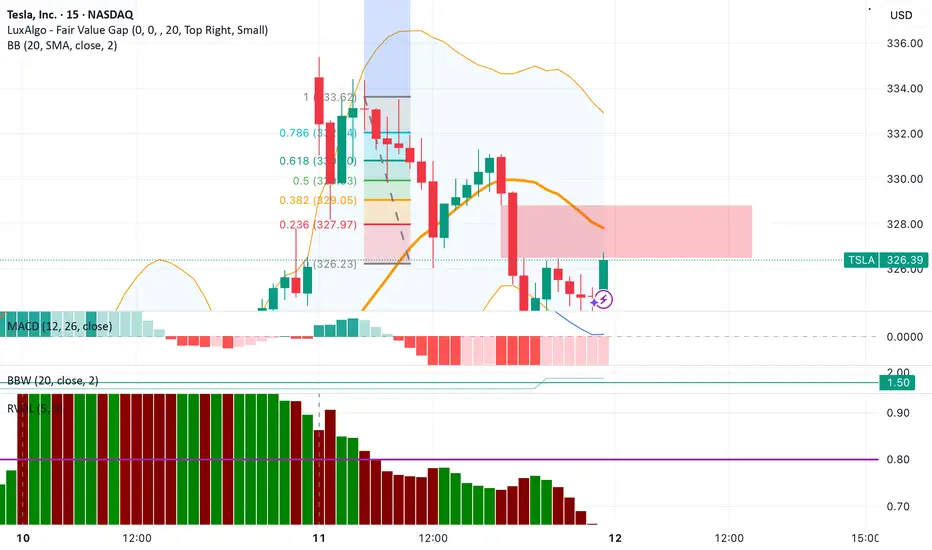
Wednesday Session Debrief (100% Win Rate This Week Thus Far).Early move 1 put @ 935am entry was stacked against a large Bullish FVG so I didn't take it. Call structure came in, but ended up being false positive. As a result i opened a short hedge (01), got chopped up and opened another long and 3 more shorts during 1 hour of choppy price movements as bulls and bears fought over direction to establish control. The final short i opened was when price pushed below $330, exited in very decent profit today considering the unpredictable price action.
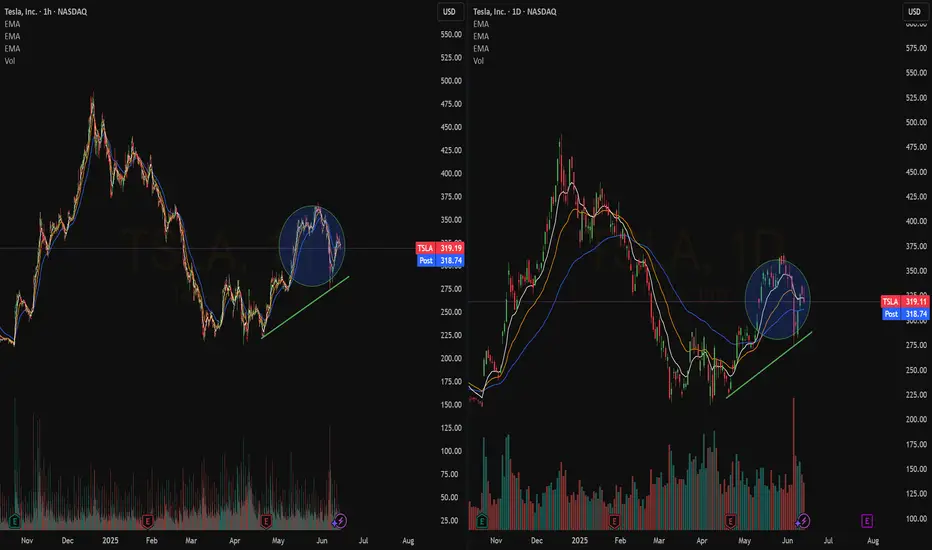
Tesla (TSLA) Shares Rebound After Sharp DropTesla (TSLA) Shares Rebound After Sharp Drop
When analysing the Tesla (TSLA) stock price chart six days ago, on the morning of 5 June, we:
→ highlighted Elon Musk’s critical comments regarding the spending bill promoted by the US President;
→ noted that a potential rift between Musk and Trump could have long-term implications, including for TSLA shares;
→ outlined an ascending channel (marked in blue);
→ suggested that the price might correct from the upper to the lower boundary of the channel.
This scenario played out rather aggressively: later that same day, during the main trading session, Tesla’s share price dropped sharply to the lower boundary of the channel amid a scandal involving Musk and Trump.
However, the lower boundary of the channel predictably acted as support. Yesterday, TSLA shares were among the top five performers in the S&P 500 index (US SPX 500 mini on FXOpen), gaining around 5.6%.
As a result, TSLA stock price climbed back above the psychologically important $300 mark, recovering from the previous week’s sell-off.
Why Are Tesla (TSLA) Shares Rising?
Bullish drivers include:
→ The upcoming launch of Tesla’s robotaxi service, provisionally scheduled for 22 June. Elon Musk has stated he intends to use the service himself.
→ Easing of tensions with the US President. Donald Trump declared that he has no intention of "getting rid of Tesla or Starlink" should he return to the White House.
→ Continued support from Cathie Wood, the prominent asset manager, who once again reaffirmed her confidence in Tesla’s future success.
Technical Analysis of TSLA Chart
Today, TSLA’s share price is hovering near the median line of the previously identified ascending channel – a zone where supply and demand typically seek equilibrium.
Also worth noting is the $320 level: in May, it acted as support, which suggests it may now function as resistance.
Given these factors, it is reasonable to expect that the sharp recovery from the 5 June low may begin to lose momentum, with the price likely to stabilise and form a consolidation range following the recent spike in volatility.
This article represents the opinion of the Companies operating under the FXOpen brand only. It is not to be construed as an offer, solicitation, or recommendation with respect to products and services provided by the Companies operating under the FXOpen brand, nor is it to be considered financial advice.

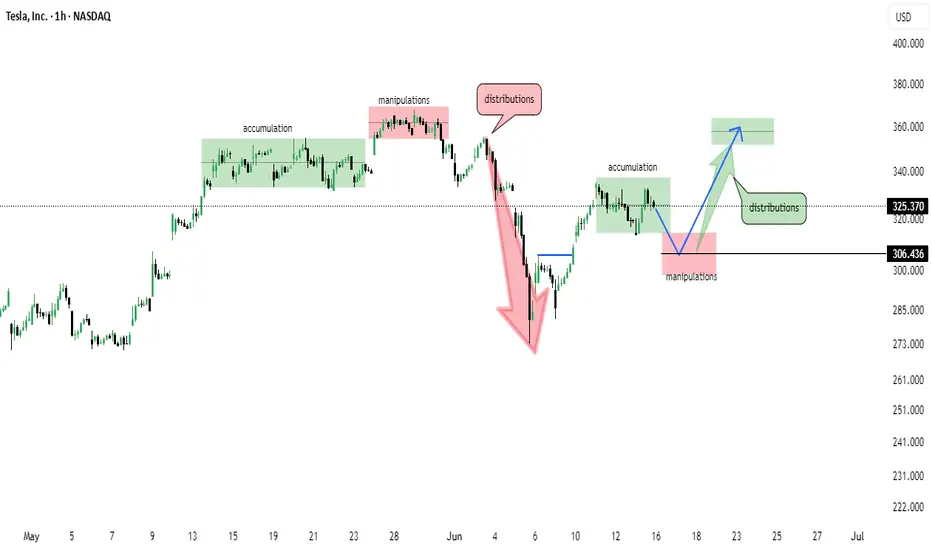
Tesla (TSLA) 1H Chart – Wyckoff Cycle in ActionThis chart reflects a textbook Wyckoff pattern unfolding on TSLA’s 1-hour timeframe:
🔹 Accumulation Phase observed early May
🔹 Followed by Manipulation & Distribution – classic trap before markdown
🔹 Sharp selloff led to another Accumulation zone around $305
🔹 Further manipulation wicks indicate smart money involvement
🔹 Now projecting a move towards $360–$370 distribution zone
📌 Structure breakdown:
Smart Money Accumulation ➡️ Manipulation ➡️ Distribution
Bullish momentum building from $306 support
Eyes on reaction near the marked green distribution box 📦
📅 As of June 15, 2025 – chart aligns with Wyckoff theory and institutional behavior.
TSLA This is good. 329 over and 335 is next resistance. Really good trade if for tomorrow for next week. Given the stock can hold here
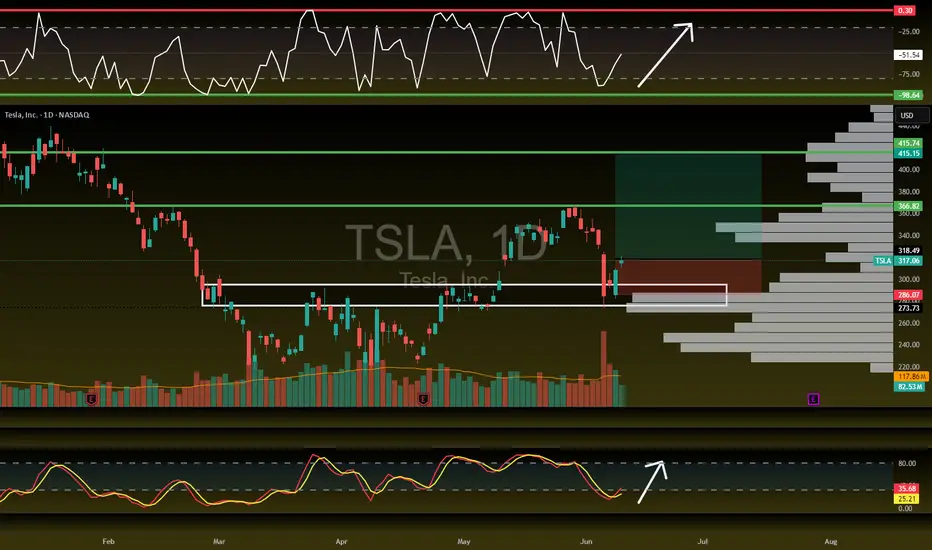
Quick View: $TSLADaily -> Bullish crossover with pullback (and volume)
Hourly-> Consolidated bullish trend
Watching for a #TopSwing Setup on the Daily Chart
TSLA Rebounds from $290 | Buy the Dip or Political Trap?⚠️Just when it looked like Tesla was heading for a breakdown, we got a sharp bounce off the $290 level — and traders are watching closely. But here’s the twist: the move came after a headline-heavy week featuring none other than Trump vs. Elon.
🗞️ According to Politico, tensions flared after Trump made comments suggesting EVs were "doomed without government subsidies." Elon clapped back, defending Tesla’s profitability and independence. This added pressure on TSLA... and then came the bounce. Coincidence? Or whales buying fear?
📥 Entry Zones
• $290 – Strong demand zone, tested and respected
• $275 – Deeper retest if market pulls back
• $240 – Extreme fear level, unlikely unless macro worsens
🎯 Profit Targets
• $305 – Gap-fill magnet
• $320 – Resistance test
• $355+ – If Robotaxi or AI hype returns in force
[GEX] TSLA Breakdown & Options Trade Idea for 39DTELast week, TSLA dropped hard, likely due to political tensions. Let’s not forget — just a month ago, their EVs were showcased at the White House entrance...
In the span of 30 hours, TSLA fell -22% (see red line below), while SPX barely reacted. Why? Because both realized and implied volatility dropped — remember VIX is around 17/18.
This sharp TSLA drop already seemed overdone, which helped fuel the +5% bounce on Friday.Most TSLA options positions are near-term and still show negative sentiment — but further expirations grow increasingly bullish.
🔍 If you use options GEX matrix , you’ll see the bearish hedging flow gradually turns more neutral-to-bullish.
Most cumulative support/resistance zones lie between 250–340, with spot currently just under the chop zone.
🧠 TSLA Trade Idea
It’s been a while since I posted a neutral Iron Condor, but TSLA might be an exception.
Despite last week’s IV spike, call pricing skew still dominates across expirations — as seen in our Options Overlay indicator.This tells me the market doesn’t fear TSLA crashing below 200. So, I’m aiming to capture premium on the July 18th expiry without day trading.
I’m thinking of something simple, well-manageable in either direction.To refine leg placement, I use visual GEX zones.
🐻🔴 Downside:
Strong put support at 250
Gradual support layers up to 280
🐂 🟢 Upside:
Target area: 340–350 for the July 18 expiry.
📅 Closing the Trade:I'll consider closing or adjusting at 21 DTE or when 50% max profit is hit — per TastyTrade’s studies.
🔁 Rolling Plan:IF short delta on one side drops below ~14 and price pulls away, I’ll roll the untested side to collect more credit.
🧑🏫 I’ll likely post trade management live in Discord for educational purposes.
~~~~~~~~~~~~~~~~~~~~~~~~~~~~~~~~~~~
🦋 Bonus Idea: TSLA Broken Wing Butterfly
If you think TSLA has more downside, a Put Broken Wing Butterfly — like the one shown in my previous YT video — is also a great way to structure this trade using the same GEX levels.
There’s no single way to use Gamma Exposure — it’s the most actionable hedging signal we have. Combine it with your knowledge of strategies and you can trade almost any scenario.
One thing’s for sure — this market moves faster than ever.A single day of internal conflict wiped -22% off TSLA…The next morning, the market already moved on, so as always:
Trade Safe Out There!

$TSLA is making moves! 30% Upside Swing🚀 NASDAQ:TSLA is making moves!
The H5_S is almost there—just waiting for that green light 🟢 to lock in the entry!
🔥 Eyeing July 18th $325 Calls if we get the confirmation. Let’s see how this unfolds!
Not Financial Advice
Of course the target is 420New range. Momentum is in. Bull market back on.
Just following target's not trading advise.