Resistance becomes support, BCH ROCKET BLAST IMMINENTThis is not a financially advicicle it might be an icicle But BCH is bitcoin and bitcoin do go up sometimes
BCHBTC trade ideas
BCHBTC is wave 2 in or going lower?BCHBTC is wave 2 in or going lower. so far looks like a double bottom.

Bitcoin Cash's Massive Falling Wedge (8-9x ROI Potential)Looking at the daily chart for BCH, you can see the massive falling wedge that goes back to the beginning of BCH back in August of 2017. Using the wedge heights to predict our target price, we have the potential for a 8-9x gain here if either target is hit. Most exchanges have converted to a BCHABC chart which lacks all of BCH's previous price action history, so this may go unseen by many. BCH is almost 20x off its all-time high and it is no stranger to massive pumps. If the price can break overhead resistance, just buy and hodl.
I am going to BUY ON THE BREAKOUT. Why? Well this resistance has rejected the price 5 times before minus the Nov 2017 pump. The MACD is a starting to capitulate at the zero line. If the price can't break through resistance, it may send the price down (possibly way down). I am secretly hoping for this so the gains are even greater upon breakout. Let's see what happens!

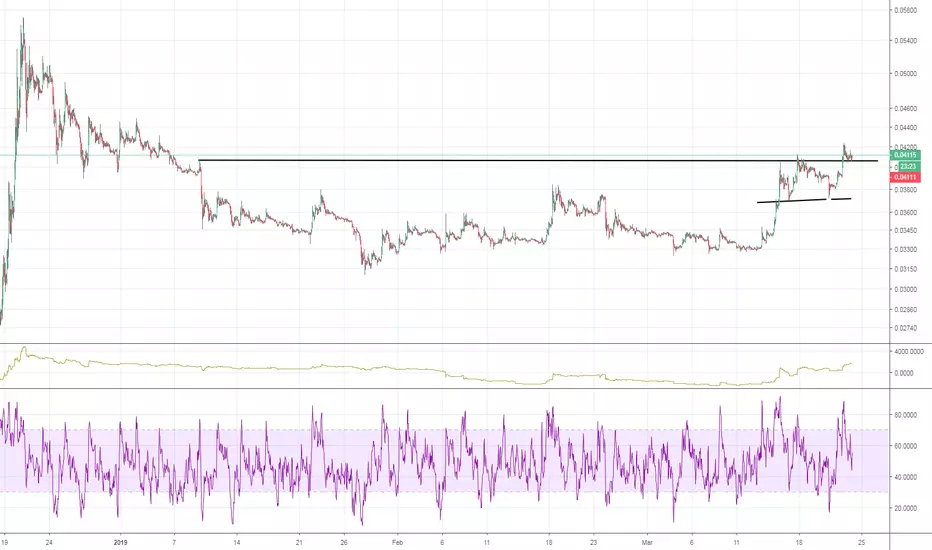
Bchbtc scenariosHi,
Looking that Bch stay in the accumulation zone, 3 bull scenarios. Next hours will definitely tell us more. Still possible little drop in the 35-31 zone.
If a price will fall bellow next support 25 and 23 on double bottom, bellow that can be really bearish


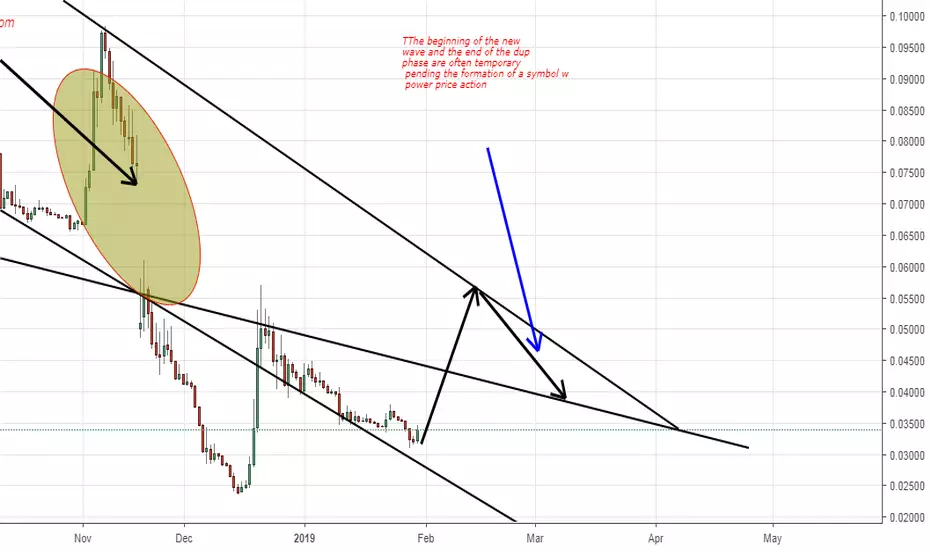
The beginning of the new wave The beginning of the new wave and the end of the dup phase are often temporary pending the formation of a symbol w for good price action
EW ANALYSIS: Bitcoin Cash Ready To Fly?!Hello Crypto traders!
Let's talk about Bitcoin Cash!
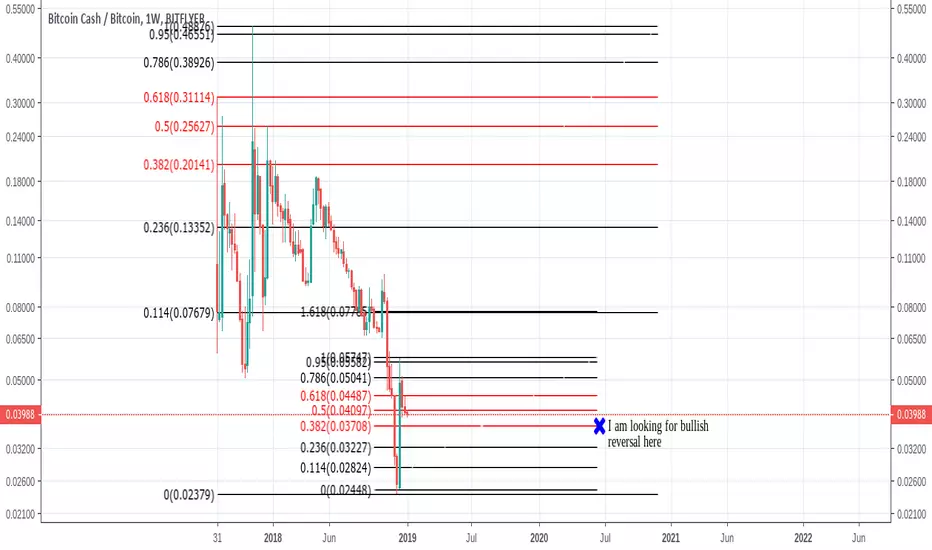
Bitcoin Cash was one of the first in which a rise occurred at the end of December in 2018. And now, it could be the first one that can complete a correction since we see both, BCHUSD and BCHBTC at important support area between 61,8% and 78,6% Fibonacci retracement!
But, the most important from EW perspective is that we can clearly see a three-wave a-b-c corrective structure from highs, where wave "a" is a leading diagonal, wave "b" is a triangle and motive wave "c" ended by five waves!
That said, we really like Bitcoin Cash for a potential bullish turn here, but we need confirmations, so if we see a sharp bounce or a five-wave rally away from current support area, followed by a break above previous wave "b" (BCHUSD above 167 and BCHBTC above 0.043), only then we can confirm a completed correction and we can start considering bullish scenarios!
Invalidation levels remain at December 2018 lows!
Disclosure: Please be informed that information we provide is NOT a trading recommendation or investment advice. All of our work is for educational purposes only.


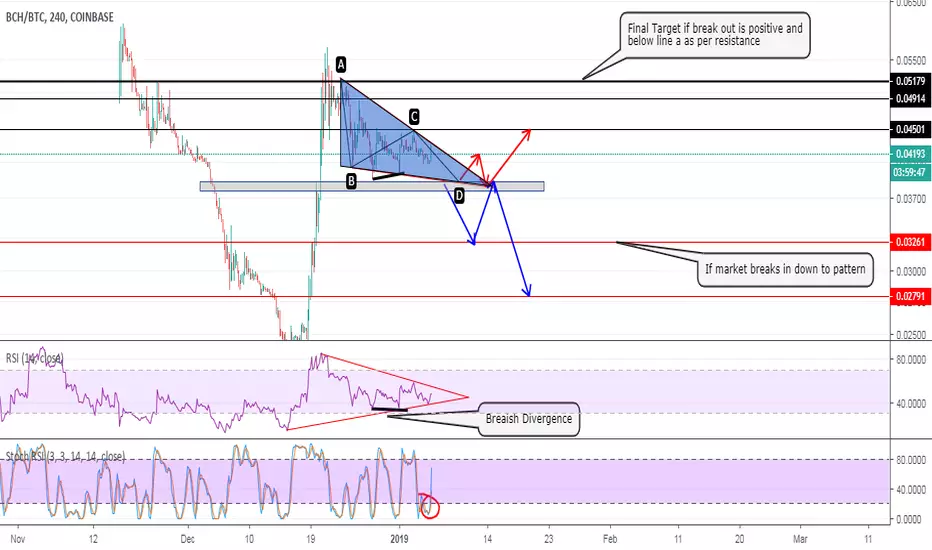
BCHBTC - technical Analysis - market move - Price?Hello guys, we had analyse BCH/BTC market and found falling wedge pattern and had drawn target price as per pattren breakout and got small bearish divergence and market may move till D-wave. As we know falling wedge is a bullish pattern but market condition is not good but you can trade according to per market breakout and can book decent profit.
Potential Falling wedge in play?Still in the descending channel, volume looks really low.
Last UCTS signals from this chart were massive, 100-60-22%.
I'm looking at a potential falling wedge forming since december 21.
I'll set up alerts around this & see how evolves..
My target of 0.03sats is still in play

Descending channel, looks to retrace a little more...Sell signal in the UCTS script. Descending channel in play and volume looks really low. Below EMA50.
I expect price to retrace to ~0.03sats. MACD bearish and RSI falling.
For now put alerts and wait for new information

BCHBTC Bull Descending Triangle 1DBCHBTC formed Bullish Descending Triangle (Flag) on 1D chart. BCH often breaks out violently, or just go sideways if no buyers show up - this is also an possibility. Also, the volume is currently low and if it doesn't increase, I doubt we will go higher.

Bitcoin Ethereum Bitcoin Cash Litecoin 4H 1/9Bitcoin Ethereum Bitcoin Cash Litecoin 4H, Everything is being bought in 3x the market volumes in OTC trades, large institutions are either buying or looking to buy and hedge the market with crypto.
Shorting here is a mistake, any open shorts are in danger.
Won't take much for this market to regain buyers, the next move will be akin to 2017.

BCH/BTC Bottom? It is possible. Such a heavy bullish wick from what could be the bottom with nice levels to bounce bullish on. It is possible. Keep an eye out!
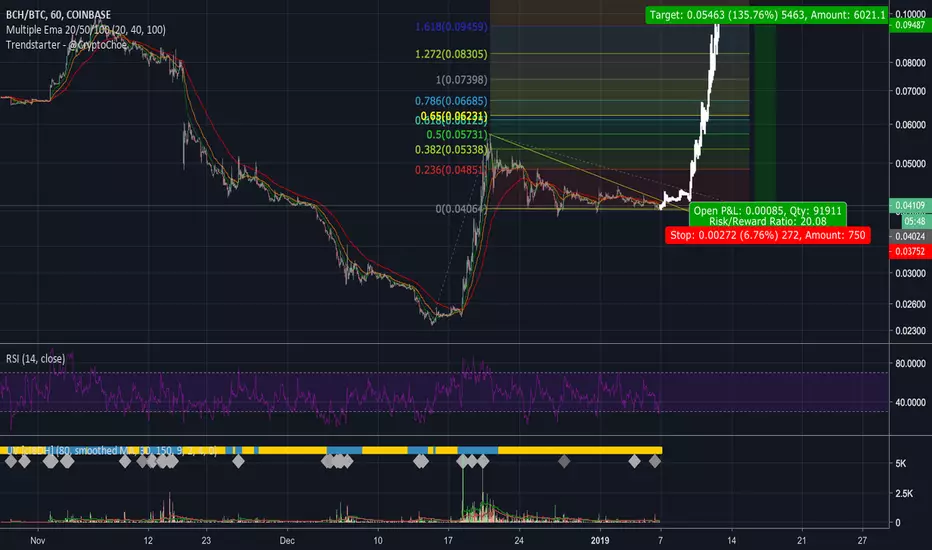
BCH Bull Pennant Breakout (20 Risk to Reward Long)BCH is currently near the end of a large bull pennant. If you take the previous upswing from last month and mirror it over to the current price, you can actually see a very interesting observation.
Taking the fib extension tool, you can see how the mirrored move up matches up with significant fib levels. The move up ends at the 1.618 extension of wave 1 (or A), which coindentially happens to be a double top from before the crash. Finally, this completes the price gap from Nov 20.
By longing at current prices with a stop below 0.0375, you have a 20 R:R trade. Alternatively, you can long the retest of the downtrend line for lower risk.
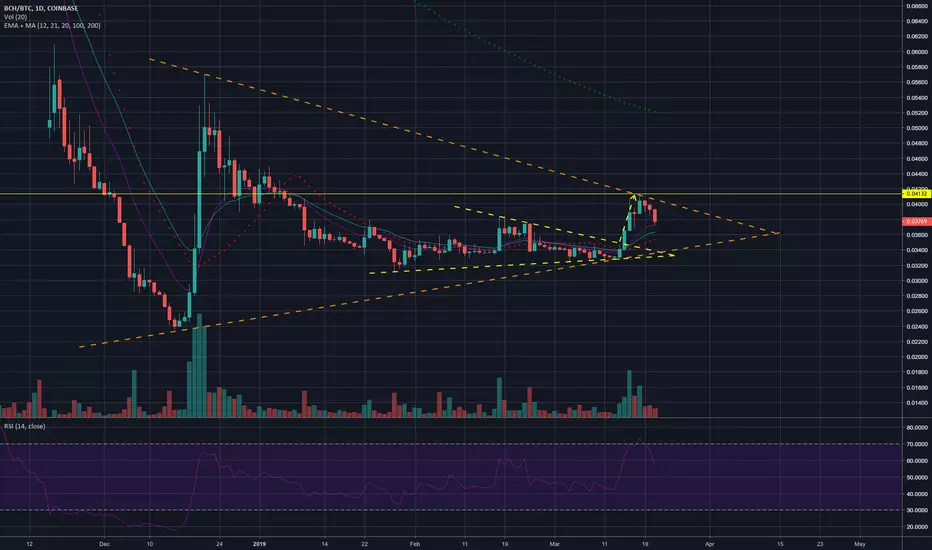
$BCH $BTC - Many signs for a bonus, but with roadblocks The ratio got grounded to the dust after the fork to its lowest ever at 0.25. The recent rally was an indication of how undervalued it was.
After a move like that,
1) its normal to have bounce to 0.5-0.618 Fib level of the entire drop
2) ABC waves are normal in a recovery during an downtrend. A & B appear to be done
3) Bull flag can be seen with a target flag pole at the Fib levels
BUT,
1) 50 Day EMA (Orange) is major resistance and then 100 Day EMA as well
2) In September, a similar setup failed, where price crossed 50 Day EMA (green arrow), fell short of 100 Day EMA (red arrow) and then price got rejected again at the 50 Day EMA (red arrow). This can happen again
3) In ABC, the C can fall short of A or turn around at same level or cross it
A tight Stop Loss just below 0.04 will help to play with good Risk:Reward ratio.
Take Care. All the best.

BCH Continuation of UptrendThings to note
-> Forming a bull flag on the daily timeframe which is a uptrend continuation pattern.
-> Has retraced more than 50% already. I would like to see it retrace to 61.8% before continuing with the uptrend.
-> Forming a falling wedge on smaller timeframes.
-> Has tested HTL on daily timeframe once
-> Decent volume
-> RRR is pretty good considering the next target is a bit far
How am I trading this?
Keeping Low Leverage as this is a long term trade for me.
I'm spacing out my entries with last one being at 350 followed by a tight SL of course.
What are my indicators saying?
FOMO 4hr and Daily are sell signals which indicates that we could be heading down temporarily.
To play it safer by risking not having a LONG position if it runs here, you could enter around 390 or lower
Targets
465
530
590
648

BCH LONG, Breakout Incoming, There is a good move to playDuring November and the FORK WAR, BCH has crashed hard and bottomed at 86$ from 640$!
It is 7th and half of the precent value.
The descending trendline is about to break and we can make a good trade on this.

Buy the breakout or the bounce after the breakout.BCH is about to breakout
If it happens you can buy it and ride it until it fill the gap.
Place your stop at the upside trend line.
BCH lost a lot of value during the Fork battle, it can recover well.
There is money to be made or bitcoin ( as you want :) )


#BCH... Set alerts and wait !#BCH I see a descending channel in Bitcoin cash daily chart since November.
Right now under a sell signal from the UCTS and volume decreasing.
Falling into 0.023 sats seems a little extreme but 0.03sats could be possible if there is no signs of reversal...
Set alerts and wait
