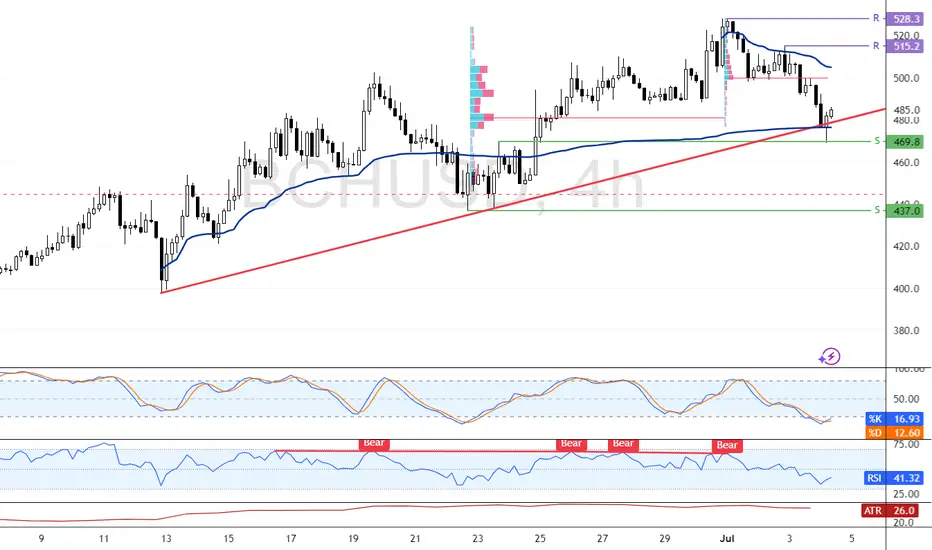
Bitcoin Cash Rebounds from VWAP-Backed SupportBitcoin Cash eased from $528.3 to $469.8, finding support backed by the anchored VWAP and ascending trendline. BCH trades at $485.0, with Stochastic at 17.0 signaling oversold conditions.
A bullish wave may emerge if $469.8 holds, targeting $500.0 and $515.2.
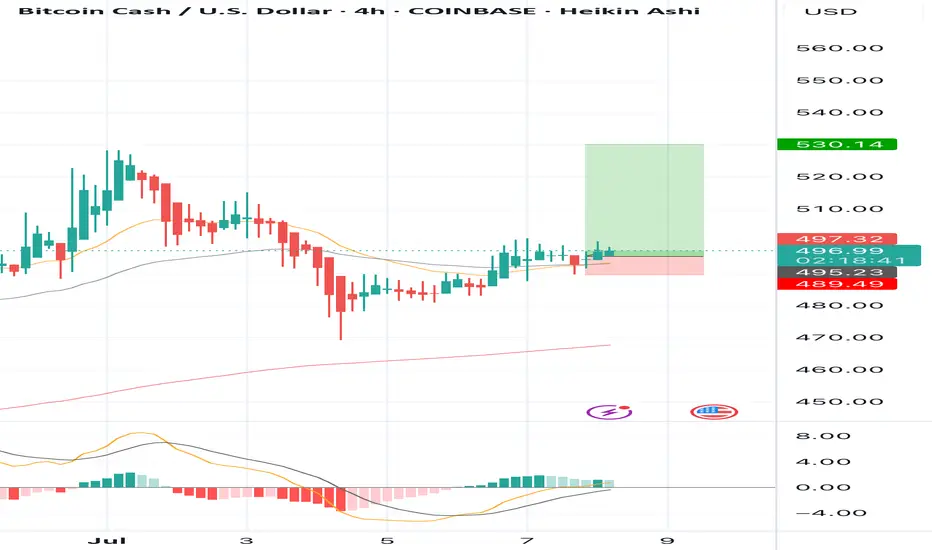
BUY BCHUSD now for a four hour time frame bullish trend continuBUY BCHUSD now for a four hour time frame bullish trend continuation ...............
STOP LOSS: 489.49
This buy trade setup is based on hidden bullish divergence trend continuation trading pattern ...
Always remember, the trend is your friend, so whenever you can get a signal that the trend will
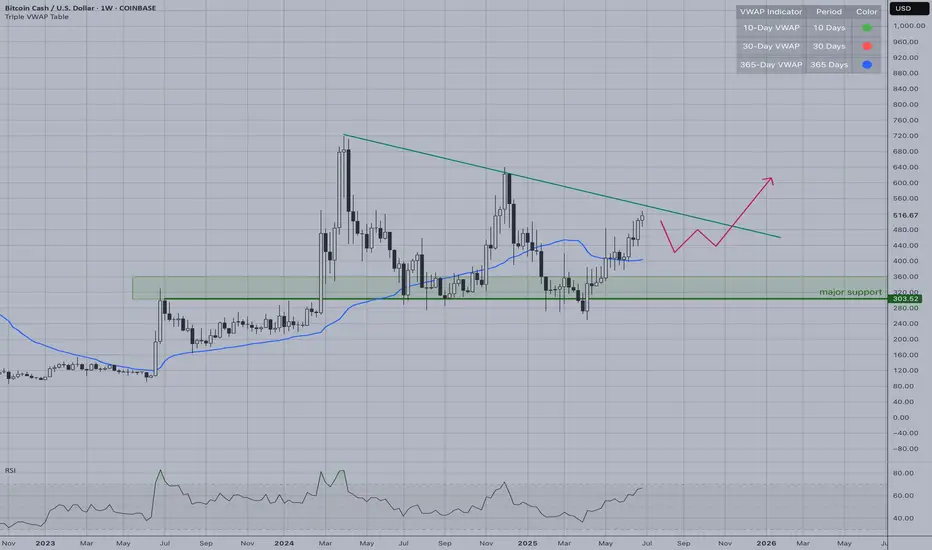
BCH | Long-Term Bullish StructureBitcoin Cash presents an attractive long-term bullish structure with multiple technical confluences suggesting higher prices ahead. The patient approach of waiting for the VWAP retest provides optimal entry conditions for this long-term bullish thesis, rather than chasing current elevated prices.
T
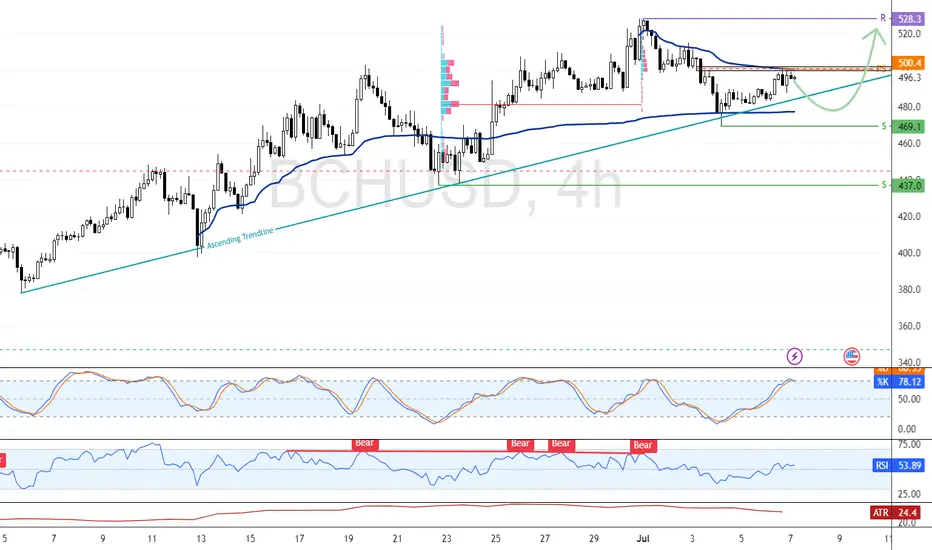
Bitcoin Cash Tests $500.4 Resistance After Strong ReboundFenzoFx—Bitcoin Cash rebounded from $469.1, a demand zone backed by the anchored VWAP and ascending trendline. BCH is now testing resistance at $500.4, supported by volume profile and anchored VWAP.
Bullish Scenario : While the bullish trend remains intact above $469.1, consolidation toward $480.
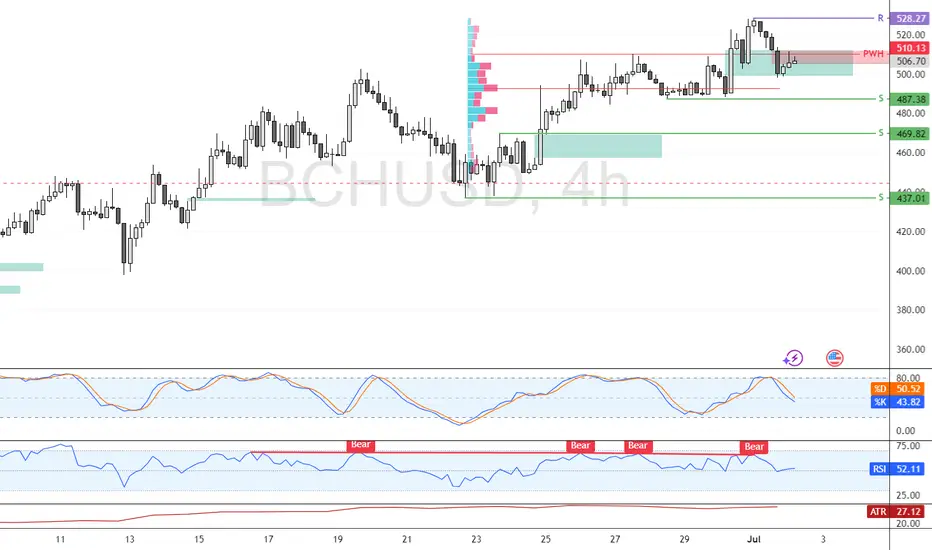
Bitcoin Cash Slides as Bearish Signals StrengthenBitcoin Cash fell below last week’s low and now trades around $506.8. Technical indicators show bearish signals, with RSI diverging and the Stochastic trending lower.
BCH/USD may retest support at $487.3; if broken, it could slide to $469.8. The bearish outlook is invalidated if price closes above
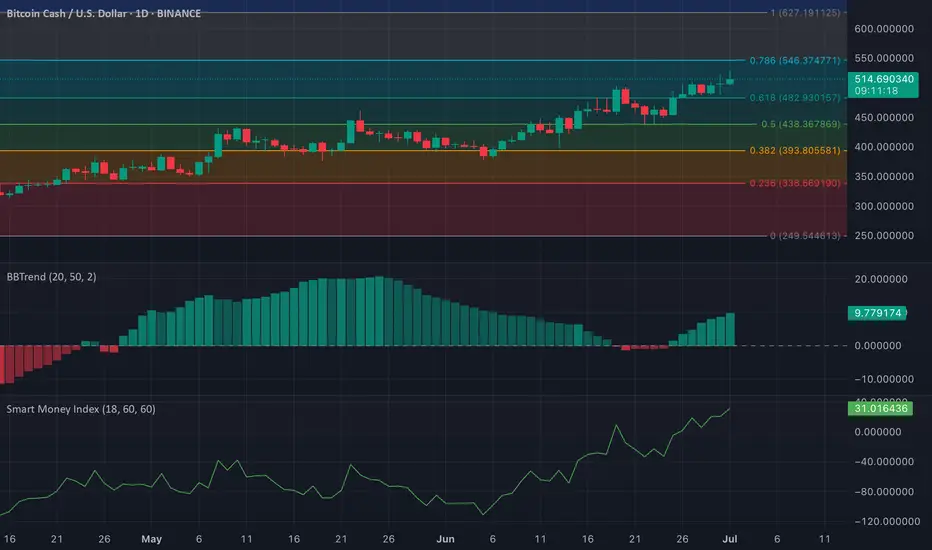
BCH: Bullish Momentum Builds as BBTrend and SMI Flash GreenBCH is showing signs of strengthening bullish momentum. The Bollinger Band Trend (BBTrend) is pointing to increasing volatility in favor of the bulls.
On the daily chart, the BBTrend’s green histogram bars have been growing steadily over the past few sessions, a signal of rising buying pressure.
F
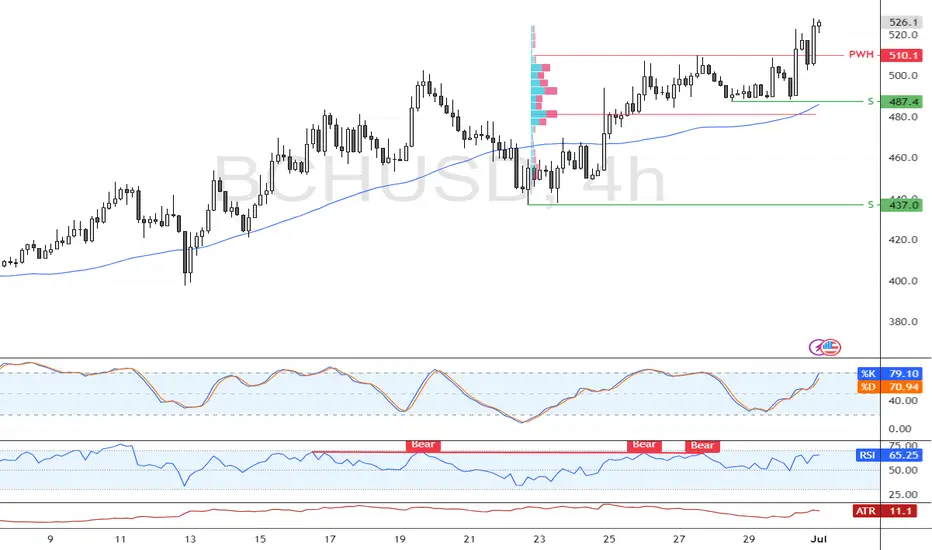
BCH Faces Pullback RiskFenzoFx—Bitcoin Cash broke above last week’s high at $510.0 and is stabilizing near $525.0. However, the daily Stochastic is overbought, suggesting a pullback toward the 50-SMA at $487.4.
A rebound from there could resume the uptrend, while a close below $487.4 may send BCH toward $437.0.
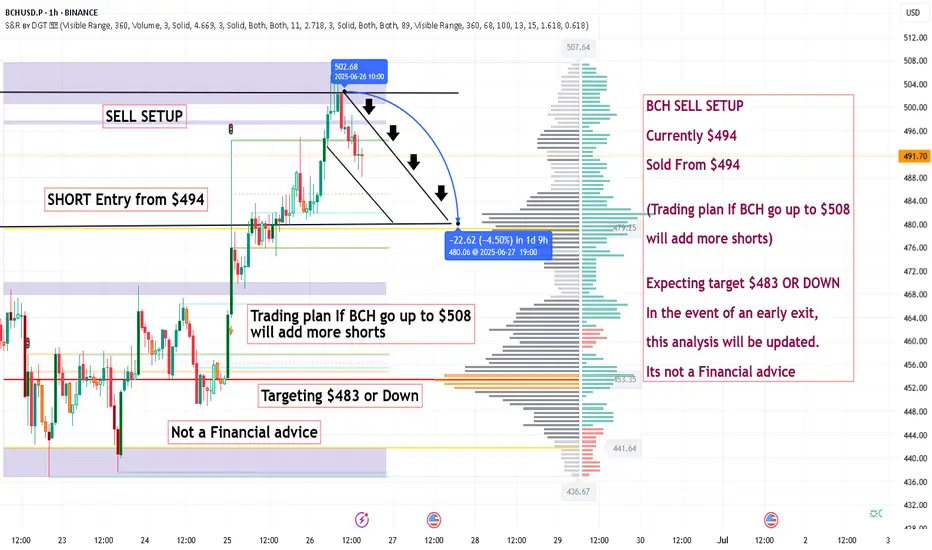
BCH SELL SETUP ,Sold From $494BCH SELL SETUP
Currently $494
Sold From $494
(Trading plan If BCH go up to $508
will add more shorts)
Expecting target $483 OR DOWN
In the event of an early exit,
this analysis will be updated.
Its not a Financial advice
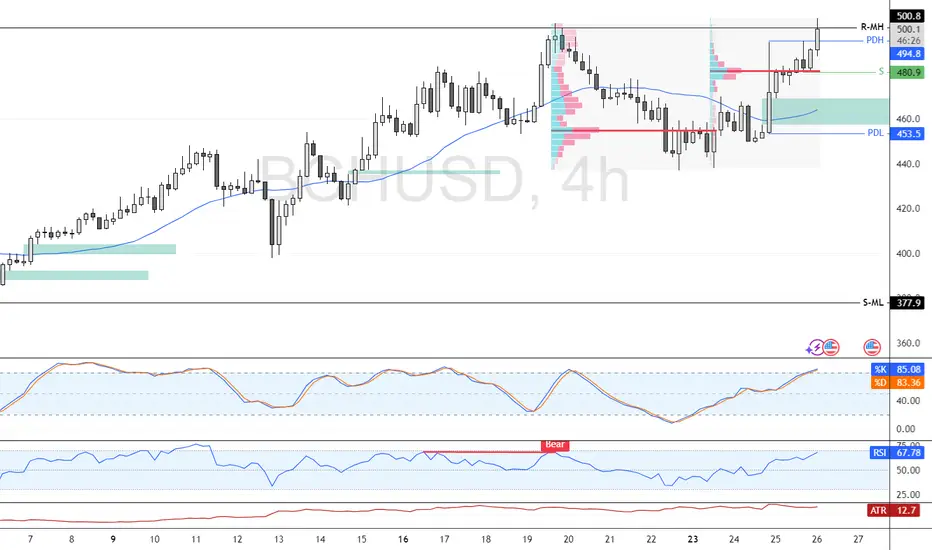
BCH Faces Resistance at $500.0 Amid Bearish SignalsBitcoin Cash rose to $500.0, a resistance zone backed by the June 19 high. Stochastic reads 85.0, indicating short-term overpricing.
The 4-hour chart shows a possible double top pattern, suggesting consolidation. If BCH stays below $500.8, it could target $494.8 and, if selling continues, drop to
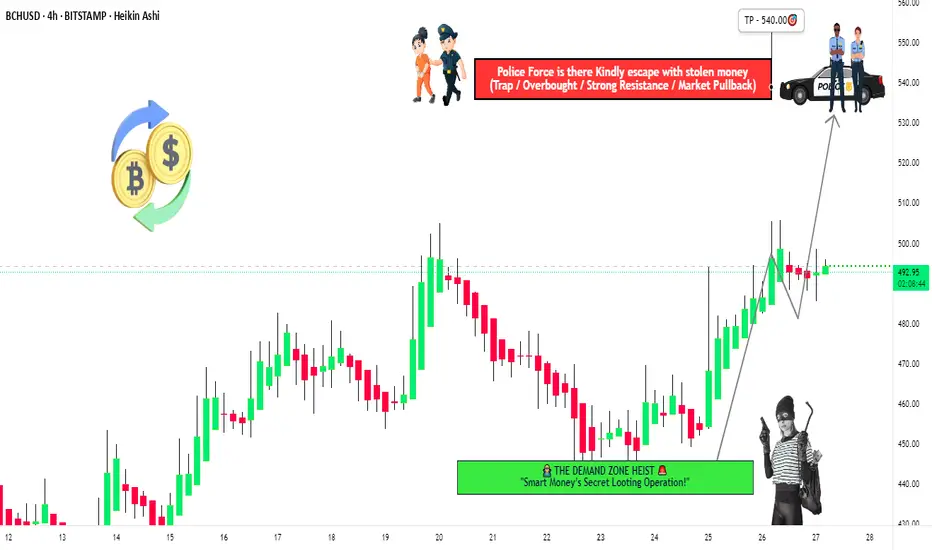
"BCH/USD Heist Mode: Enter Long, Exit Before Bears Strike!🚨 BCH/USD HEIST ALERT: Bullish Loot & Escape Plan! (Thief Trading Style) 🚨
🌟 Greetings, Market Bandits & Profit Pirates! 🌟
(Hola! Oi! Bonjour! Hallo! Marhaba!)
🔥 Mission Briefing:
Based on Thief Trading tactics (TA + FA), we’re plotting a bullish heist on BCH/USD. Time to swipe the loot & escape b
See all ideas
Summarizing what the indicators are suggesting.
Oscillators
Neutral
SellBuy
Strong sellStrong buy
Strong sellSellNeutralBuyStrong buy
Oscillators
Neutral
SellBuy
Strong sellStrong buy
Strong sellSellNeutralBuyStrong buy
Summary
Neutral
SellBuy
Strong sellStrong buy
Strong sellSellNeutralBuyStrong buy
Summary
Neutral
SellBuy
Strong sellStrong buy
Strong sellSellNeutralBuyStrong buy
Summary
Neutral
SellBuy
Strong sellStrong buy
Strong sellSellNeutralBuyStrong buy
Moving Averages
Neutral
SellBuy
Strong sellStrong buy
Strong sellSellNeutralBuyStrong buy
Moving Averages
Neutral
SellBuy
Strong sellStrong buy
Strong sellSellNeutralBuyStrong buy
Displays a symbol's price movements over previous years to identify recurring trends.
Curated watchlists where BCHUSD.P is featured.

Bitcoin variants: Hard forking the OG
8 No. of Symbols

Gen 2: Crypto is here to stay - and it's brought some friends…
19 No. of Symbols
Proof of Work: Embracing the crunch
27 No. of Symbols
See all sparks