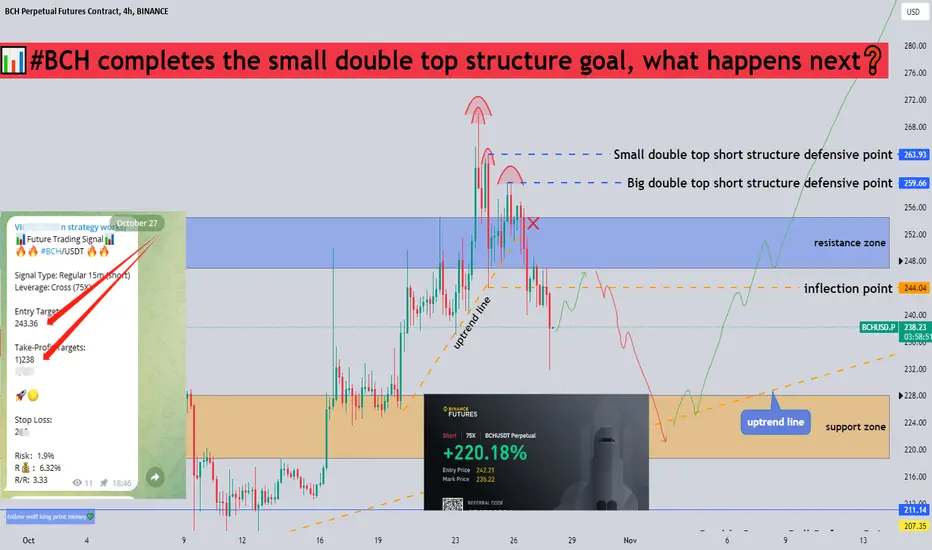
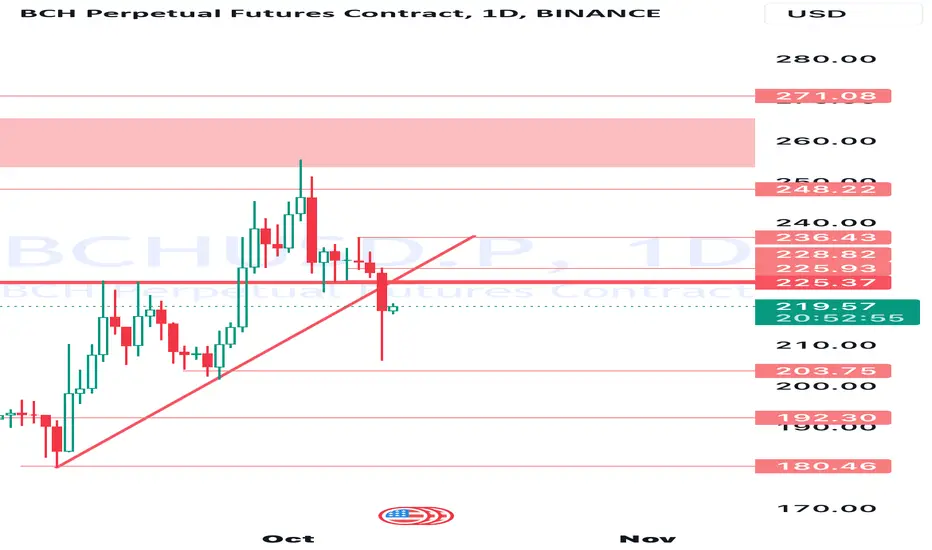
📊#BCH completes the small double top structure goal, what next❓🧠Today we fell below the uptrend line, which means that we will most likely continue our short position. In the afternoon, we completely broke away from the resistance zone and adjusted a descending triangle model within a small time level (generally we fall according to this model ), so we laid out market traps based on certain signals and logic. In the end, we successfully hunted for a return rate of 220%+💥, which also meant that the goals of the small double top structure were all achieved. The market quickly rebounded after we reduced our holdings. We may then continue lower following a large double top structure.📉
⚠️Note that although we are moving lower, we are still bullish in the broader cycle. If the short defense points of the two double top structures above are broken, it means that the short structure is destroyed, and we will continue to move higher.📈
Let's see👀
🤜If you like my analysis, please like 💖and share it💬
💌If you can't grasp the rhythm of futures trading, please follow Wolf king footsteps and print money together.💰🍻
💕 Follow me so you don't miss out on any signals and analyze 💯
BCHUSD.P trade ideas
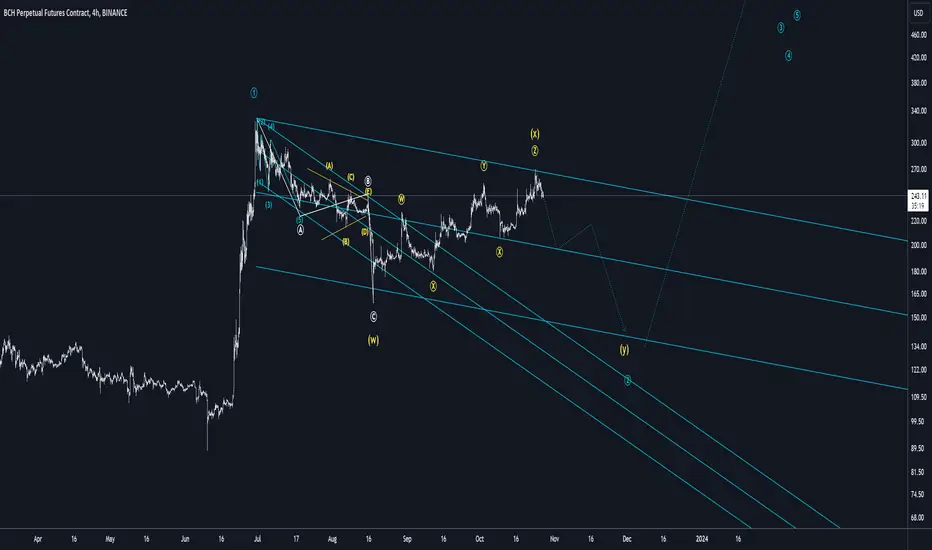
Bitcoin cashEyeing 333 pattern or a double zig zag in Elliottwave language.
This first drop towards (W) just doesnt seem to be enough for this thing to pump from right here.
Reason why i say that is because the current price action from (w) doesnt look like a motive wave. Its more overlapping and corrective. So , waiting for lower low on this one before i touch it.
Can Bitcoin Cash Make To $300 Before BTC Tops $40K?Bitcoin's Influence: The BCH price is influenced by Bitcoin's performance and the anticipation of a Bitcoin Spot ETF.
Current Status: BCH is trading at $243.48, experiencing an intraday fall of 1.56%.
Psychological Barrier: $250 remains a significant resistance level for BCH.
Technical Indicators - RSI: The RSI has hit the overbought boundary and is now reflecting downward, indicating reduced buying pressure.
Technical Indicators - EMA: Both the 50-day and 200-day EMAs are moving sideways, suggesting a stable trend.
Recent Performance: BCH saw a 22% jump to $269 but has since fallen back under $250.
Market Sentiment: The overall sentiment is cautiously optimistic, fueled by potential positive developments in the Bitcoin Spot ETF.
Potential Targets: If BCH breaks the $250 resistance, it could aim for the $300 mark.
Downside Risk: A fall below $215 or the 50-day EMA could lead to a drop to $200.
Inverted Head and Shoulder: BCH struggles to sustain this bullish pattern, indicating a need for a strong catalyst.
Market Recovery: BCH has benefited from the broader market recovery but needs to sustain the momentum.
2023 Outlook: The BCH price prediction suggests a potential bull run to $300 in 2023 if market conditions remain favorable.

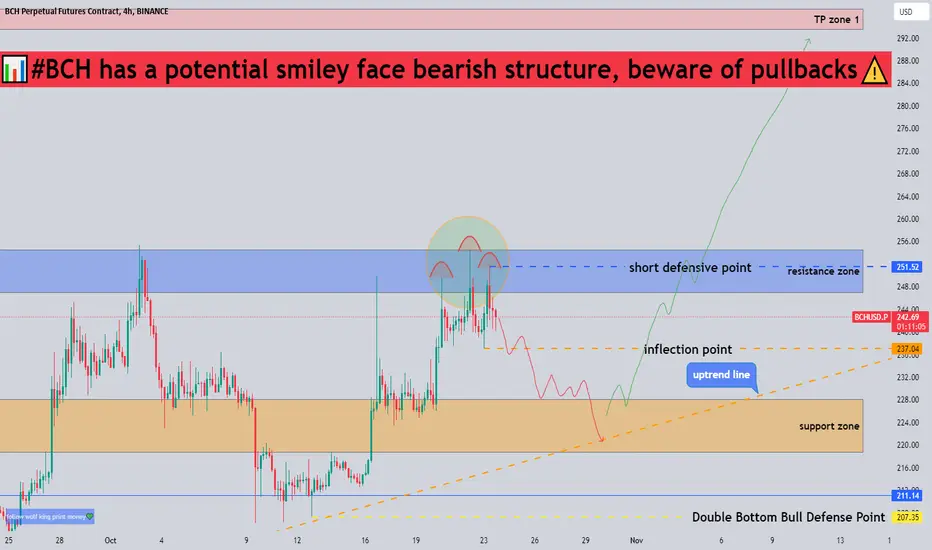
📊BCH has a potential smiley face bearish structure, beware of📉➡️First of all, our general direction is bullish, but a potential smiley face bearish structure has formed in the resistance zone, and there is a certain contradiction.
🧠We don’t need to guess which way the market will go, we just need to wait for a clear signal: if we choose to continue to break through the short defense point, then the bulls will continue. If we break below the inflection point, then the smiley face bearish structure will hold and we will enter a phased correction.☕️
Let's see👀
🔔If you think my analysis is useful to you, please don't forget to "like" me.✔️💯💪🍻
💕 Follow me so you don't miss out on any signals and analyze 💯
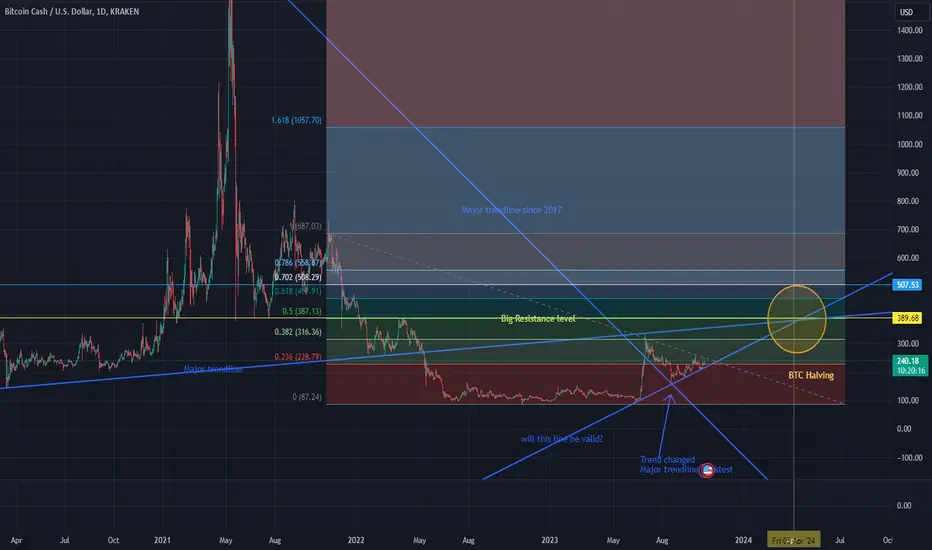
BCHUSDHigh chance this can be the main resistance and support level for BCH.
The question is how long that chart will be valid?
Thoughts?
BCH Bitcoin Cash Possible Breakout Of Ascending TriangleBCHUSD / BitcoinCash forming an ascending triangle pattern. Target around $326.00 based on vertical triangle measurement, which coincides with the top set back in June.

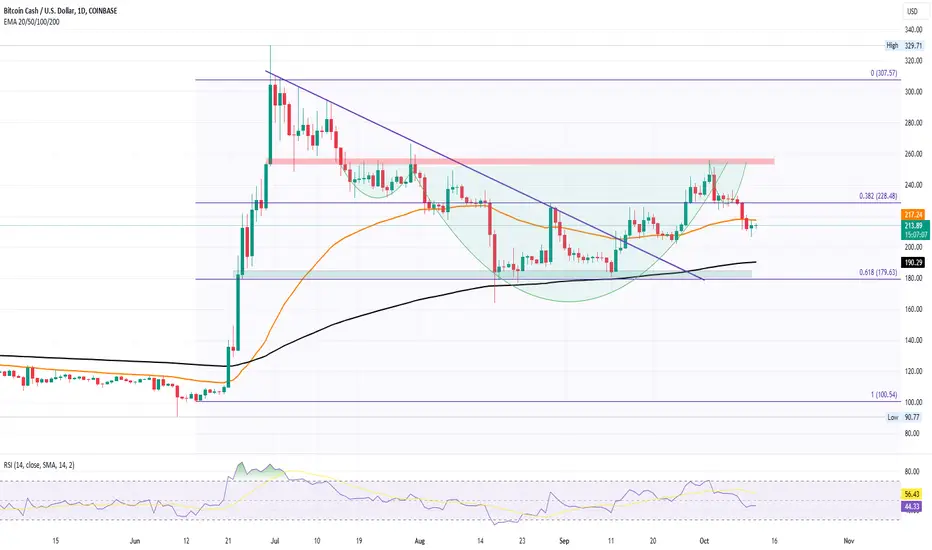
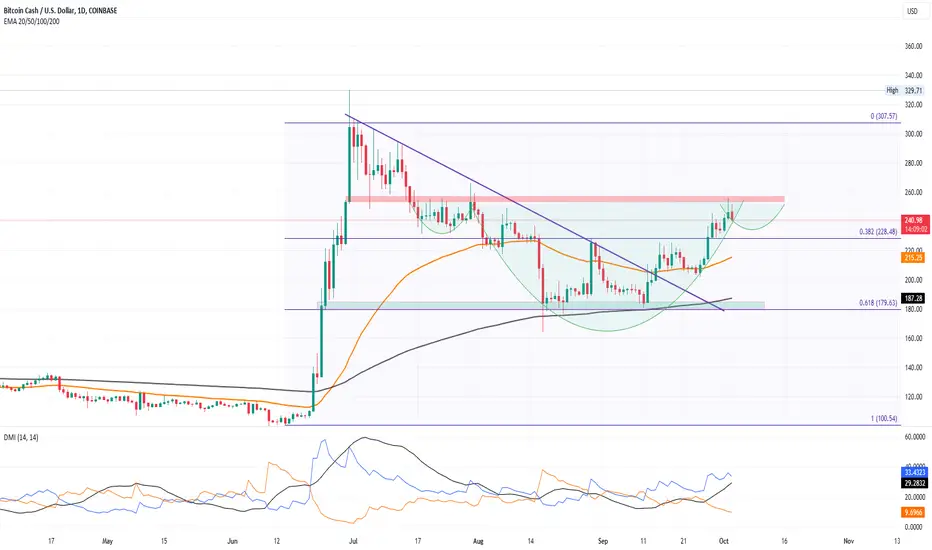
Bitcoin Cash BCHUSDT Price Analysis 8hBitcoin Cash BINANCE:BCHUSDT is on the cusp of a significant breakout, currently consolidating within a well-defined cup and handle pattern. A breach from this pattern signifies a potential upward surge towards robust resistance zones around $280 and $300. With current price at $230.
Pattern Analysis: Bitcoin Cash is consolidating within a cup and handle pattern, a classic bullish formation indicating a potential uptrend continuation.
Breakout Anticipation: A breakout above the pattern's upper boundary is expected to trigger a substantial upward movement, targeting resistance levels near $280 and $300.
Support Zones: Vital support zones lie at $218-220 and $200, acting as crucial levels to watch during price retracements.
Bullish Sign: Multiple bullish Falling Wedges within the cup and handle pattern highlight a positive market sentiment, suggesting a potential rise in BCH value.
Stay vigilant for the imminent breakout, as it could mark the beginning of a significant uptrend in Bitcoin Cash's price. We should closely monitor the support levels and consider entry points cautiously based on the pattern's confirmation.
Happy trading!

Bitcoin Cash Ready To Surpass $300Potential Turnaround: BCH price action hints at a possible breakout above the $250 mark.
50-day EMA: The price reverts from the 50-day EMA, indicating demand at lower levels.
Psychological Mark: A breakout at $250 could push BCH beyond the $300 mark.
Year-to-Date Growth: BCH has shown a remarkable 135% growth in 2023.
Uptober Season: Ongoing season and Blackrock ETF review could spark a new rally.
Support Zone: Recent pullback led to a sharp correction to the $180 support zone.
Bullish Pattern: An inverted head-and-shoulder pattern is forming with a neckline at $250.
Technical Indicators: MACD shows a positive crossover, and EMAs are in a bullish alignment.
Recent Growth: A 7.29% growth last night led to a bullish engulfing candle.
Optimistic Scenario: A breakout rally could reach as high as $329 by the end of October 2023.
Pessimistic Scenario: Failure to sustain above the 50-day EMA could lead to a drop to the $180 zone.
Market Sentiments: Overall market sentiments are improving, increasing the likelihood of a bullish breakout.

✴️ Bitcoin Cash | New AllTime High? New Update, New View, New...Here, let's have a closer look:
Bitcoin Cash is trading above all the moving averages.
EMA10/21/50/100/200/300 & MA200, the ones we track.
After breaking out of the falling wedge (red), we have a rising channel (blue).
The upper boundary of the channel will break by a strong move... A huge big candle, multiple candles...
Notice how volume is much higher after June 2023, that's the start of the bullish phase for BCHUSD.
Followed! ✅ | Thanks 👍
Namaste.

Bitcoin Cash / BCH Ascending Triangle BreakoutBCH on the daily forming an ascending triangle pattern. Will confirm when candle closes above the horizontal resistance level.

Will BCH Bounce Back?Sharp Fall: BCH price crumbles an inverted head and shoulders pattern.
Below 50-day EMA: BCH price is now below the 50-day EMA and nearing the 200-day EMA.
13% Drop: The coin has seen a 13% drop in the last ten days.
Uptober Spirit: Fails to break above the $250 mark, questioning the spirit of Uptober.
Resistance Zone: $250 acts as a strong resistance, causing a reversal.
Fibonacci Level: Breaks the 38.20% Fibonacci level, signaling further correction.
Morning Star: Attempting to form a morning star pattern.
RSI Indicator: RSI line reverses from overbought to under the halfway line.
Death Cross: A potential death cross if prices slip under $180.
Crucial Support: 200-day EMA acts as a crucial support zone.
No Divergences: RSI fails to showcase any divergences for a reversal.
Price Prediction: Possibility of reaching $300 in 2023 is now in question.
BCH bearish confirmedBCH broke down from the daily trend line and from few days consolidating…. Wait for retest of the broken support that turn to resistance already and short from there to 180…. Manage your risk
Follow for more market update
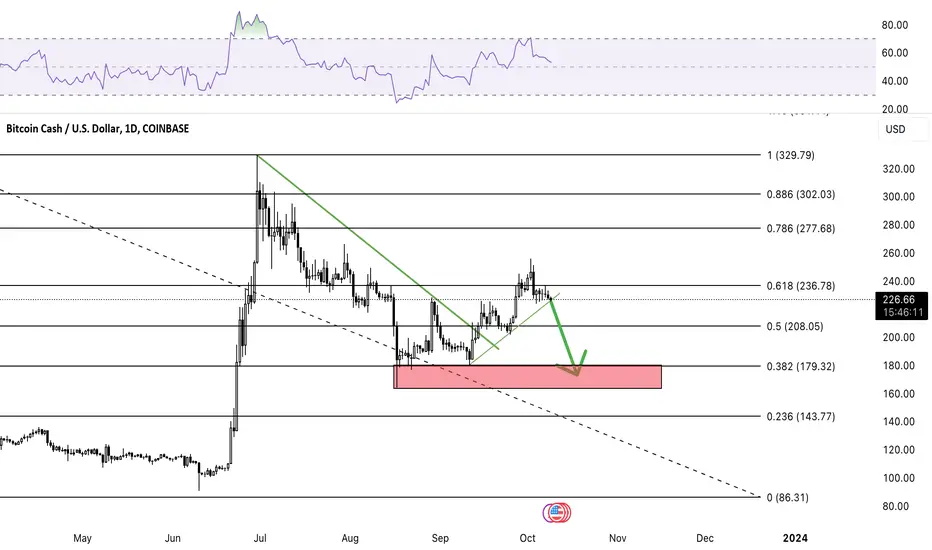
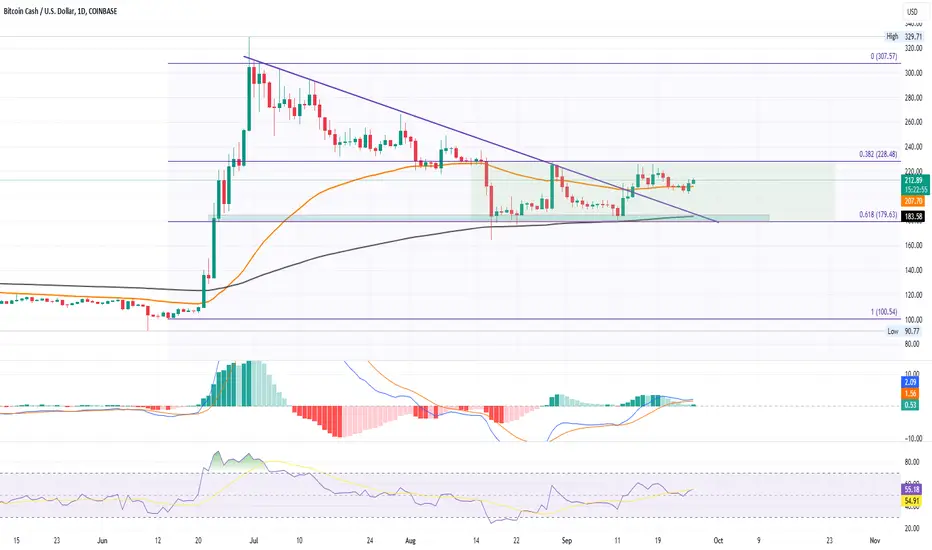
BCH will retest 165After finding support at the 0.382 Fibonacci level, BCH rebounded to the 0.618 level but faced effective resistance. After breaking below the trendline, the target range is set at $165-175.
BCH Triangle IdeaBCH is playing a triangle in the begining and currently in the e wave. Ready to next leg down. It can be either a double zig zag pattern or a impulsive wave. More like a impulsive wave

volume weakness in bitcoin cashThe volume weakness in bitcoin cash seems to have generated a double top in order bloks, will it manage to break out and take over the next liquidity gap?

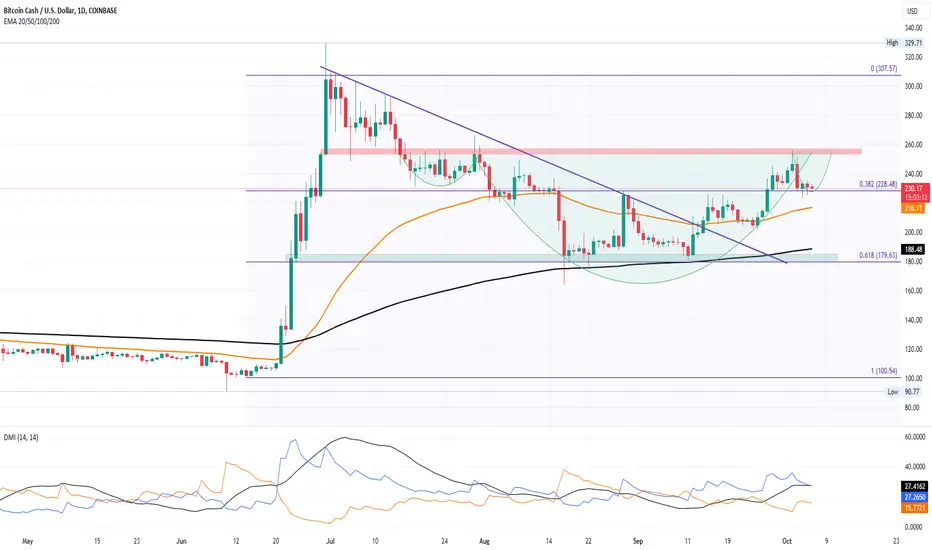
BCH prepares a ride to $300Inverted Head & Shoulders: BCH displays an inverted head and shoulder pattern with a neckline at $250.
Overhead Supply: Despite crossing $250, BCH faced a pullback due to overhead supply.
Potential for $300: If BCH sustains above $250, it could reach $300.
Bullish October: The overall market, including Bitcoin, is bullish, positively affecting BCH.
Current Price: BCH is trading at $231.50 with multiple Doji candle formations at the $230 support level.
Bullish Reversal: A bullish reversal from $180 and the 200-day EMA has provided momentum.
DMI Indicator: The ADX line has shot up, indicating strong momentum, and the DI line remains bullish.
Positive EMA: The 50 and 200-day EMA maintain a positive alignment.
Recovery Phase: The chances of BCH taking a reversal to $250 are increasing.
Critical Neckline: The $250 level serves as a crucial neckline for the bullish pattern.
Bullish Scenario: A breakout above $250 could lead to a rally towards $300.
Bearish Scenario: A failure to hold $250 could lead to a pullback to $228, and potentially down to $200.
BCH price eyes $300!BCH price crosses the $250 mark with a 10% growth in just two days.
Overhead supply pressure triggers a short correction.
Bullish sentiments in October make BCH price predictions for 2023 optimistic.
Bullish dominance at $180 and the 200-day EMA act as a bounce pad for BCH.
Inverted head and shoulder pattern hints at a bullish revival.
Current BCH price is $243.41 with an intraday fall of 1.23%.
Possibility of a second dip to the $228 mark to complete the bullish pattern.
Directional Movement Index (DMI) indicates strong momentum.
50 and 200-day EMA maintain a positive alignment.
A pullback to $228 could offer a crucial entry point for buyers.
A breakout above $250 increases the likelihood of BCH touching $300.
A break below $228 could plunge BCH to $200.
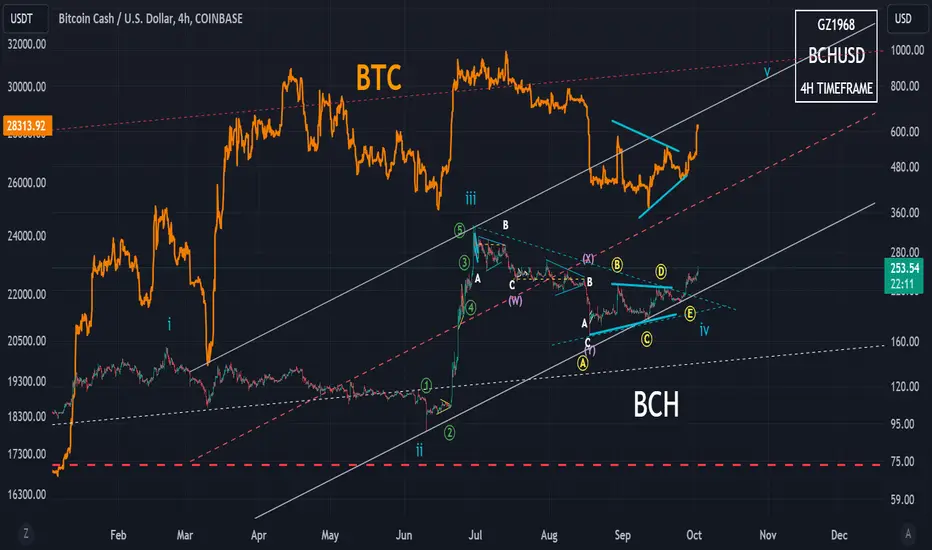
BCH I've been trying to figure out BCH on the small time frame and I think I finally got it. BCH has simply formed a whacky triangle for a wave 4. It became more evident when I overlaid BTC. I'm not claiming the same for BTC by the way.
I show my macro count for BCH below.
Bitcoin Cash Parabolic Rally Update! | BCH Price Prediction 2023Hi friends hope you are well and welcome to the new update on Bitcoin cash (BCH)
Harmonic bullish reversal move:
Before starting the analysis of BCH, I would like to share with you my most recent trade signal for Bitcoin cash, which I shared few days ago. That was a harmonic bullish reversal BAT move, which BCH formed on a 4-hour time frame, and recently it has begun a successful bullish reversal form the potential reversal zone of this move.
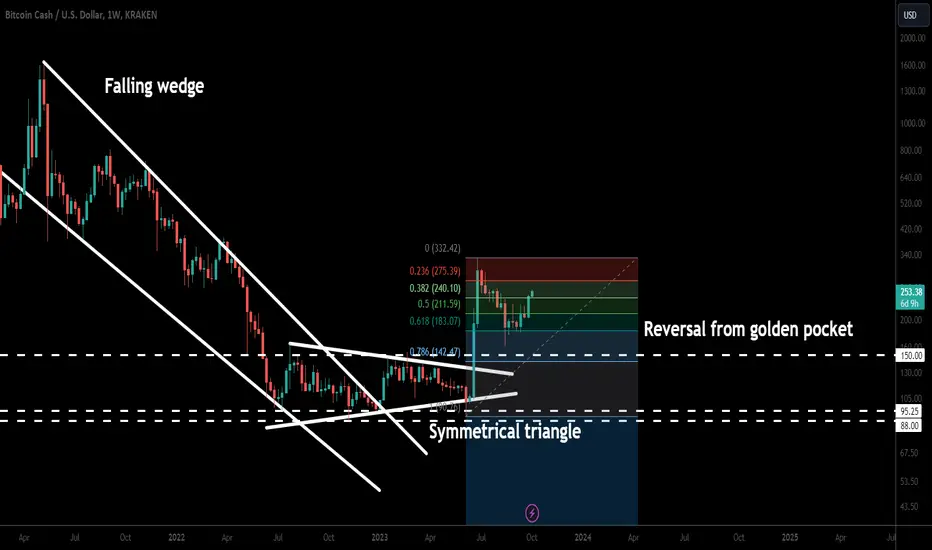
Massive breakouts:
On a weekly time frame chart, from March 2021 uptil January 2023 the priceline of Bitcoin cash was moving inside a very big falling wedge pattern, and finally in the second week of January 2023 Bitcoin cash broke out this huge wedge pattern but got stuck inside in another symmetrical triangle and in the second week of June 2023, after testing the support of this triangle BCH rallied almost 200% and broke out the resistance of this pattern as well.
Dropped in golden pocket:
After the 200% rally the price was dropped 61.8% that is considered as a golden pocket of Fib retracement level. Finally it has happened and BCH has begun nice reversal move
Broke out the channel:
On a daily time frame, for almost 77 days priceline was moving inside a long down channel. Finally it broke out this channel on 15th of September 2023. After the break out the price and got rejected by the reference of $226, it has also broken out this resistance as well. There is also a support at $180, which is also a recent swing low before this channel’s breakout, therefore, below this support the stop loss can be placed, in case of trading this breakout.
Targets:
Target for the recent channel’s breakout is at the top of the channel, which is approximately $315, and if we take a look at the target for the previous breakout from huge falling wedge pattern, which has already happened on a weekly time frame, that is at the top of the wedge, which can be between $1600 to $1800.
Conclusion:
For the past 77 days the priceline Bitcoin cash was moving continuously to the downside, but after breaking out the recent down channel and starting a bullish reversal from a golden pocket it is confirming a trend reversal from the downside the outside.
Bitcoin Cash Analysis: Promising Resistance BreakoutYesterday, the head of the SEC regulator, Gary Gensler, answered questions for 4 hours before the Financial Services Committee of the US House of Representatives, which, among other things, related to cryptocurrencies.
What has become known:
→ on the eve of the hearing, Gary Gensler was sent a letter from four members of the US Congress demanding approval of applications for ETFs based on cryptocurrencies;
→ the head of the SEC avoided answering questions about the timing of decisions on these applications, although he noted that if the agency’s work was stopped on October 1 (like other government agencies), this would slow down the process;
→ for participants in the cryptocurrency market, the event could have given a positive impetus if Gensler’s words had contained hints of positivity, but he once again spoke out about the dangerous prohibited practices that crypto firms use.
However, a source of positivity in the market could be the strong price action in the Bitcoin Cash market. As the BCH/USD chart shows:
→ the price broke through the important level of USD 225, which served as resistance;
→ before the breakdown, a series of rising lows was formed (shown by marks), which can be interpreted as demand pressure. The dynamics are similar to the bullish cup-and-handle pattern;
→ the price went up from the downward channel (shown in red);
→ the price movement from the summer high can be considered a pullback, which found support at the Fibo level of 0.382.
The above bullish arguments suggest that the BCH price may resume its upward trend after a protracted pullback. Then it is possible that the price of Bitcoin Cash will be able to reach its summer high.
This article represents the opinion of the Companies operating under the FXOpen brand only. It is not to be construed as an offer, solicitation, or recommendation with respect to products and services provided by the Companies operating under the FXOpen brand, nor is it to be considered financial advice.

Is BCH Ready For A Bull Run This Week?BCH price action shows a bullish engulfing candle at the 50-day EMA.
BCH avoids a bearish breakdown and may regain positive momentum.
High chances of a $228 breakout, eyeing the $300 mark.
BCH manages to avoid a sharp reversal seen in many altcoins.
Late-night jump in Asian markets indicates an early phase of a bull run.
BCH faces constant rejections at the $228 overhead ceiling.
Currently trading at $212.68, sustaining above the 50-day EMA.
Intraday growth of 1.11% increases chances of challenging the $228 ceiling.
RSI reverses from the halfway line, indicating bullish momentum.
MACD and signal lines avoid a bearish crossover.
If BCH breaks $228, it could reach $300.
Resistance at $228 could lead to a fall to the 200-day EMA at around $180.
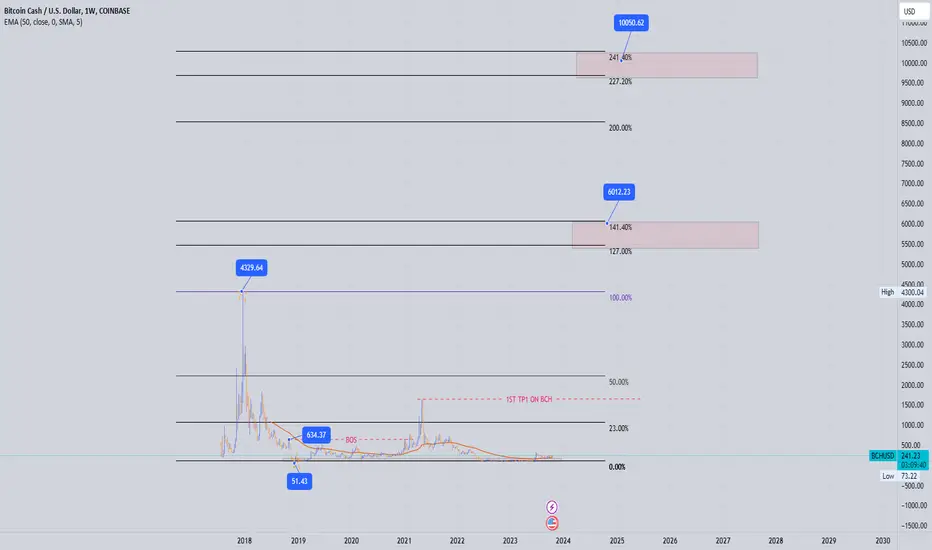
✴️ Bitcoin Cash Cup & Handle Will Lead To $600Hello, hello my dear supporters, followers, readers and mainly, Cryptocurrency traders, how are you feeling in this wonderful day? In this beautiful moment we call, the now!
In this very moment, right now, we are looking at a chart for the BCHUSD trading pair, Bitcoin Cash.
This chart represents what I like to call "financial hieroglyphs", or a foreign language just like computer codes.
If you understand the language, you can read read the codes, it will tell you what the chart is saying but it does not tell you what the future holds. In fact, my deeply beautiful subscriber what the chart is showing is always the past... The future that we so often predict is something that we have to make up, or "reach" based on information extracted from the chart.
The indicators are technical tools that are supposed to smooth the price data, history, and show us things that are not readily available through the price candles themselves. Most of the indicators are exactly the same.
The indicators cannot tell you anything that isn't already in the price data, as the indicators come from price data, so they can never, ever, lead the market. All the indicators by definition then should be called lagging indicators.
The values we use for the indicators are not as important as we might first think, the most important data point is the length of time.
Ok, never mind that because we are here to read the chart, not to explain how they work.
This Bitcoin Cash chart is showing a Cup & Handle pattern, which I ignore 100% of the time. I only point it out because it catches people attention and people like to talk about these patterns... What I see is a break of EMA50 (magenta line on the chart) as resistance and then a test of this level as support. You can find and depict many patterns, but it is all about price action; where is the resistance, where is the support.
5 Consecutive weeks EMA50 and EMA21 hold as support and the sixth week prices go up. This is a strong signal that says the bulls are in control.
As long as BCHUSD trades above 181/192 (EMA50/EMA21), the bulls are in full control.
As long as this condition remains, we expect higher prices... My prediction for this chart based on past history and marketwide action is 580 to 600, can be more but not likely to be less... Remember, this is on a bullish note, if the bulls move ahead.
Can't wait to see it all develop... I hope to be 100% right.
I am hoping that you are blessed with financial success, prosperity, wealth and love.
Thank you for reading my dear friend.
Welcome back!
Thanks a lot for your support.
Namaste.
