BCH continuationDue to the fact that BCH has failed to close above previous important supply, I believe that BCHUSD can drop a bit from here, towards 115, before going back towards 180-200$.
BCHUSD.P trade ideas

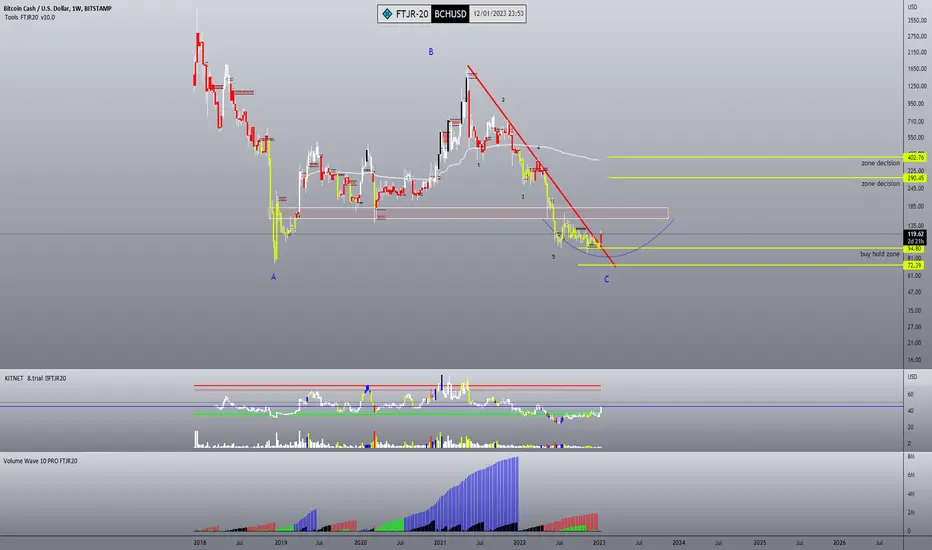
BCH/USD: Long position to $146 USDBitcoin Cash look in the interesting scenario that it's ending this pattern ABC with their measure using Fibonacci for harmonic. What we hope that BCH continue up in this week toward $146 USD
I will put a buy order now in the market price, Stop Loss in $128 USD and take profit to $146. This it's a risk/benefit1:2
Good luck guys!!!

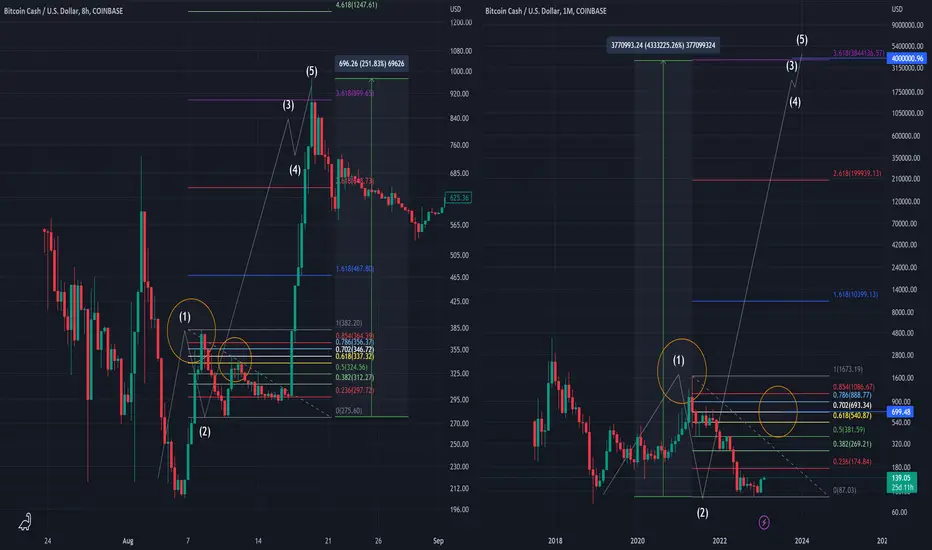
$4M #BCH - Wave 3/5ALTCOIN SEASON may have arrived.
BCH might be repeating 2017.
Will BCH FLEX to the 3.618FIB, AGAIN?
A Quick touch to the 0.702FIB, retrace to 0.236, then a parabolic WAVE 3 push ABOVE the 2.618FIB and wave 5 for the 3.618FIB test, and a 95% retrace from there.
BCH Wave 5 is historically very small.
$100 = $2.9M
Good Luck Traders!
$BCH vs $BTC, which is better?$BTC vs $BCH
Makes sense they look alike but #BCH lagging bit
Their 2021 #crypto highs
#BTC 3x
#BitcoinCash 10x
Like #bitcoin but if you want BETA...


Drawing supply and demand areas and possible scenarioDrawing supply and demand areas and possible scenario

BCH Cash BullishCrypto Altcoins
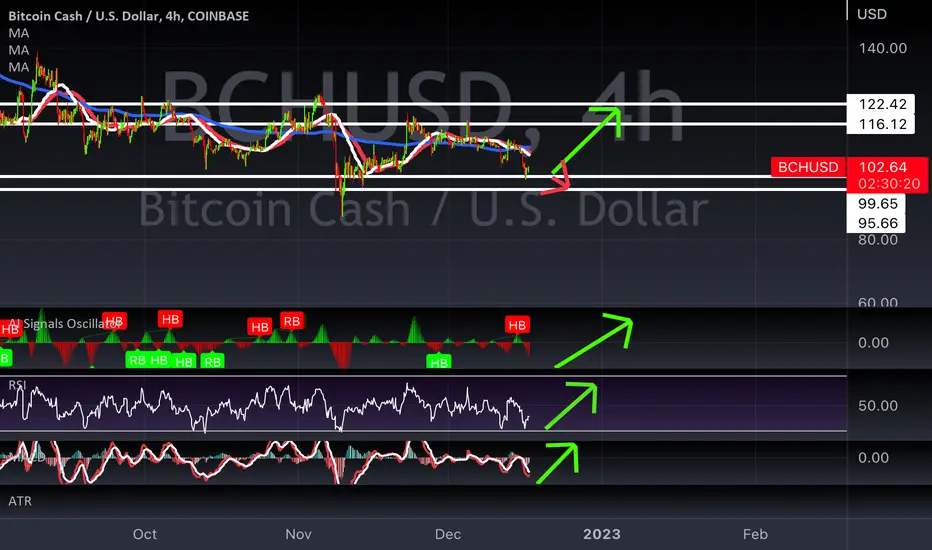
#CryptoWhale100Billion Alt Coin Analysis:
#CryptoWhale100Billion Alt Coin Analysis: BCH
My Analysis shows that BCH show a strong buy after hitting a low of $98 and bounced up to $103. The resistant area we can see BTC running back all the way up to $116 and breaking out higher.
RSI showing a good bull move from buying big buys. We can see a swing-up trend in the next few weeks. Small sales showing on the MACD. BCH has been trending sideways in this area for some time. Whales may accumulate and push it to the upper side.
Shoot me a message with your Technical Analysis to see your thoughts and trading strategies.
#CryptoWhale100Billion
Press The Thumbs Up and send me a message below about your idea on KNC will hit.
Thank You for the support!
Below are some Previous charts links I've written in the pass for Reference.
BCH long riding this through the bull market After the FOMC meeting we should get a clearer direction. I will be watching this pair for the duration so stick around!!!
BCH usdt a fast and small tradethere is a pretty small risk move so i will take it
SHORT/SELL BCH USDT
50% at 135.1 TP 132.4 SL 140.1
50% at 137 TP 133.3 SL 140.1
I expect it to be completed in the next few hours.
FOLLOW FOR MORE

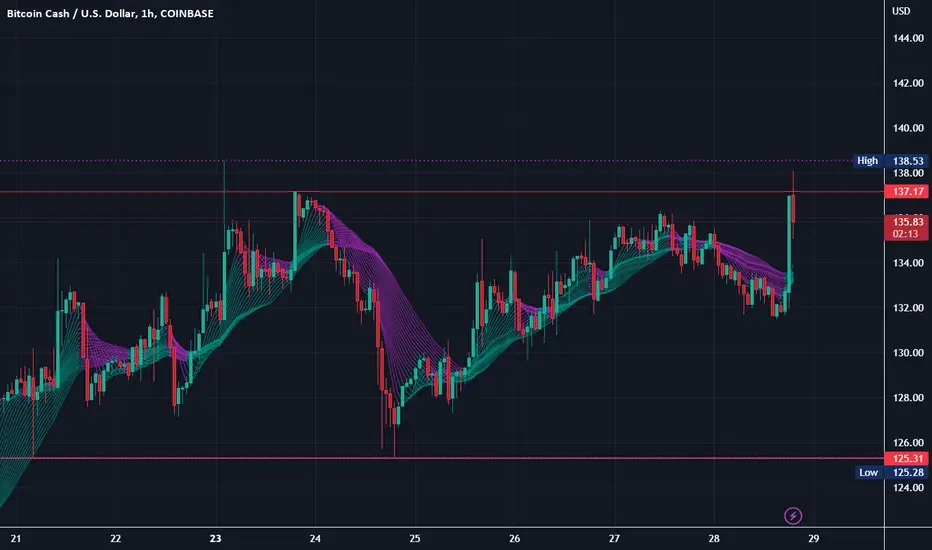
BCHUSD Potential for Bullish Continuation | 27th January 2023Looking at the Daily chart, my overall bias for BCHUSD is bullish due to the current price being above the Ichimoku cloud, indicating a bullish market. Looking for a buy stop entry at 138.53, where the recent high is, we are looking to take profit at 164.97, where the previous swing high is. Stop loss will be placed at 125.82, where the previous overlap support and 23.6% Fibonacci line is.
Any opinions, news, research, analyses, prices, other information, or links to third-party sites contained on this website are provided on an "as-is" basis, as general market commentary, and do not constitute investment advice. The market commentary has not been prepared in accordance with legal requirements designed to promote the independence of investment research, and it is therefore not subject to any prohibition on dealing ahead of dissemination. Although this commentary is not produced by an independent source, FXCM takes all sufficient steps to eliminate or prevent any conflicts of interest arising out of the production and dissemination of this communication. The employees of FXCM commit to acting in the clients' best interests and represent their views without misleading, deceiving, or otherwise impairing the clients' ability to make informed investment decisions. For more information about the FXCM's internal organizational and administrative arrangements for the prevention of conflicts, please refer to the Firms' Managing Conflicts Policy. Please ensure that you read and understand our Full Disclaimer and Liability provision concerning the foregoing Information, which can be accessed on the website.

BCH analysis, QUICK OUTLOOKThis is an analysis where you will find multiple scenarios regarding both entries for sells and buys. In this clip you will also find exactly the levels and the confirmations needed for the upcoming set-ups!

Potential Breakout in BCH, Target at 135The main view of this trade idea is on the Daily Chart.
The cryptocurrency Bitcoin Cash (BCH) appears to be in an asymmetrical triangle setup. The downward trendline of lower highs of 156 and 124 was broken on 8th January, 2023. The support trendline of 88 and 95 continues to be held. Expectations are for the breakout of the triangle to continue and BCH is expected to rally towards 135. This view will be negated if BCH were to decline below 95.
Technical Indicators
The technical indicators corroborates this view. BCH’s Supertrend is back in buy-mode after the Index crossed above 103. Also, BCH is back above the Daily MA, the 1st time since 13th December, 2022. The Awesome Oscillator is above 0 and trending higher while the RSI is above 50.
The intra-day trend following indicators of the cryptocurrency also display uptrends in the 15-Min, 2-Hour and 4-Hour time frames. Short to medium term support is seen around the 95 - 98 price range.
Recommendation
The recommendation will be to go long at market, with a stop loss at 95 and a target of 135. This produces a risk/reward ratio of 2.21.
Disclaimer
The views expressed are mine and do not represent the views of my employers and business partners. Persons acting on these recommendations are doing so at their own risk. These recommendations are not a solicitation to buy or to sell but are for purely discussion purposes.

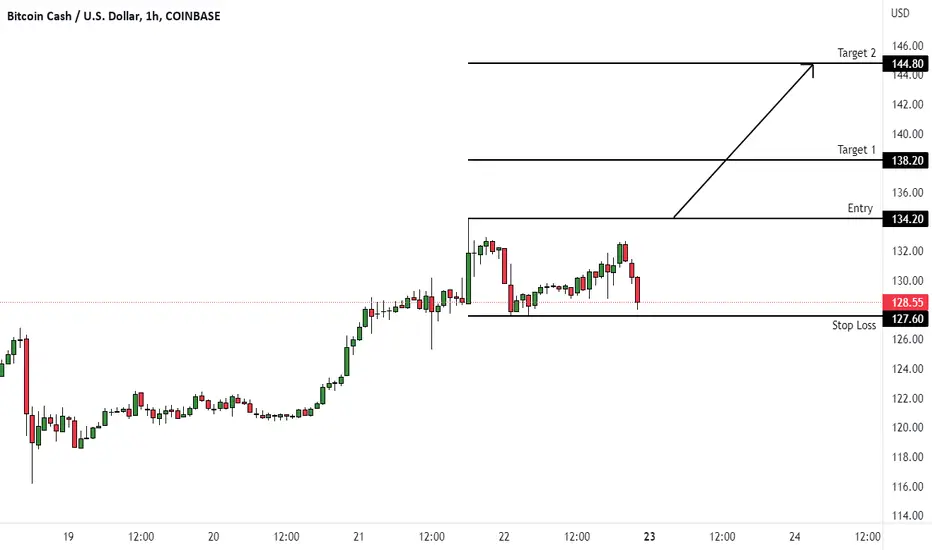
BCHUSD (1H) - Bullish breakoutHi Traders
BCHUSD (1H Timeframe)
The market is in an uptrend and we are waiting for an entry signal to go LONG above the 134.20 resistance level. Only the downward break of 127.60 would cancel the bullish scenario.
Trade details
Entry: 134.20
Stop loss: 127.60
Take profit 1: 138.20
Take profit 2: 144.80
Score: 8
Strategy: Bullish breakout
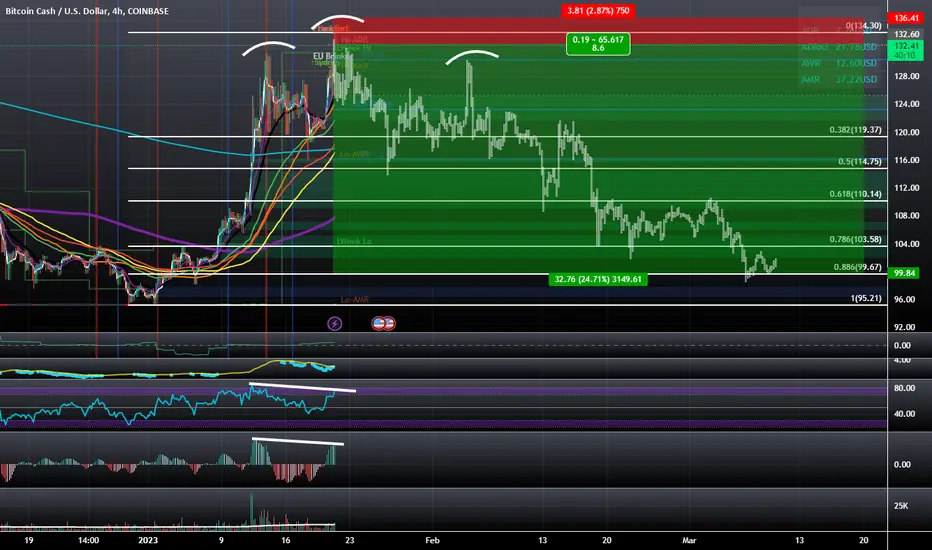
Bitcoin Cash: Bearish Divergence Price ProjectionBitcoin Cash is showing both MACD and RSI Bearish Divergence on the 4 Hour Timeframe at the Hi-ADR and this could result in BCH forming a Bearish BAMM to take it back down to the 0.886 Fibonacci Retrace at $99.67 if my projection is correct.
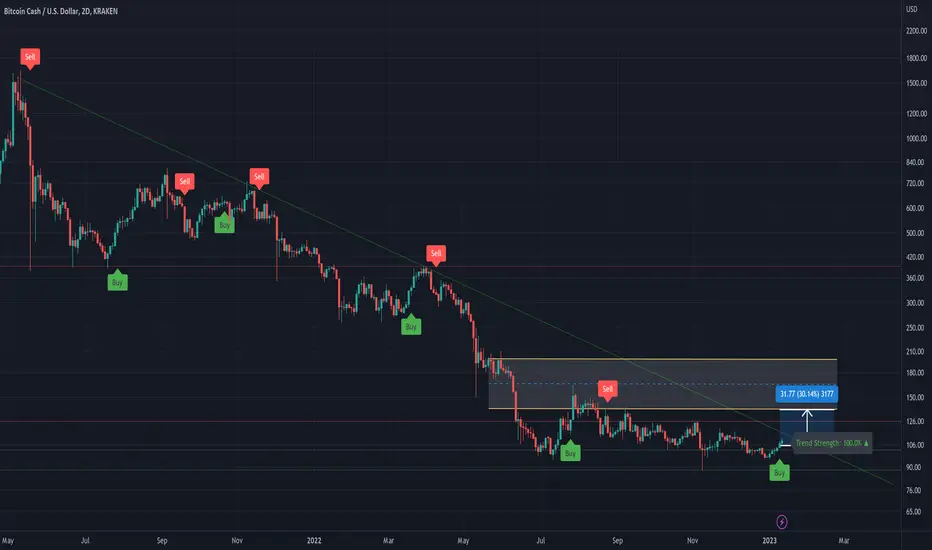
BCHUSD - 30% Jump Incoming After Breaking Descending TrendBCHUSD has recently received a buy signal from Crypto Tipster v2 after bouncing off recent support on the underside.
This suggests that the cryptocurrency may be entering a bullish market and could see a significant increase in value. The question now is whether BCHUSD will be able to break through a descending trend line to reach 30% in profit after a year and a half of a generally downward trend.
***
If you enjoyed or agree with this idea - drop us a comment, like & follow! :)
***
BCH quick CONTINUATIONThis is a continuation of a previous analysis. You will find here the 2 possible outcomes for the upcoming week.

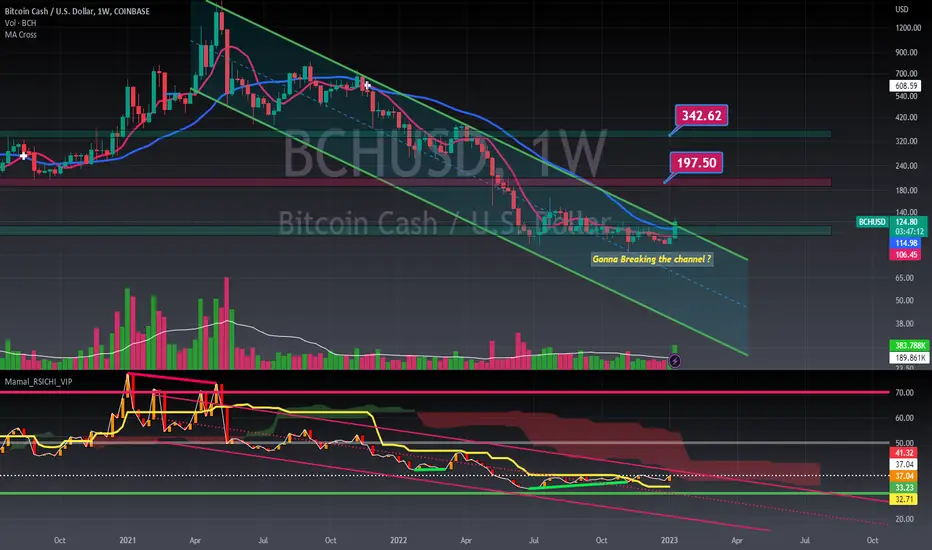
bch breaking the channelevery thing is clear on chart
i set the targets on chart
and supply and demand is clear on chart
what is your idea?
BCHUSDTBCH showing some strength and my trading plan on the chart.
stop lost under the bullish order block
Be safe

Bitcoin Cash important zones of buying and selling aggressionWhat price did you buy at or do you believe is the best buy for bitcoin cash?
I want to read your comment and discuss it in the community!
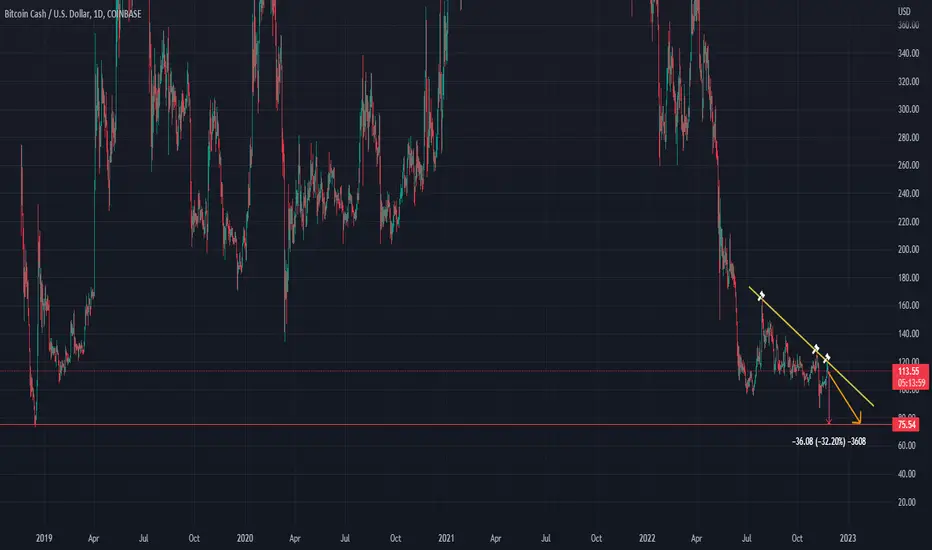
BCHUSD 30 % dump comingAs the bear market continues , the price can't break the resistance and it remains in the downtrend.
We expect 30 % dump before any significant bounce. If it happens BCH would drop to 75 $ which are lows from December 2018.
It also likely that we will see price lower than 75 $ in this bear market.
Any bounce probably will be a short lifted and the price eventually will go down.
Good luck
BCH quick OUTLOOKThis analysis is a continuation of the previous one. I have stated 2 possible scenarios by considering the current market structure. There are 2 types of entries explained in this video.

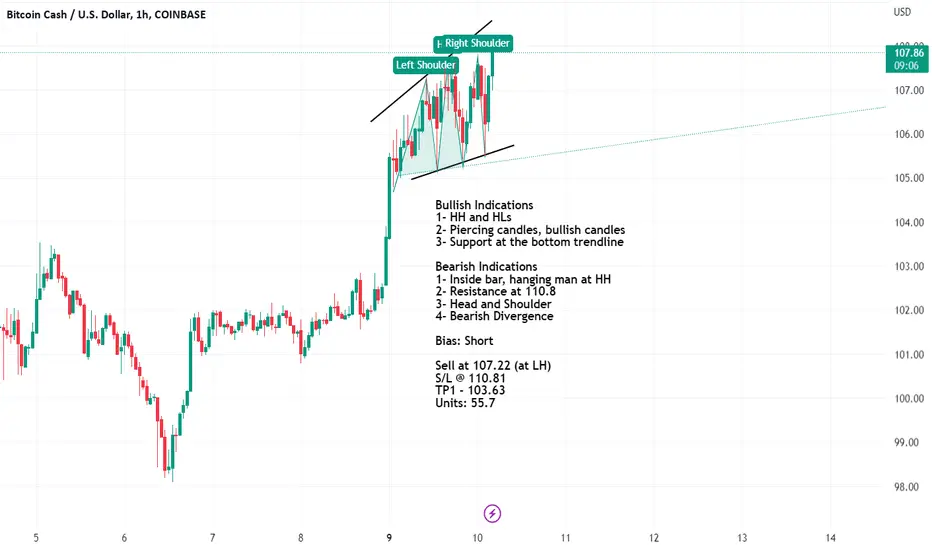
Going short on BCHUSDBullish Indications
1- HH and HLs
2- Piercing candles, bullish candles
3- Support at the bottom trendline
Bearish Indications
1- Inside bar, hanging man at HH
2- Resistance at 110.8
3- Head and Shoulder
4- Bearish Divergence
Bias: Short
Sell at 107.22 (at LH)
S/L @ 110.81
TP1 - 103.63
Units: 55.7
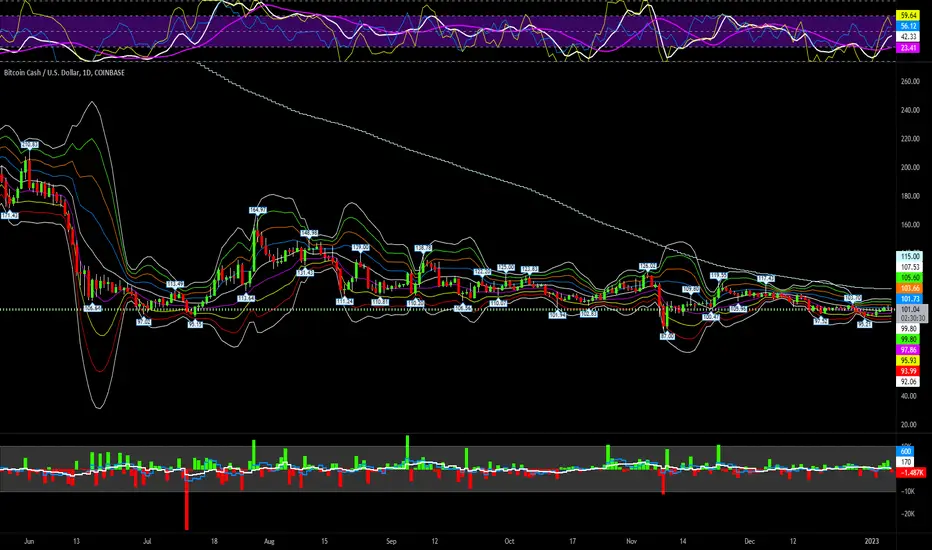
Bitcoin Cash levelsBitcoin Cash levels on the 1-day chart: In my opinion BCH is the highest upside probability and lowest downside risk crypto asset at the $99 level. Plus, it's future utility is undervalued considering it has the same rareness of 21M tokens, much lower transaction fees than BTC, with much faster transaction times. It has a 6 year price discovery history that brings it near its all time low currently. Furthermore, BCH supports smart contracts. I think it makes sense to HODL for 2023 and add more on dips now. No sense selling BCH at these levels imo. The biggest downside is it could take a long time for BCH to get out of a sideways range.
SMA200 = $115
VWMA13 Bollinger-Bands.Multi_Choice:
top = $107.54
R3 = $105.61
R2 = $103.67
R1 = $101.74
pivot = $99.80
S1 = $97.86
S2 = $95.93
S3 = $93.99
bottom = $92.06
Do your own due diligence, your risk is 100% your responsibility. This is for educational and entertainment purposes only. You win some or you learn some. Consider being charitable with some of your profit to help humankind. Good luck and happy trading friends...
*3x lucky 7s of trading*
7pt Trading compass:
Price action, entry/exit
Volume average/direction
Trend, patterns, momentum
Newsworthy current events
Revenue
Earnings
Balance sheet
7 Common mistakes:
+5% portfolio trades, capital risk management
Beware of analyst's motives
Emotions & Opinions
FOMO : bad timing, the market is ruthless, be shrewd
Lack of planning & discipline
Forgetting restraint
Obdurate repetitive errors, no adaptation
7 Important tools:
Trading View app!, Brokerage UI
Accurate indicators & settings
Wide screen monitor/s
Trading log (pencil & graph paper)
Big, organized desk
Reading books, playing chess
Sorted watch-list
Checkout my indicators:
Fibonacci VIP - volume
Fibonacci MA7 - price
pi RSI - trend momentum
BBMC - bollinger bands
TTC - trend channel
AlertiT - notification
tickerTracker - MFI Oscillator
tradingview.sweetlogin.com