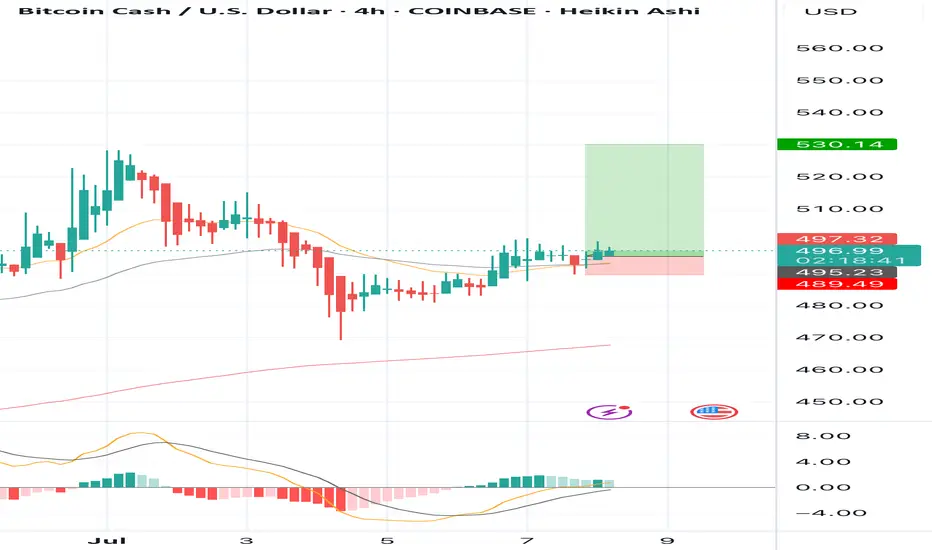
BUY BCHUSD now for a four hour time frame bullish trend continuBUY BCHUSD now for a four hour time frame bullish trend continuation ...............
STOP LOSS: 489.49
This buy trade setup is based on hidden bullish divergence trend continuation trading pattern ...
Always remember, the trend is your friend, so whenever you can get a signal that the trend will continue, then good for you to be part of it
TAKE PROFIT : take profit will be when the trend comes to an end, feel from to send me a direct DM if you have any question about take profit or anything...
Remember to risk only what you are comfortable with... trading with the trend, patient and good risk management is the key to success here
BCHUSD trade ideas
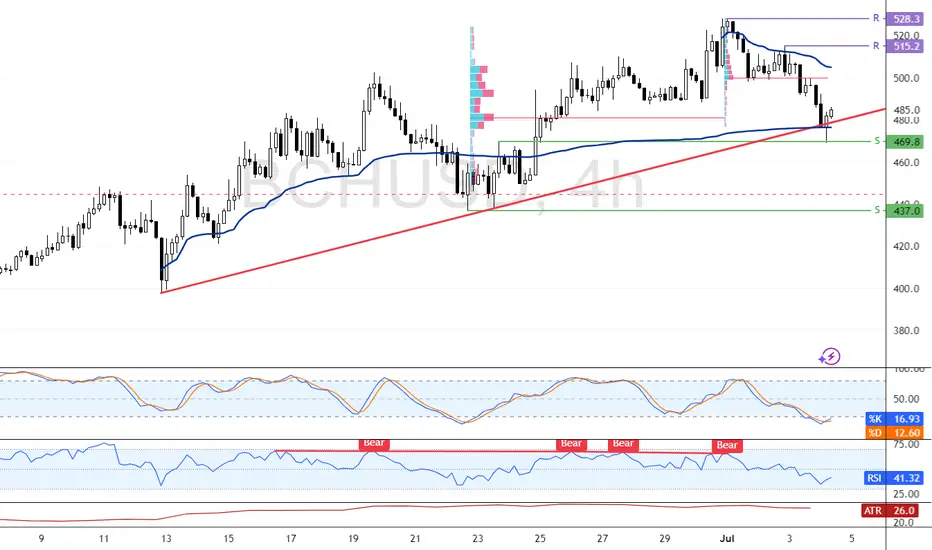
Bitcoin Cash Rebounds from VWAP-Backed SupportBitcoin Cash eased from $528.3 to $469.8, finding support backed by the anchored VWAP and ascending trendline. BCH trades at $485.0, with Stochastic at 17.0 signaling oversold conditions.
A bullish wave may emerge if $469.8 holds, targeting $500.0 and $515.2.
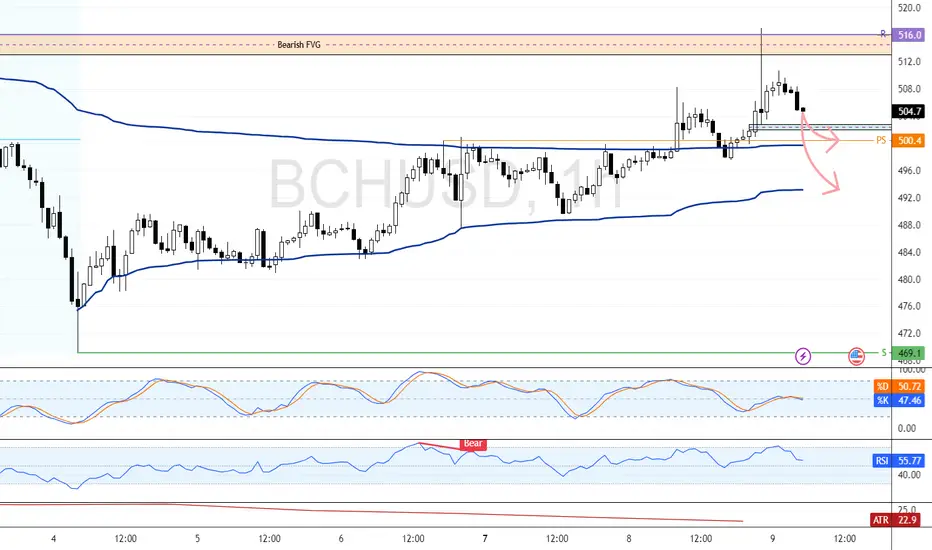
Bitcoin Cash Slips After Rejecting $516.0 FVGFenzoFx—Bitcoin Cash start consolidating after testing the bearish FVG at $516.0. The primary trend remains bullish above $500.4.
A test of the Bullish FVG and point of interest at $500.4 is expected. If this support holds, BCH may rebound and retest resistance at $506.0.
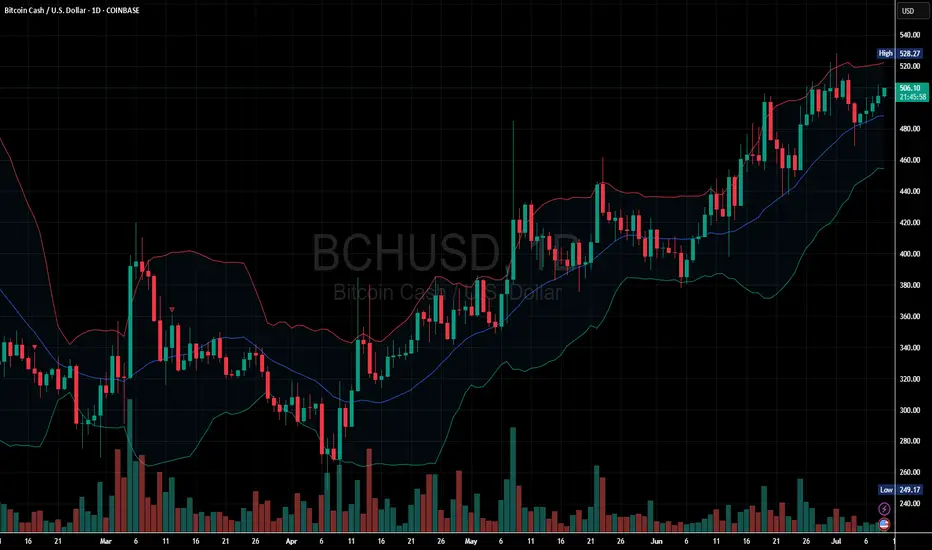
BCH/USD Chart Analysis: Higher Highs Fuel Bullish Outlook
Price is riding the upper half of the Bollinger Band.
Price recently bounced from the middle band, a bullish continuation signal.
Multiple bullish candles with small upper wicks, showing buyers are in control.
Recent pullbacks have been shallow, indicating strong buying interest on dips.
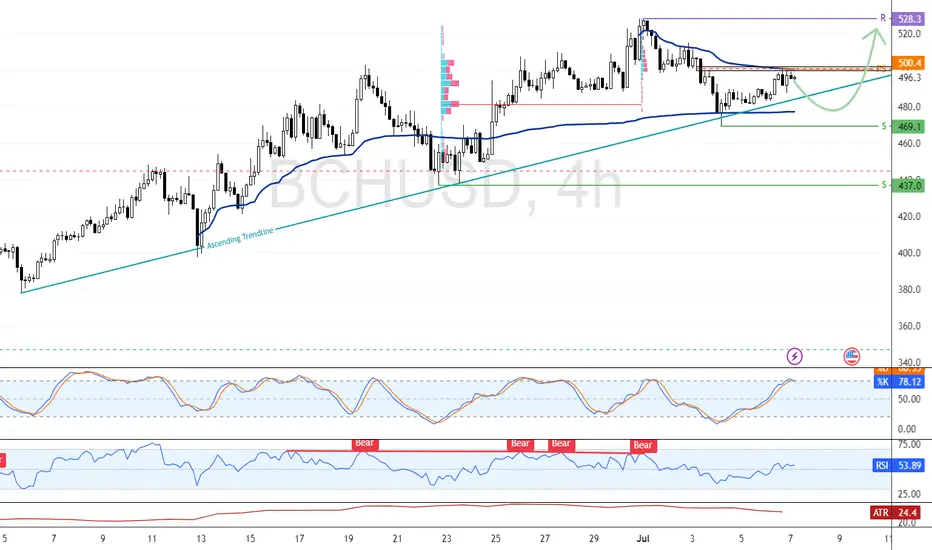
Bitcoin Cash Tests $500.4 Resistance After Strong ReboundFenzoFx—Bitcoin Cash rebounded from $469.1, a demand zone backed by the anchored VWAP and ascending trendline. BCH is now testing resistance at $500.4, supported by volume profile and anchored VWAP.
Bullish Scenario : While the bullish trend remains intact above $469.1, consolidation toward $480.0 is likely before aiming for $528.3.
Bearish Scenario : A close below $469.1 would invalidate the bullish scenario, exposing $437.0 as the next support.
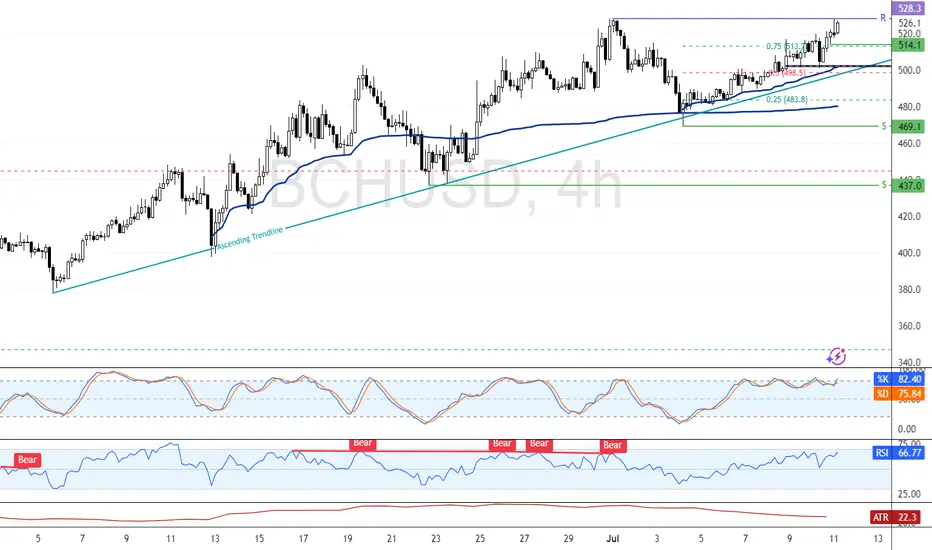
Bitcoin Cash Tests $528.3 as Double Top FormsBitcoin Cash faces resistance at $528.3, forming a double top and trading slightly below this level. Stochastic readings above 80.0 signal an overbought market, increasing the risk of a correction.
If BCH fails to break above $528.3, a pullback to $514.1 and $500.0 is likely, offering potential bullish re-entry zones. Alternatively, a confirmed breakout above $528.3 could pave the way toward the next supply area at $560.0.
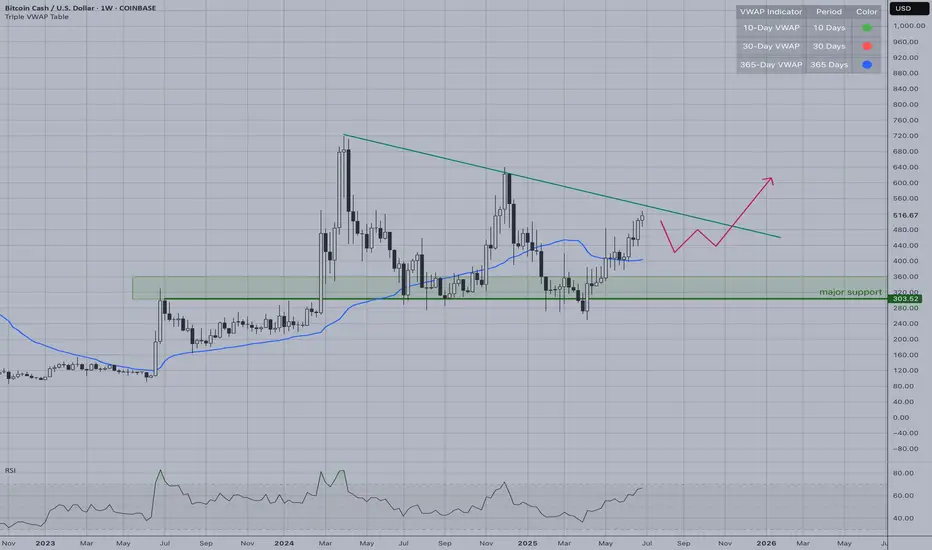
BCH | Long-Term Bullish StructureBitcoin Cash presents an attractive long-term bullish structure with multiple technical confluences suggesting higher prices ahead. The patient approach of waiting for the VWAP retest provides optimal entry conditions for this long-term bullish thesis, rather than chasing current elevated prices.
Technical Analysis:
Strong support zone holding at $303.62 with multiple successful tests
365-day VWAP trending upward around $400-420, acting as dynamic support
Descending resistance from previous highs being challenged
Entry Strategy:
Traders should wait for a pullback to the 365-day VWAP ($400-420 zone) before entering long
positions.
This approach offers:
Better risk/reward ratio
Clear stop placement below major support at $300
Entry at a proven dynamic support level
Key Levels:
Entry: $400-420 (VWAP pullback)
Stop: Below $300 support
Target: Above descending trendline toward $600+
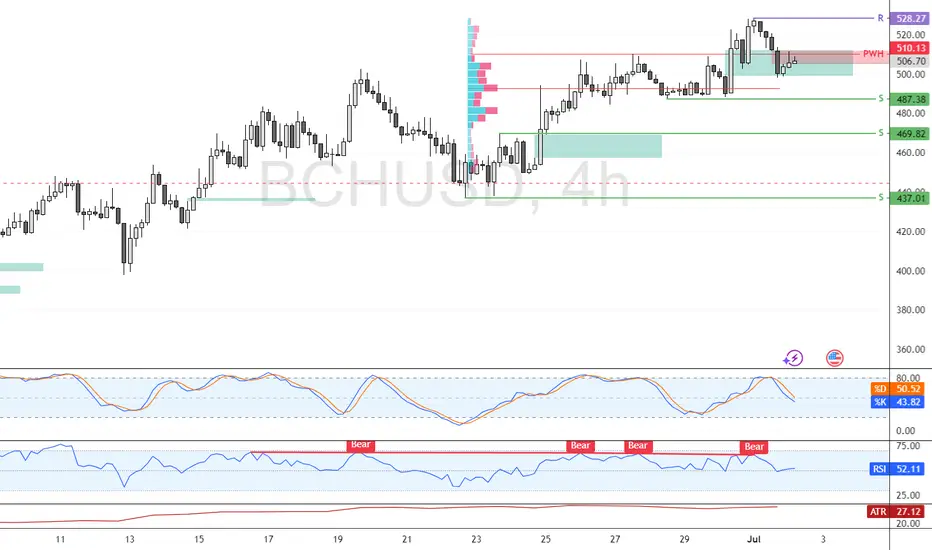
Bitcoin Cash Slides as Bearish Signals StrengthenBitcoin Cash fell below last week’s low and now trades around $506.8. Technical indicators show bearish signals, with RSI diverging and the Stochastic trending lower.
BCH/USD may retest support at $487.3; if broken, it could slide to $469.8. The bearish outlook is invalidated if price closes above $528.2.
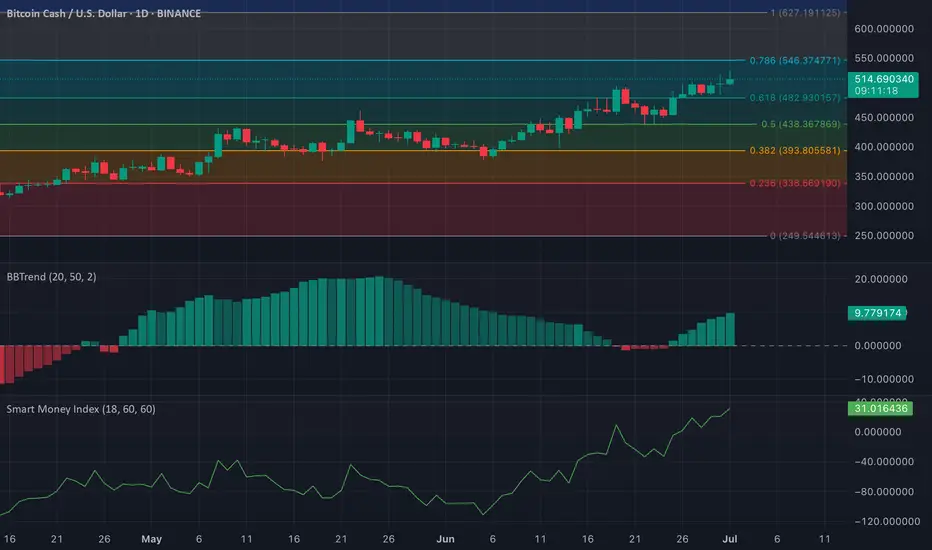
BCH: Bullish Momentum Builds as BBTrend and SMI Flash GreenBCH is showing signs of strengthening bullish momentum. The Bollinger Band Trend (BBTrend) is pointing to increasing volatility in favor of the bulls.
On the daily chart, the BBTrend’s green histogram bars have been growing steadily over the past few sessions, a signal of rising buying pressure.
For context, BBTrend gauges trend strength based on the expansion of the Bollinger Bands. When the bars turn green and expand, it signals a strengthening uptrend.
Right now, buyers appear to be in control, with volatility expanding toward the upside. This increases the odds of BCH extending its rally in the near term.
Adding to the bullish case, the Smart Money Index (SMI) is climbing suggesting that institutional or seasoned traders are positioning on the buy side. The SMI tracks how smart money behaves during key trading hours, and this uptick reinforces the current momentum.
If demand climbs, BCH's price could climb to $546.374.
On the other hand, if buying stalls, the coin's price could fall to $482.93.
Full story here .
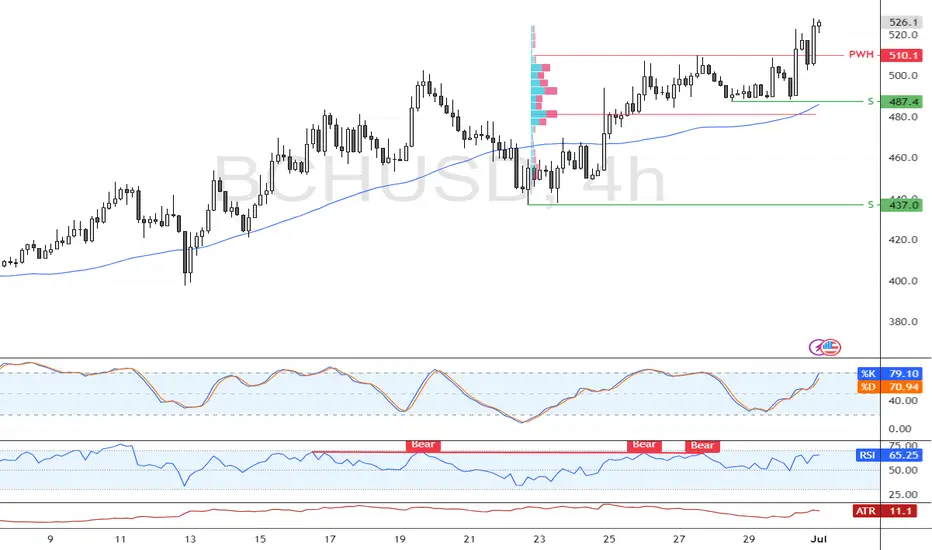
BCH Faces Pullback RiskFenzoFx—Bitcoin Cash broke above last week’s high at $510.0 and is stabilizing near $525.0. However, the daily Stochastic is overbought, suggesting a pullback toward the 50-SMA at $487.4.
A rebound from there could resume the uptrend, while a close below $487.4 may send BCH toward $437.0.
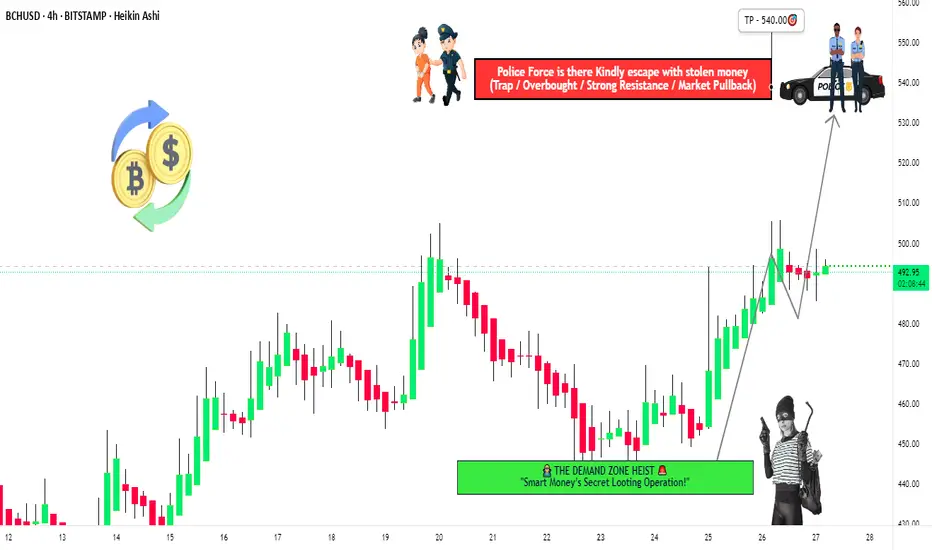
"BCH/USD Heist Mode: Enter Long, Exit Before Bears Strike!🚨 BCH/USD HEIST ALERT: Bullish Loot & Escape Plan! (Thief Trading Style) 🚨
🌟 Greetings, Market Bandits & Profit Pirates! 🌟
(Hola! Oi! Bonjour! Hallo! Marhaba!)
🔥 Mission Briefing:
Based on Thief Trading tactics (TA + FA), we’re plotting a bullish heist on BCH/USD. Time to swipe the loot & escape before the cops (bears) show up!
🔓 ENTRY: "The Vault is Open!"
📈 Buy Zone: Retest of recent low/high (15-30min timeframe).
💡 Pro Tip: Use limit orders for precision—don’t chase!
🛑 STOP LOSS: Live to Steal Another Day
📍 Thief SL: Recent swing low (~440.00 on 4H TF).
⚠️ Adjust based on your risk, lot size, & multi-order strategy.
🎯 TARGET: 540.00 (or Bail Early!)
🏴☠️ Escape before the red zone (overbought, reversal risk, bear traps!).
💰 "Take profit & treat yourself—you earned it!"
📢 WHY THIS HEIST? (Bullish Catalysts)
✅ Fundamentals: Strong macro + sentiment.
✅ Technicals: Pullback entry + bullish structure.
✅ Intermarket trends: Crypto momentum favors bulls.
(For full intel—COT reports, on-chain data, sentiment—check 👉🔗🔗!)
🚨 NEWS ALERT: Avoid the Police (Volatility Traps!)
🔹 Avoid new trades during high-impact news.
🔹 Trailing stops to lock profits & dodge reversals.
💥 BOOST THIS HEIST! (Let’s Get Rich Together!)
👍 Smash that "Like" & "Boost" button to fuel our next robbery!
🚀 Follow for daily heist plans—easy profits await!
See you at the next heist, bandits! 🤑💎
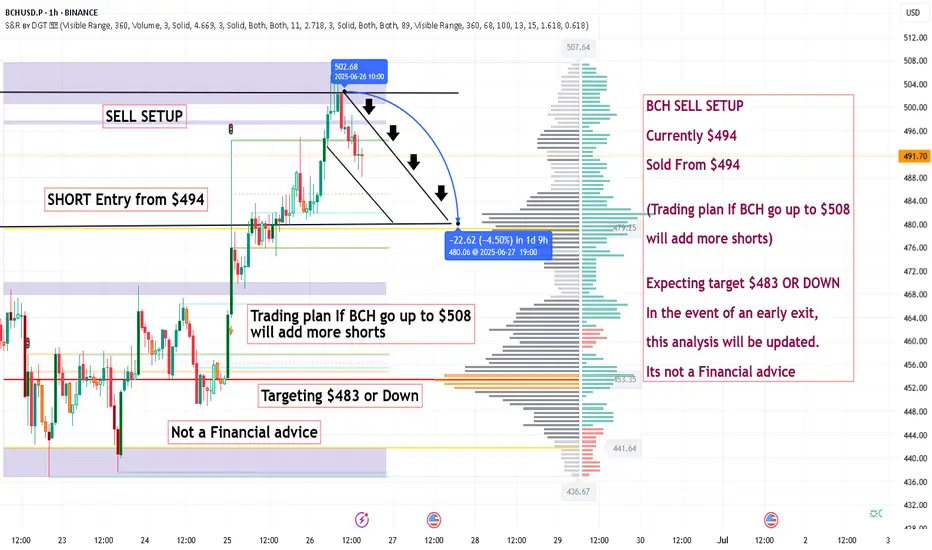
BCH SELL SETUP ,Sold From $494BCH SELL SETUP
Currently $494
Sold From $494
(Trading plan If BCH go up to $508
will add more shorts)
Expecting target $483 OR DOWN
In the event of an early exit,
this analysis will be updated.
Its not a Financial advice
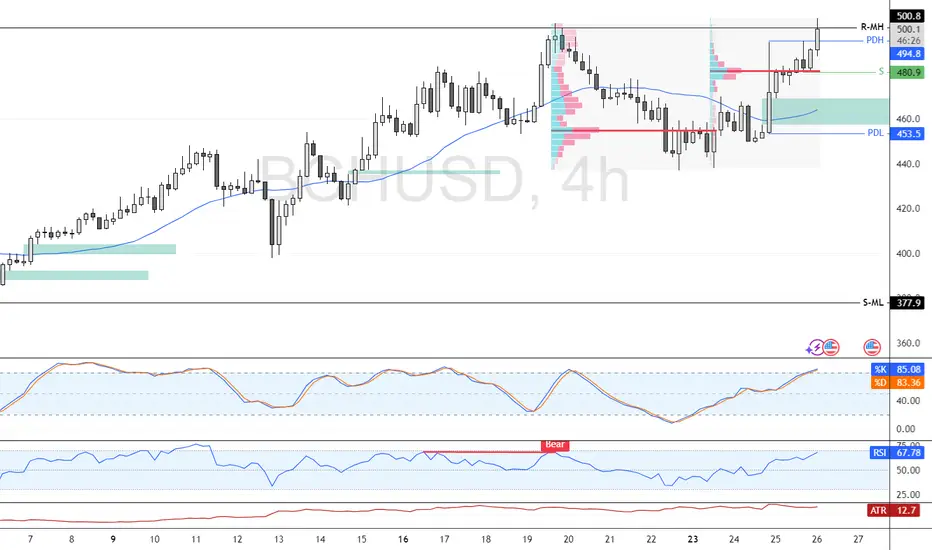
BCH Faces Resistance at $500.0 Amid Bearish SignalsBitcoin Cash rose to $500.0, a resistance zone backed by the June 19 high. Stochastic reads 85.0, indicating short-term overpricing.
The 4-hour chart shows a possible double top pattern, suggesting consolidation. If BCH stays below $500.8, it could target $494.8 and, if selling continues, drop to $480.9.
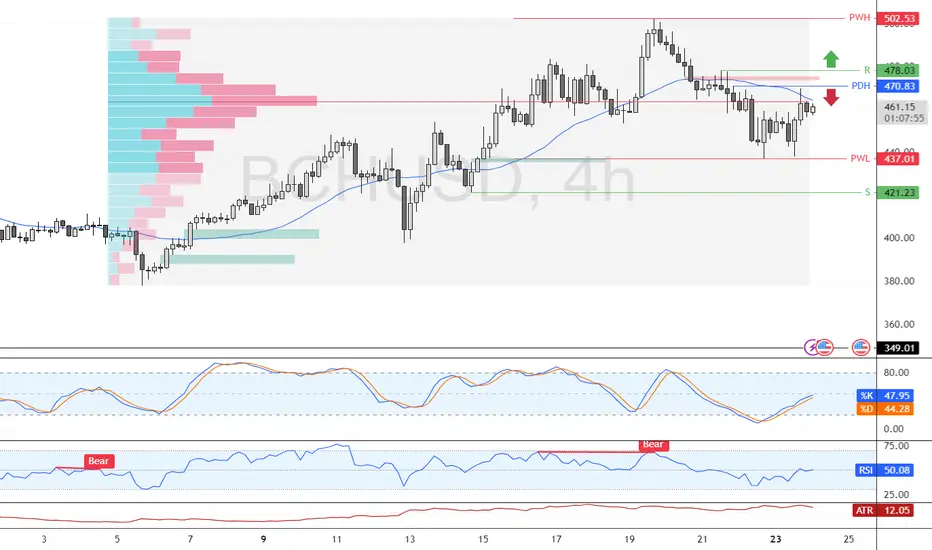
Bitcoin Cash Faces Pressure Below Key Resistance ZoneFenzoFx—Bitcoin Cash rose from $437.0 support, now trading near $461.3 and testing resistance backed by volume profile and the 50-period SMA.
If BCH stays below $470.8, bearish momentum may resume, targeting $437.0 and potentially $421.2. A bullish breakout could follow a close above $470.8, aiming for $478.0.
Bitcoin Cash BCH: $495 | Breaking out back to FRESH HiGHS a fork or spin off from original Bitcoin
created for scale more txn lower fees and faster
nice consistent volume
supply under the custody of big 3
could be best performing among OG coins
with less fanfare promotion and founder being distant from it
Time fixes everything
and this may just be the True Essence of BITCOIN Satoshi hoped to see
instead of BTC being centralized under Saylor Dorsey and Trump

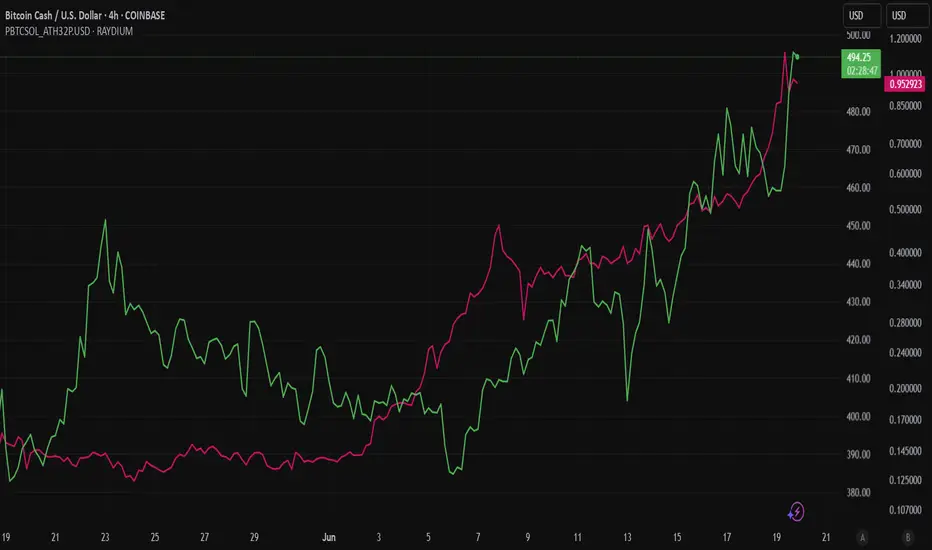
A visual comparison of Purple Bitcoin (PBTC) and Bitcoin Cash (BA visual comparison of Purple Bitcoin (PBTC) and Bitcoin Cash (BCH) trends, powered by the Purple Bitcoin Compare Bot.
Bitcoin Cash Rebounds from $456 as RSI Shows Bullish DivergenceFenzoFx—Bitcoin Cash swept liquidity below $456.0 during NY midnight and is now rising around $464.0. RSI 14 signals bullish divergence, suggesting growing momentum. If BCH holds above $456.2, it could target $472.0 and potentially $481.2.
The bullish outlook is invalidated if BCH stabilizes below $456.0.
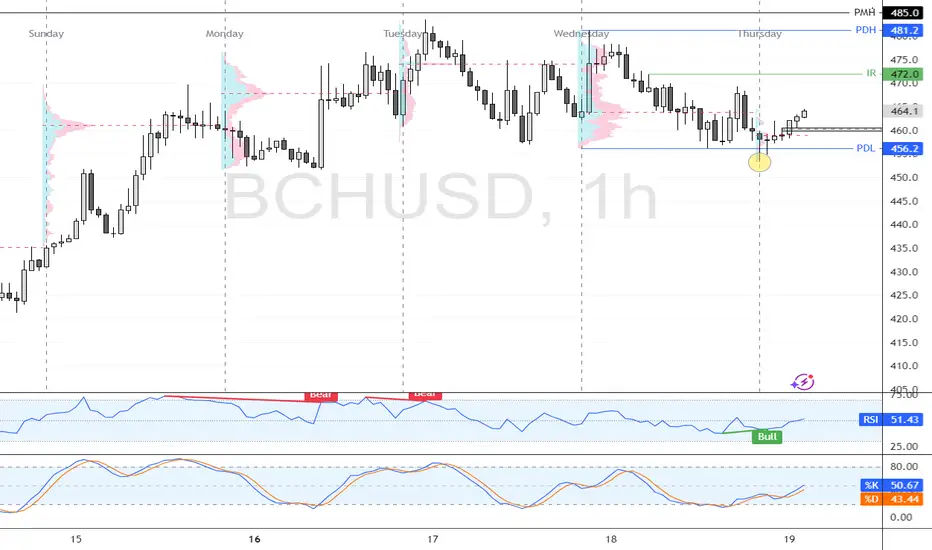
#BCH/USDT#BCH
The price is moving within a descending channel on the 1-hour frame, adhering well to it, and is heading for a strong breakout and retest.
We are experiencing a rebound from the lower boundary of the descending channel. This support is at 456.
We are experiencing a downtrend on the RSI indicator, which is about to break and retest, supporting the upward trend.
We are heading for stability above the 100 moving average.
Entry price: 471
First target: 480
Second target: 489
Third target: 500

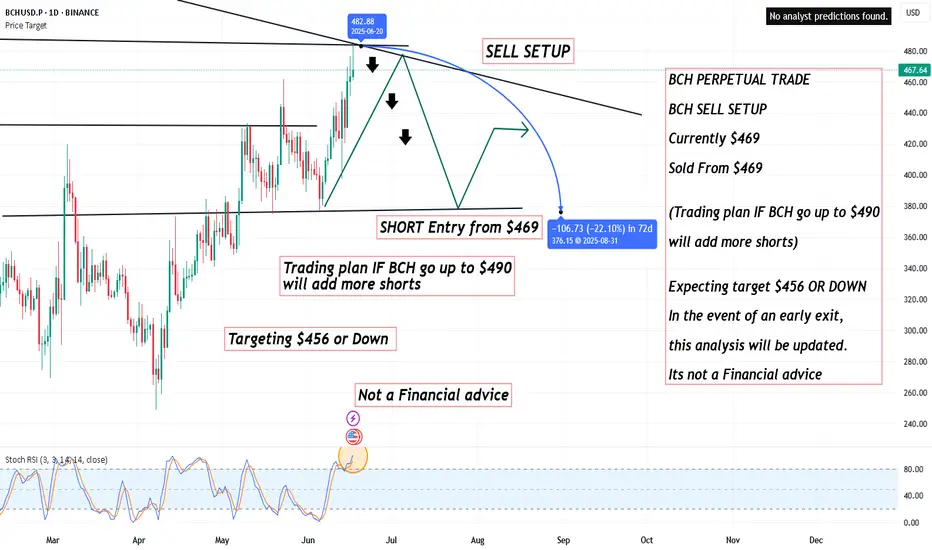
BCH PERPETUAL TRADE , Sold From $469BCH PERPETUAL TRADE
BCH SELL SETUP
Currently $469
Sold From $469
(Trading plan IF BCH go up to $490
will add more shorts)
Expecting target $456 OR DOWN
In the event of an early exit,
this analysis will be updated.
Its not a Financial advice
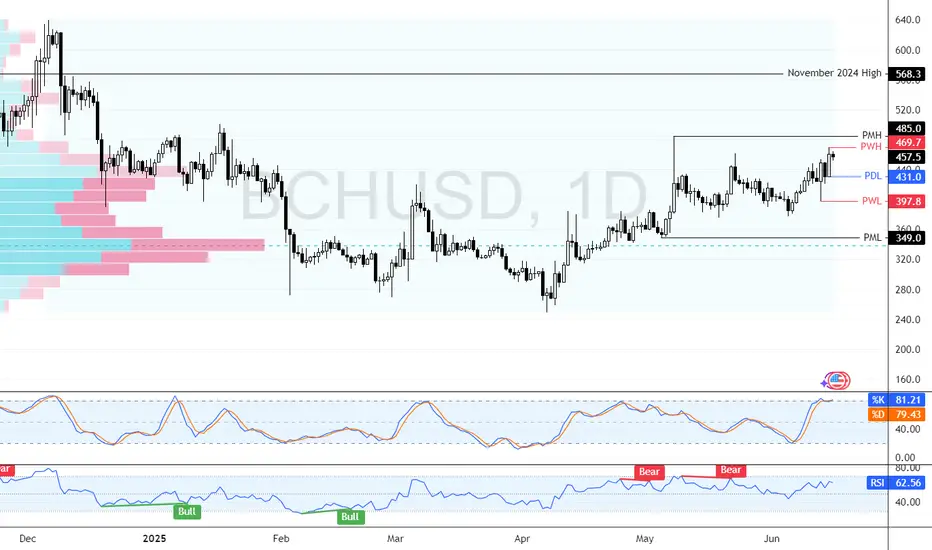
Bitcoin Cash Nears $485—Will BCH Hold Its Gains? FenzoFx—Bitcoin Cash remains bullish, nearing the previous monthly high at $485.0, though overbought conditions signal possible consolidation.
BCH/USD may stabilize around $431.0 before resuming its uptrend toward $485.0. A break above this level could pave the way for $568.0.
The bullish outlook holds as long as BCH stays above $349.0.
Bitcoin Cash Pulls Back After Strong Rally to $446Bitcoin Cash (BCH) pushed aggressively to $446 but faced a harsh rejection, plunging below $430. It is now attempting to consolidate just above $430, but the recent bearish engulfing candle structure suggests uncertainty.
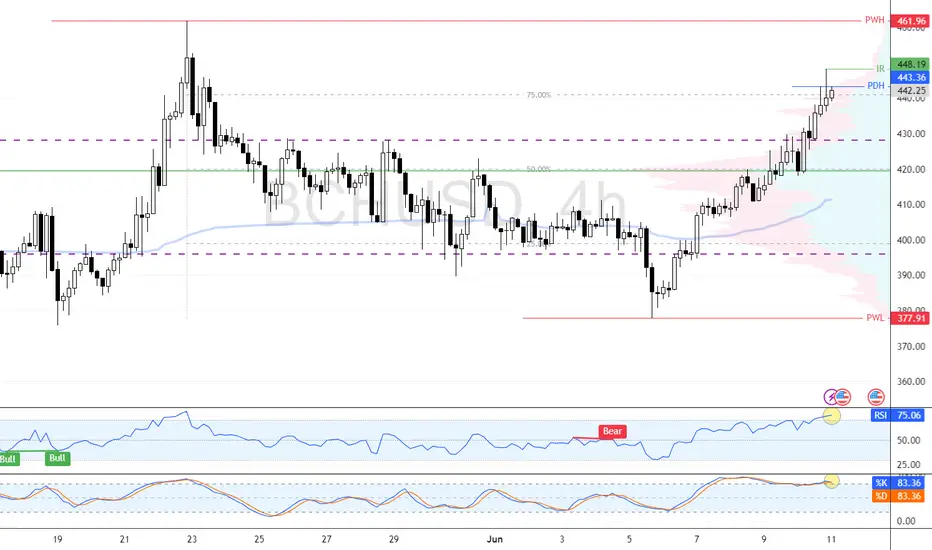
BCH/USD Consolidates Eying $461.9FenzoFx—BCH (Bitcoin Cash) paused its uptrend near $448.1, a low-volume zone, suggesting the rally may resume after consolidation.
Technical indicators show overbought conditions, increasing the likelihood of a short-term dip. BCH/USD may consolidate near $430.0 before aiming for the next target at $461.0.
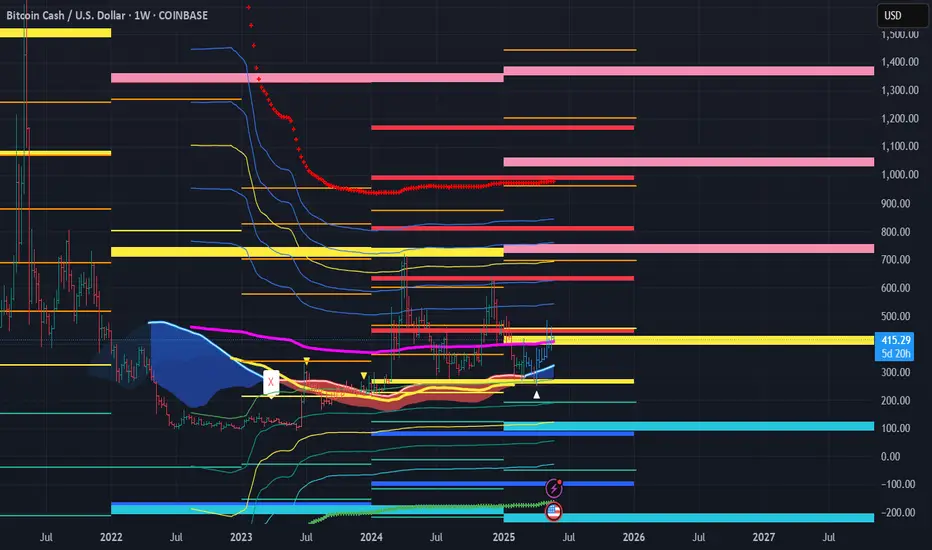
The other Bitcoin's time to shineBitcoin Cash has been dying a slow death, but will soon come back to life.
I love this chart. The Weekly chart shows that an uptrend has started on the linear regression channel, and the Bollinger Band moving average centerline is crossing the 3-year pivot point, which is typically a catalyst for upward movement. The 3-year pivots are stacked tightly, which acts similarly to tight Bollinger bands in that price action is more responsive to any move upward.
Target is the 3-year pivot R1 at $730 and maybe more. I will set a trailing stop at the target to lock in gains and see if we can get some additional upside.