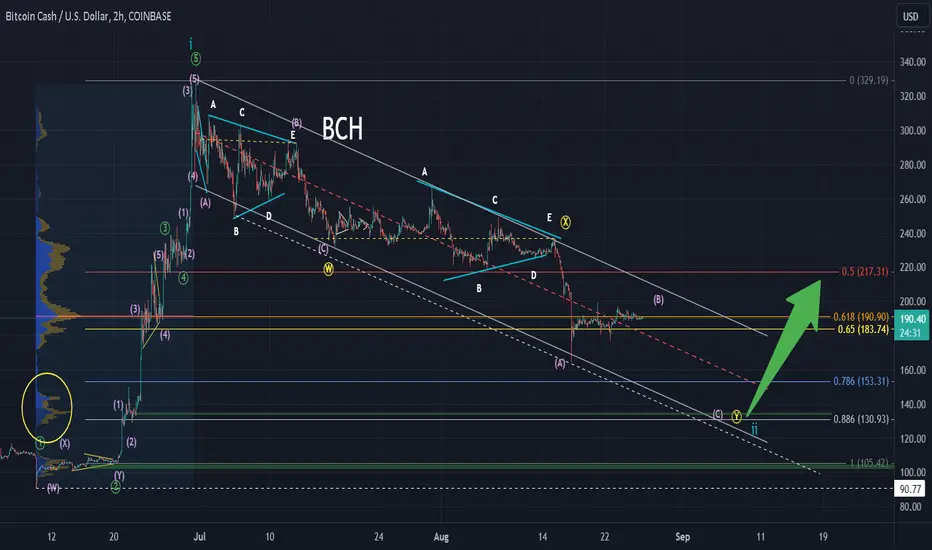
BCH drop to $130BCH looks like it has one more drop to it, perhaps to the 0.886 fibonacci around $130 roughly.
It has been channeling nicely, which can help us determine the bottom as we get closer.
I circled the Fixed Range volume that I suspect marks where the drop will stop.
There is a Demand zone marked in green at this same area too.
This will be the end of the retrace, then BCH will start the next major pump.
Even though I will mark this chart as Short, I am long term Long.
BCHUSD trade ideas
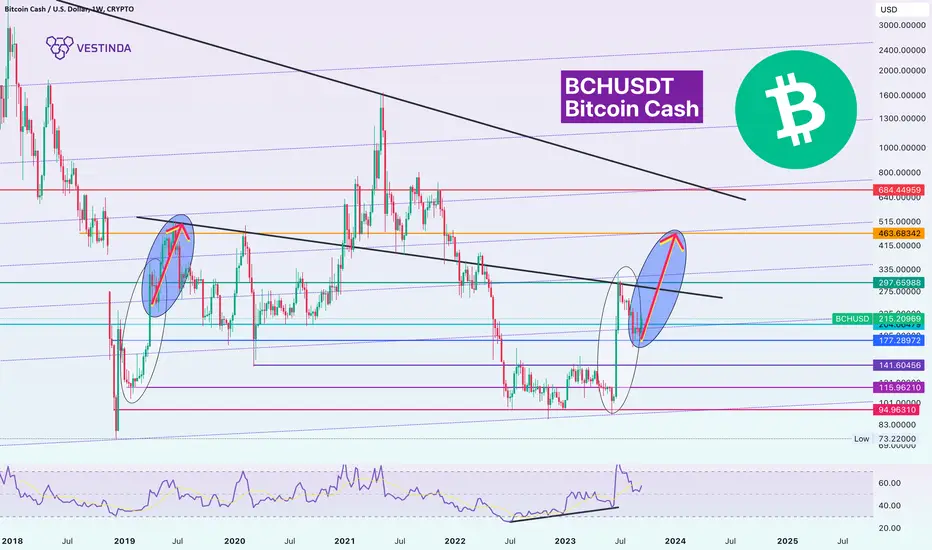
BCHUSD Chart Resembles 2019: Potential Surge to $297 and $463Hello dear traders!
BITSTAMP:BCHUSD appears to be mirroring its 2019 price action closely. 📈 There's potential for further upward movement towards the $297 and $463 levels. These price zones align with the ascending Fibonacci channel and historical support/resistance areas.
The $200 support level holds significant sway, a pivotal point for both bulls and bears. 🐂🐻 A breach below $200 could signal a deeper price decline – an essential factor to monitor.
Conversely, a compelling signal emerges on the weekly chart, hinting at a price surge towards $300 and $460. 🚀 This optimism stems from hidden bullish divergence and a resemblance to the 2019 price patterns. Keep a keen eye on these developments. 👀
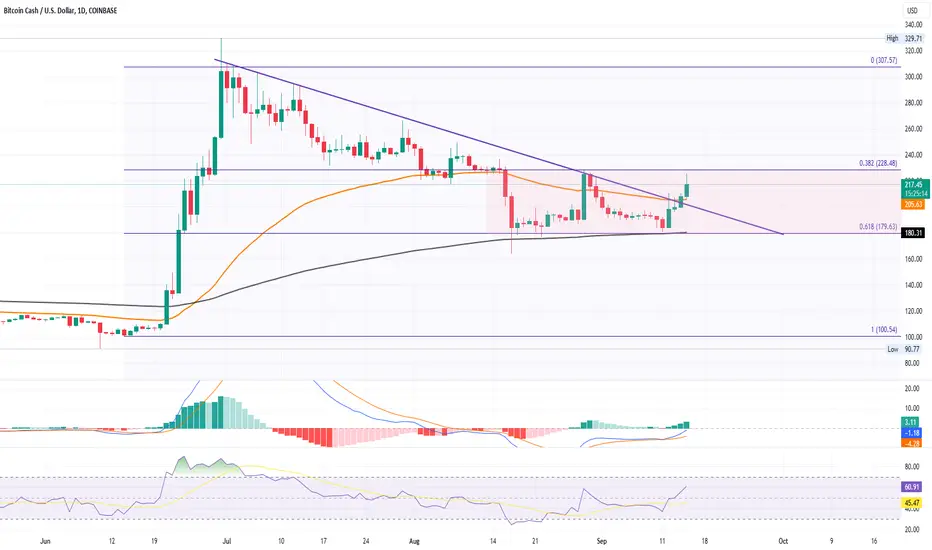
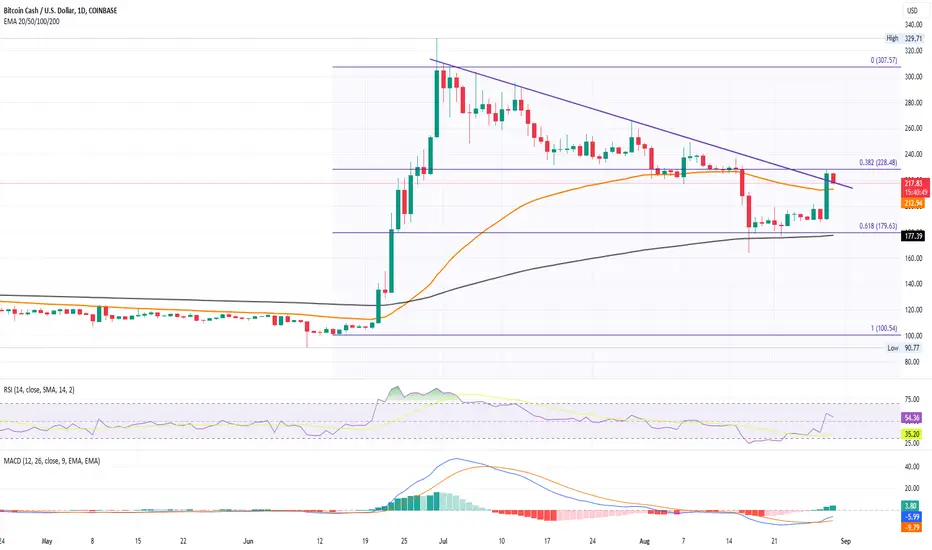
Here’s How BCH Is Ready To Cross $300 in 2023!
Bitcoin Cash (BCH) price has broken above short-term resistance, hinting at a bullish move.
BCH has bounced back from the 200-day EMA, challenging the $228 level.
A breakout from $228 could push the BCH price to $300.
BCH retested the 200-day EMA near the $180 mark after a 200% jump in June.
BCH has broken the resistance trendline, signaling a potential breakout rally.
BCH has seen an 18% recovery this week and is currently testing overhead resistance.
Current BCH price: $217.82.
BCH is trying to avoid a death cross and is teasing a range breakout.
With Bitcoin resurfacing above $26K, BCH is predicted to rise and potentially hit $300.
A downtrend continuation from $228 could see BCH retest the bullish dominance at $180.
Bch MACRO VIEWBecause price finally managed to close above 200$, BCH can no easily retest 230$. Only after price manages to liquidate that intermediary high and then mitigate the remaining orders above it, we will get the confirmation needed for price to continue to go towards 33$ and then 450-500$. Make sure to watch the video in depth, as I explain important cyclical movements that are already occurring on BCH's chart.

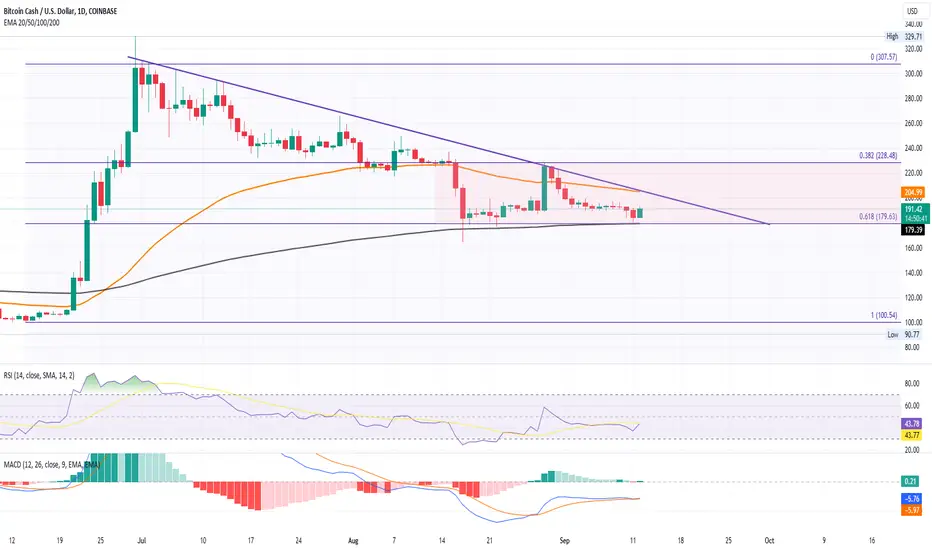
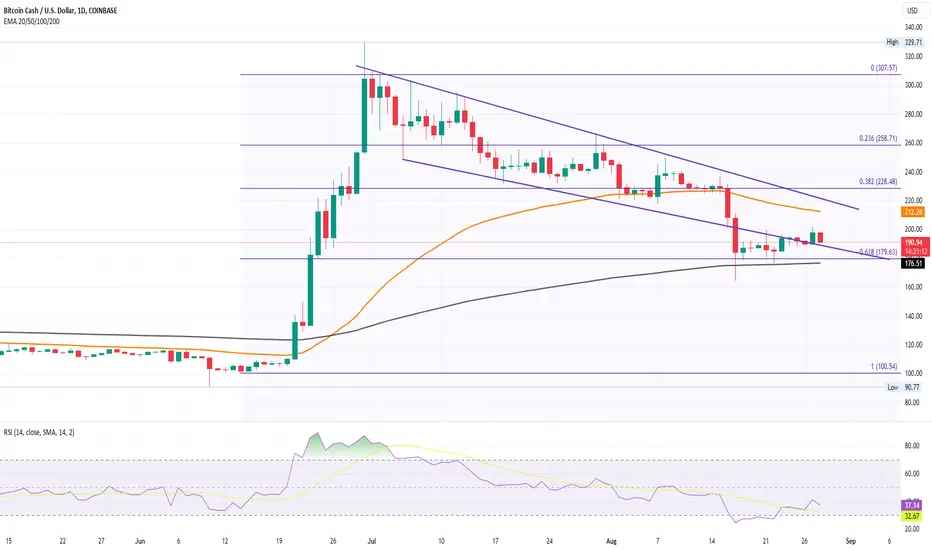
When Will Bitcoin Cash (BCH) Price Reach $300?Bitcoin Cash has been stable at the $180 mark, a significant support level.
The 50-day EMA is declining, indicating a potential death cross with the 200-day EMA.
A breach of the $228 level (38.20% Fibonacci mark) could set BCH on a path to $300.
BCH is currently trading between two key Fibonacci levels: 61.80% and 38.20%.
The price has dropped by 39% in the last two and a half months and is currently trading at $190.
Technical indicators: RSI shows a sudden increase, avoiding the oversold boundary, while MACD maintains a sideways trend.
The Bitcoin ETF approval by the SEC in October could be a significant catalyst for BCH's price.
A technical breakout could lead BCH to the $228 level, a 20% increase from the current price, with potential to reach $300.
A continued downtrend below the 200-day EMA could lead to a significant drop to $100.
Will BCH price bounce to $300?Bitcoin Cash finds significant support at $180, priming it for bullish potential.
The 50 and 200-day EMAs trend sideways, signaling a potential death cross.
A breakthrough at the $228 mark, which aligns with the 38.20% Fibonacci retracement, could drive BCH to a $300 target.
Bitcoin Cash experienced a 200% price jump in June but faced a correction thereafter.
BCH is currently sandwiched between the 61.80% and 38.20% Fibonacci levels.
A potential double bottom pattern is forming, with a base at the $180 mark, indicating a potential bullish reversal.
The current BCH price stands at $195, growing by 0.76% intraday.
The presence of multiple Doji candles suggests a bullish breakout possibility.
RSI demonstrates a bullish divergence, complemented by the double bottom pattern.
The MACD and its signal line exhibit a bullish divergence, avoiding a bearish crossover.
The 50 and 200-day EMA are moving sideways, hinting at a looming death cross if BCH goes below $180.
A breakout past $228 could see BCH aiming for $300.
If BCH breaks below the $180 support, it might plummet to $150 or even $100.
The two Fibonacci retracement levels will significantly influence BCH's price movement.

BCH CONTINUATIONIf price closes above 200$ on the current 3 day candle, we can see a continuation towards 22$, but I tend to see only a small bullish continuation to 220 and then a strong bearish push towards 150. Only if price breaks above 230$ on the weekly timeframe, we can see strong bullish continuations towards 320 and 450$. A break below 190 from here already could make price drop towards 150$, but it would be pretty dangerous to trade from that level, as BCH could easily reverse and trade back inside 200-220 area.

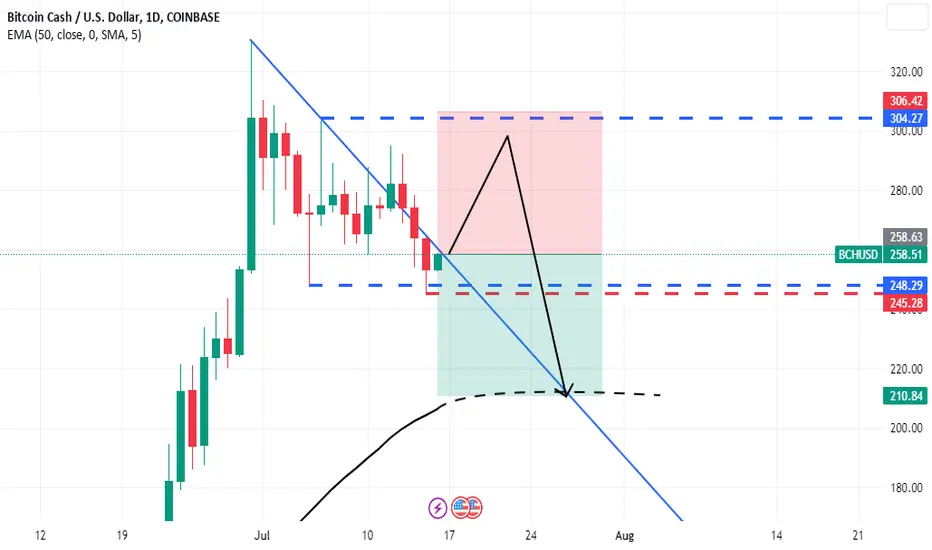
downtrend for retracementthis is my point of view using Daily TF.. support my analysis at m15 earlier.. price always return back to touch ema50
Ascending Triangle Forming BCHUSD With Higher LowsA 2 hour chart of Bitcoin Cash / BCHUSD forming an ascending triangle pattern. Already broke out previously, only to retrace and return inside the triangle. Might see another breakout soon.
A similar pattern can be seen on dogecoin on the 4hr chart.

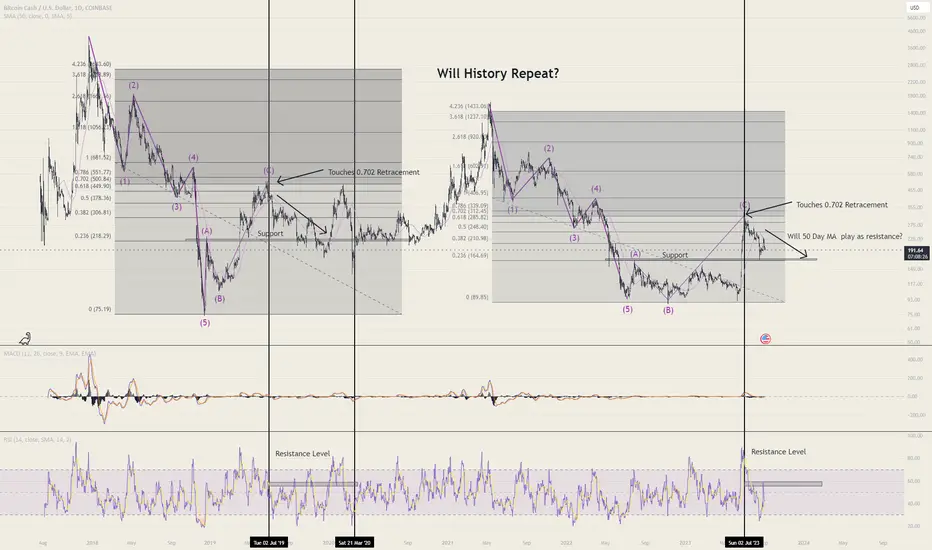
History Repeating Itself? | BCH Predicted to Hit $160Are y'all seeing the same pattern I'm seeing? We are experiencing almost the exact same moments back in 2017!!!
FIB:
-With the 0.236 placed at the top of the first major rally after the final fall, we see this play as an area of support and a correction at the 0.702 Retracement level BOTH in 2017 and now.
- Do you think the 0.236 Level will play as a support? Comment your thoughts down below!
Patterns:
- I used Elliot waves (12345) (ABC) to try to find a pattern and a correlation to the history of BCH. I'll let you be the one to decide if you see the patterns.
- Let me know if you found something better in the comments bellow!
MA:
- We want to see resistance play out for the next few weeks if we want to see this pattern play out correctly, for this will help the price reach lower.
- Do you think were in for another huge fall? Comment below!
RSI:
- RSI will hopefully show resistance levels at the .60 for accouple weeks
BCH Targets Hit as PredictedBCH had a very nice run, but when you properly apply divergence indicators and TD counts on the right timeframes... it's not that hard to spot a good short.

BCH continuationPrice is already at an important level for BCH. A failed mitigation of the remaining sell orders from here will confirm a good buying opportunity towards 300$ and even 450$ as a our main target. But, if price reacts from here and drops towards 200$, we will need more confirmation. Only a succesful break above 200$ can confirm the buys, otherwise price can still retest the current low at 170$ and even liquidate it.

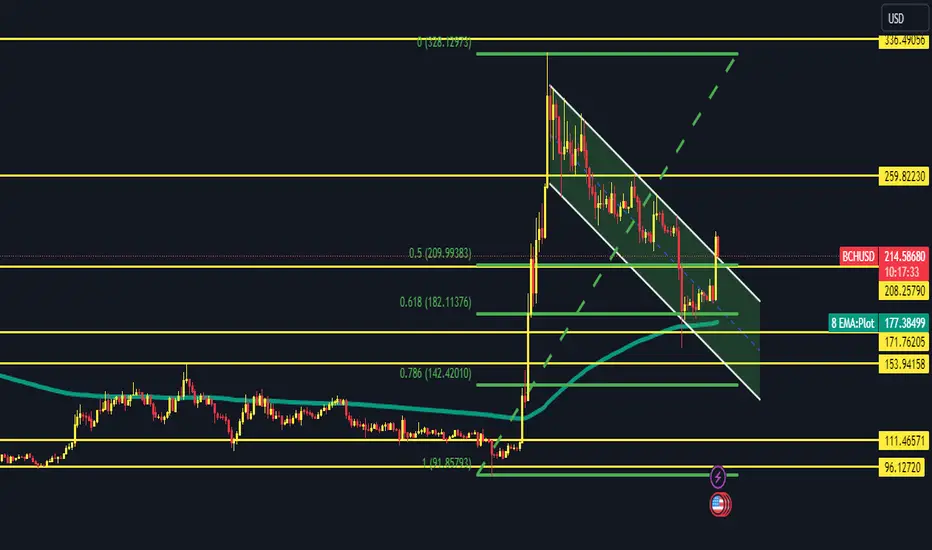
BCH target to $400+Yesterday, due to Grayscale winning a case against the Securities and Exchange Commission (SEC), the crypto market witnessed a surge in coin prices. Fundamentally, this was significant news that spurred the bulls into action, causing the price of Bitcoin to reach $28,000. During this time, an interesting pattern was exhibited by Bitcoin Cash. It broke through its resistance at $208 and closed the day at $225. In the prior crypto market downturn, Bitcoin Cash touched its 200 EMA and executed a successful reversal after retesting it. Notably, yesterday, Bitcoin Cash broke out of its Bull Flag pattern. According to the pattern, the anticipated target is around $400-$410. The Relative Strength Index stands above 50, and the Moving Average Convergence Divergence also displays a bullish crossover. Currently, Bitcoin Cash is being traded at $215 and is in the process of retesting the Bullish Flag trendline. An essential support level for Bitcoin Cash lies at $210. The 200 EMA serves as robust support, and it is imperative for Bitcoin Cash to maintain a close above this level.
Bitcoin Cash demonstrated its support at the 0.618 FIB level, approximately $182. At present, it is trading above the 0.5 FIB level. Sentiments are decidedly bullish for Bitcoin Cash, yet it remains crucial for the cryptocurrency to uphold its $180 support level.
Will Bitcoin Cash Price Cross $250?BCH Bounce: Bitcoin Cash made a significant recovery, bouncing from a crucial support at $180 to cross the $200 psychological barrier.
EMA Breakthrough: BCH successfully broke above the 50-day Exponential Moving Average (EMA), indicating a potential bullish trend.
Recent Performance: Over the last eight days, BCH has shown a strong 23.60% bounce from its 200-day EMA, suggesting underlying strength.
Resistance Ahead: BCH faces a supply challenge at $228, which coincides with the 38.20% Fibonacci retracement level.
Bullish Indicators: The daily Relative Strength Index (RSI) has shifted into the bullish territory, while the Moving Average Convergence Divergence (MACD) has signaled a bullish crossover.
Potential Upside: If BCH can sustain its momentum and break the $228 resistance, it has the potential to target higher levels at $258 and even $300.
External Factors: The upcoming Bitcoin ETF decision could significantly influence BCH's trajectory. A positive decision might further fuel BCH's rally, while a delay could pose challenges.
Caption from Detailed Technical Analysis Pointers:
🚀 #BitcoinCash Analysis Deep Dive! 🔍
BCH Bounce: From $180 support, now above $200! 📈
EMA Signal: Broke the 50-day EMA, bullish trend ahead? 🌟
Recent Surge: Strong 23.60% bounce off
Will It Cross $250?
Will BCH Price Cross $200?BCH's Rebound from 200-day EMA: Bitcoin Cash has bounced back from the 200-day EMA, indicating a potential reversal from the bearish trend.
Key Resistance at $200: BCH is challenging the $200 resistance level. A successful breach could lead to a price target of $228 or even $258.
Historical Performance: After a 200% rally in June, BCH saw a significant correction, dropping below $200. Despite this, its YTD growth stands at 99.18%.
Current Trading Price: BCH experienced an 11% bounce from the 200-day EMA but faced resistance at $200, causing a 3.07% drop. It's currently trading at $191.57.
RSI Indicator: The daily RSI has moved out of the oversold territory, hinting at potential bullish momentum.
External Factors: The upcoming deadline for Blackrock and Grayscale Bitcoin ETF could act as a catalyst for BCH's price movement.
Correlation with Bitcoin: BCH's price movement is closely tied to Bitcoin's performance. A potential recovery in Bitcoin could benefit BCH, pushing it towards $228 or $258.
Potential Downtrend: If Bitcoin drops below $26K, especially with delays in SEC's Bitcoin ETF approval, BCH could see a decline. A drop below $180 for BCH might lead to a further decline to $150.
Can 200-day EMA Be the Springboard for Bitcoin Cash?Silver Lining: BCH steadies its price at the 200-day EMA after a significant fall, suggesting a potential solid support and buying zone.
Market Resilience: BCH remains stable over the past week, largely unaffected by the broader market sell-off.
Key Support Levels: Both the 200-day EMA and the 61.80% Fibonacci level at $180 indicate strong investor confidence in BCH.
YTD Gains: BCH boasts an impressive 96% year-to-date gain, outperforming many major altcoins.
Decline from Peak: A 42% decline from its 2023 peak raises questions about BCH's future trajectory.
Technical Indicators: The daily chart's Stochastic RSI and RSI hint at a potential comeback from oversold conditions.
4H Chart Analysis: A double bottom pattern seems to form around $180, with a $190 neckline, suggesting a bullish trend.
Bullish Divergence: The 4H RSI shows a bullish divergence, increasing the likelihood of a positive breakout.
Potential Reversal: Technical signs point to BCH preparing for a reversal, possibly surpassing the $200 mark and aiming for $228 (the 38.20% Fibonacci level).
Downside Risk: If BCH dips below $175, it could further decline towards $150.

BCHUSDTRisk warning, disclaimer: the above is a personal market judgment based on published information and historical chart data on Tradingview, all analysis is only subjective. Hope investors consider, that I am not responsible for your investment decision.
Thank you.
Good luck
downtrend structure still valid at m15To sell, first of all we need to make sure the price has made a downtrend structure which is H-L-LH-LL. Next, make sure the price does not exceed the LH level which shows that the price still has the strength to go lower. Next we can enter with a risk reward ratio of at least 1:1.
the price has broken the trendline, however, the price has not yet been able to rise above the LH, so we still consider the price to go down further.

Bitcoin Cash price gives a bearish breakdown of a falling channe
Bitcoin Cash price gives a bearish breakdown of a falling channel, with an intense rise in selling pressure.
The breakdown rally approaches the 200-day EMA, with buyers hoping for a reversal.
Market-wide FUD crashes altcoins, leading to a 20% drop in BCH price, breaking under the 50-day EMA.
At the confluence of the 200-day EMA and the 61.80% Fibonacci level, a lower price rejection shows a resurgence in buying pressure.
The downfall from the 50-day EMA to the 200-day EMA increases trading volume, reflecting a boom in the selling spree.
BCH coin price forms a Doji above the 61.80% Fibonacci level, projecting a potential reversal opportunity.
Technical indicators show a rise in underlying bearish sentiments, with bearish MACD histograms resurfacing.
The confluence of the 61.80% Fibonacci level and the 200-day EMA at $175 provides a bounce pad for BCH price.
If prices manage a reversal, BCH price can reach $228; a downfall below $175 will crash the price to $150.

Bullish Flag on Bitcoin Cash: Are We Going to the Moon?I observed a possible trend continuation on BINANCE:BCHUSD.P
It broke out of the local resistance level, then it is forming a bullish flag pattern at the top of the trend, this is a possible signal for bullish continuation if BCH is able to break out of the flag channel.
Do you think that BCH will continue with the recent uptrend?
Share your thoughts with me in the comment box.
Don't forget to follow me now for more insightful technical analysis.

BCH continuationA break above the latest area of supply from 220-250$ would confirm a potential move towards 300$. On the other hand, if price contines to respect 220$ and close below it, BCH can continue to drop towards 180$ and even lower.

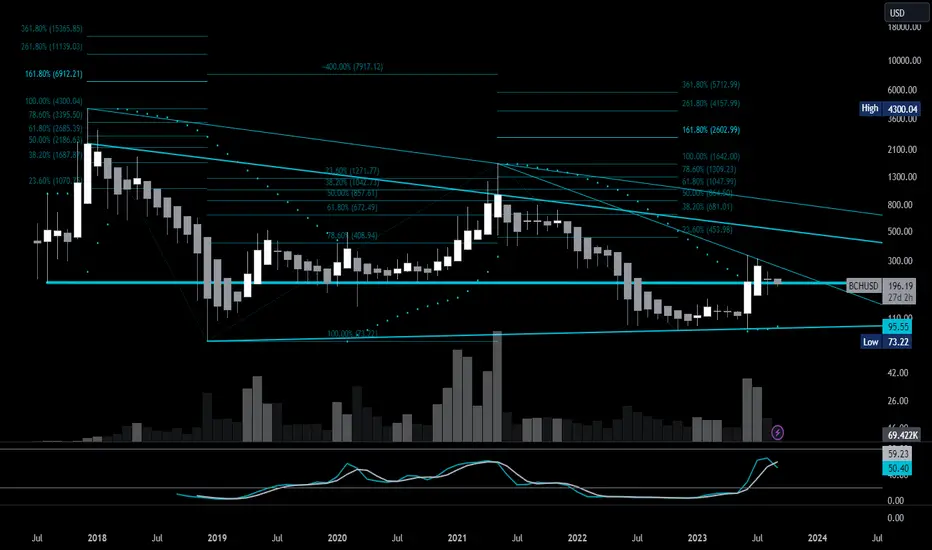
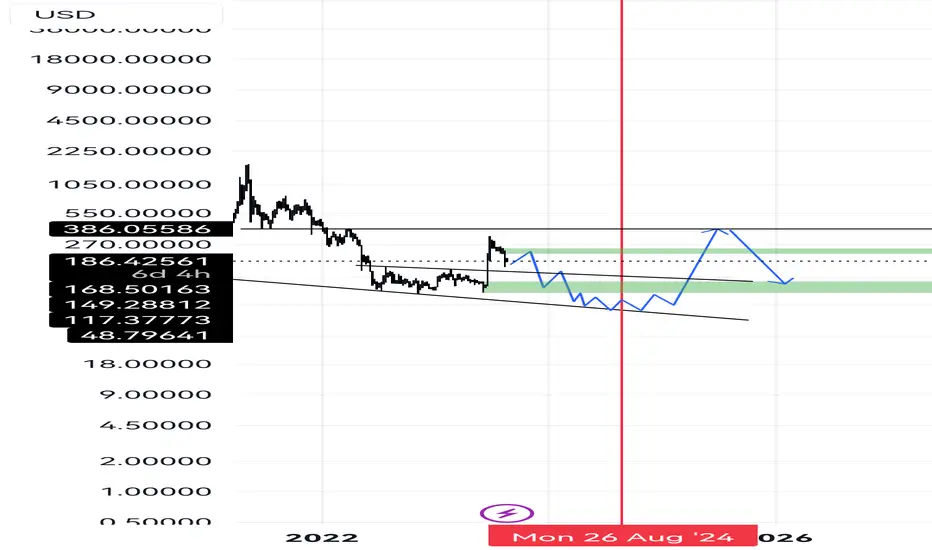
Bitcoin Cash AccumulationBitcoin Cash Accumulation broke below the zero line in June 2022 and consolidated around there for 6 months. BCH/USD Accumulation broke above the zero line in January 2023 and consolidated around there for 6 months. Now, after 12 long months, BCH/USD Accumulation jumped to the + 1 million Accumulation line over the past few days. Based on this BCH/USD Accumulation my long term price targets are in a wide range from 239 - 619 based on BCH/USD price discovery history angle of trajectory. I think it's likely 239 will act as resistance until it becomes support afterwards.
