BCH MOONSHOT!! ITS CYCLE IS BEHINDBch will follow the last cycle of LTC, ETH, BTC. BCH is next in line on its cycle.
BCH= FREEDOM CURRENCY
BCHUSD trade ideas

BCH - 1st and 2nd TPs Have been Reached!!I have been short BCH from 138.50. This was a short-term trade just to pocket a few bucks. My targets were 111.00 (1st TP) and 107.00 (2nd TP) zone respectively. These two zones were successfully reached.
Check out my previous analysis in the RELATED IDEAS section below.
PRICE ACTION AND PATIENCE ARE KINGS!!!

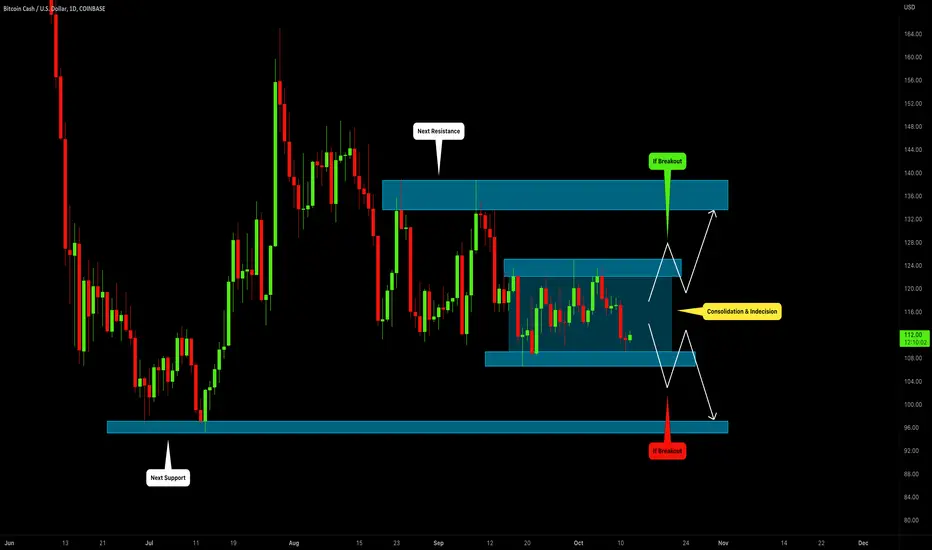
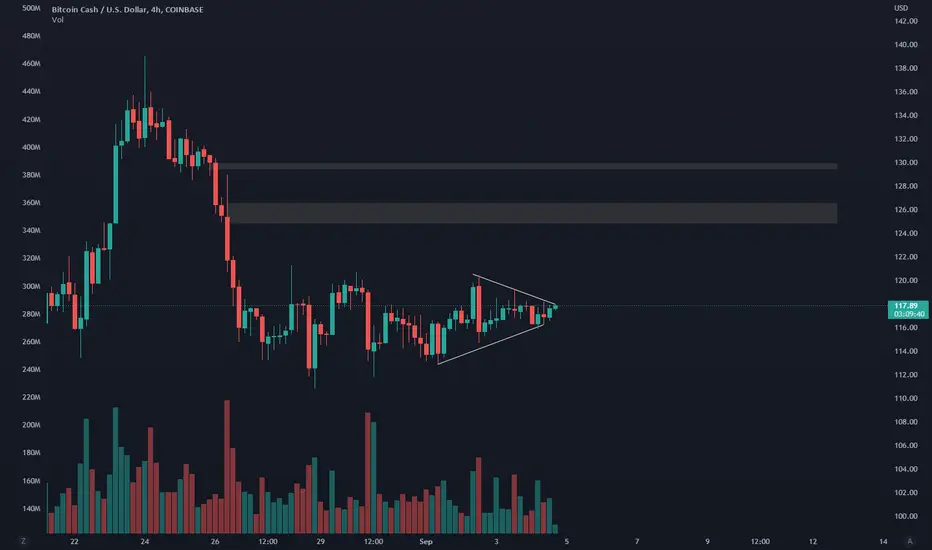
Bitcoin Cash (BCHUSD): Consolidation & Indecision
Very peculiar situation on Bitcoin Cash:
the price is currently consolidating within a horizontal trading range.
122 - 125 is its resistance.
106 - 109 is its support.
To catch a bearish continuation, wait for a bearish breakout of the support of the range.
We need a daily candle close below that to confirm the breakout.
A bearish continuation will be expected to 97 level then.
To catch a bullish move, we need a daily candle close above the resistance of the range.
Then, a bullish continuation will be expected to 134.
Wait for a breakout and then follow the market.
❤️If you have any questions, please, ask me in the comment section.
Please, support my work with like, thank you!❤️
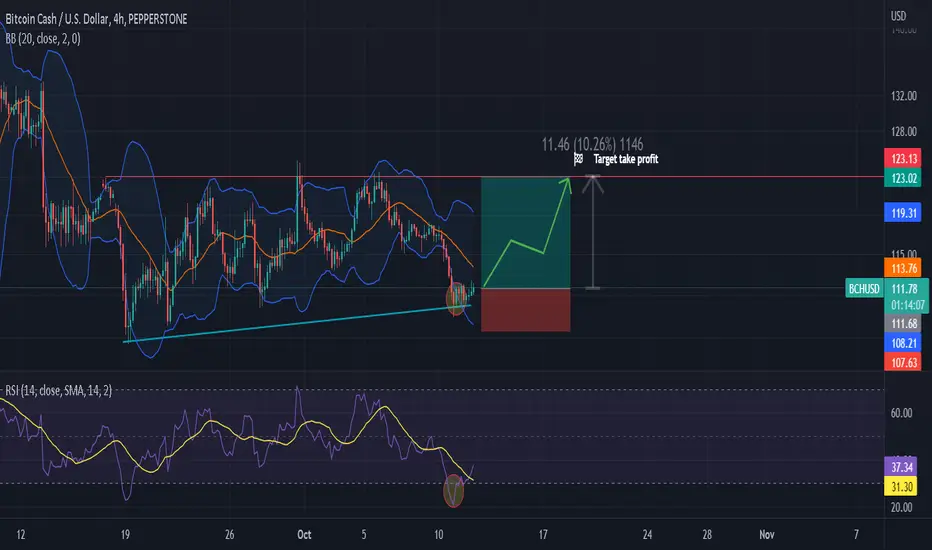
BCHUSD - Long Position - OversoldLooking at the chart of BCHUSD we can see an oversold condition on 4h timeframe which means a long position is possible.
Following the Bollinger Bands and the RSI 14 we can see the price has touched the lower band and the RSI has been below 30.
The aim is to take profit at the resistance line shown in the chart.
All further details are shown on the chart.
Goodluck!
crypto usually dips 7-10pm est patternI'm not sure what the reasoning is behind this, but I noticed a pattern that crypto usually dips 7-10pm est. Do your own due diligence, your risk is 100% your responsibility. You win some or you learn some. This is for educational and entertainment purposes only. Consider being charitable with some of your profit to help humankind. Good luck and happy trading friends...
*3x lucky 7s of trading*
7pt Trading compass:
Price action, entry/exit
Volume average/direction
Trend, patterns, momentum
Newsworthy current events
Revenue
Earnings
Balance sheet
7 Common mistakes:
+5% portfolio trades, risk management
Beware of analysts motives
Emotions & Opinions
FOMO : bad timing
Lack of planning & discipline
Forgetting restraint
Obdurate repetitive errors, no adaptation
7 Important tools:
Trading View app!, Brokerage UI
Accurate indicators & settings
Wide screen monitor/s
Trading log (pencil & graph paper)
Big organized desk
Reading books, playing chess
Sorted watch-list
Checkout my indicators:
Fibonacci VIP - volume
Fibonacci MA7 - price
pi RSI - trend momentum
TTC - trend channel
AlertiT - notification
tradingview.sweetlogin.com

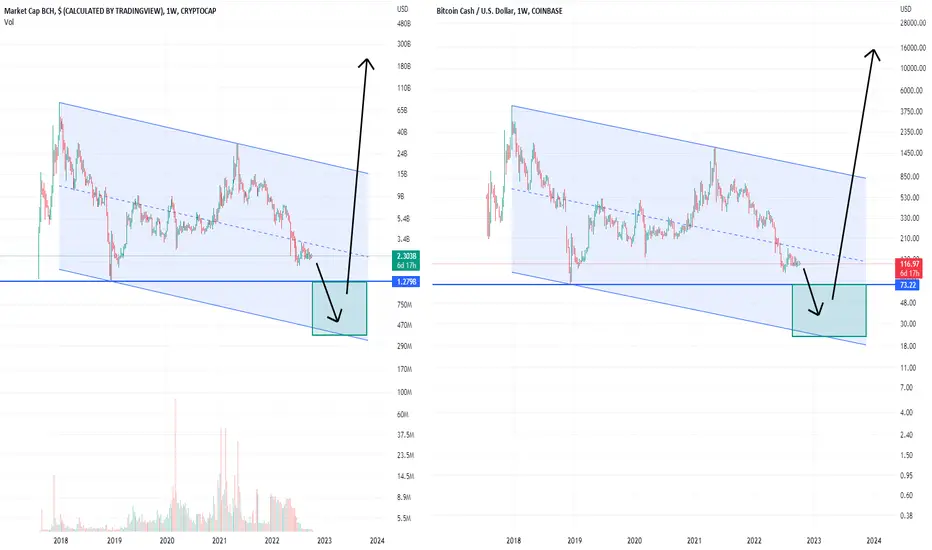
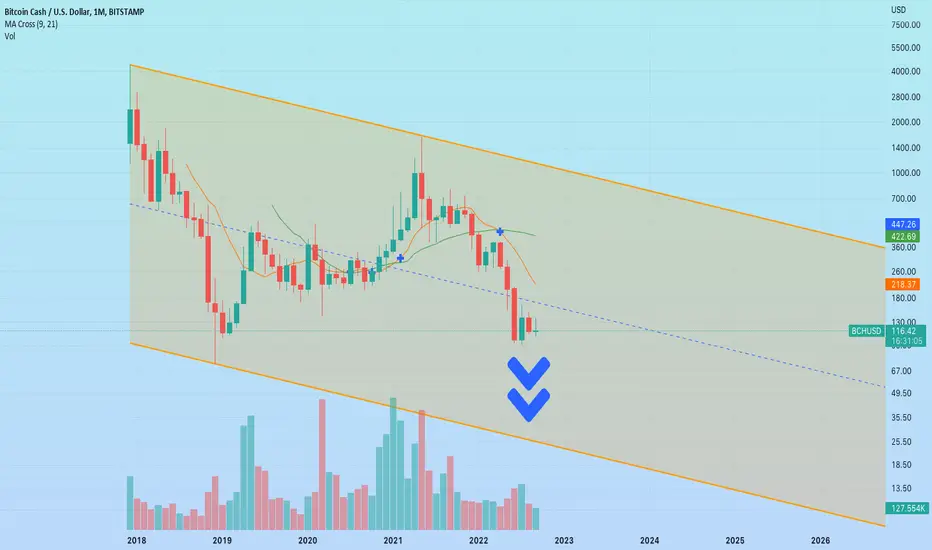
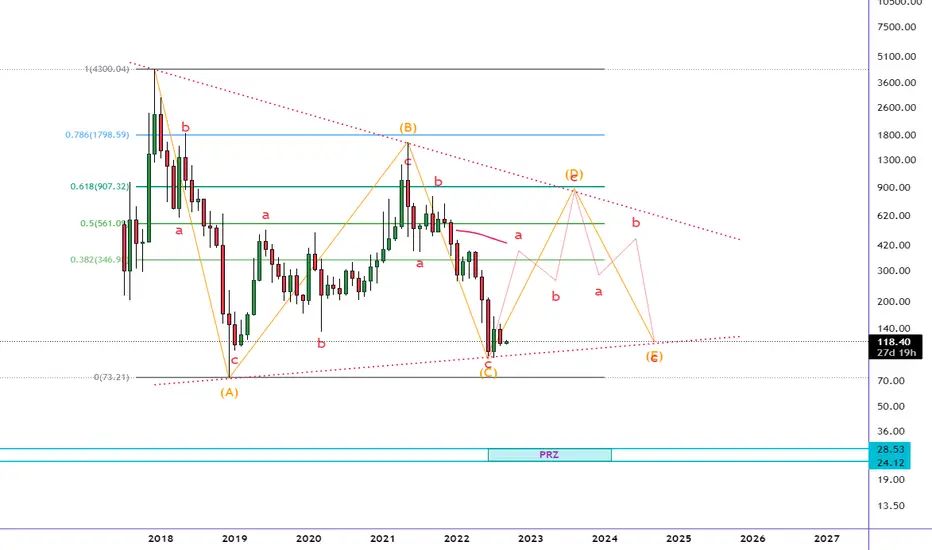
Alternative BCH (Bitcoin Cash) TheoryThis is my alternative bitcoin cash idea. Break the lows on the market cap and price before starting anew cycle.

bchusd longits good after consulidation and after break the consulidation it will go up .
i hope this will happen .
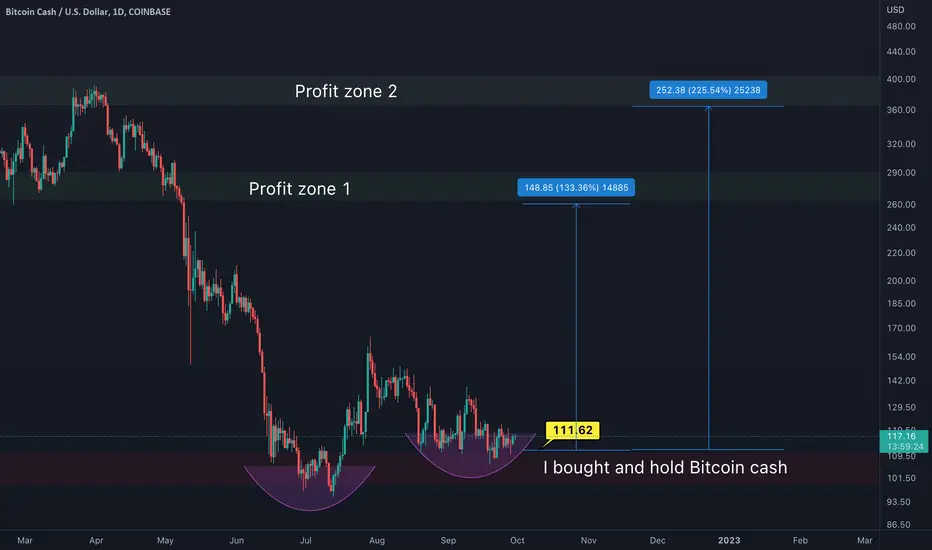
BITCOIN CASH WARNING BULL🔥🔥🔥I bought bitcoin cash. The reason is that the price is very cheap and it is worth my purchase. The price of this asset is very low now and we are facing an upswing that will give good returns in the future

BITCOIN CASH WARNING BULL🔥🔥🔥I'm currently considering buying bitcoin cash. The price of this asset is very low now and we are facing an upswing that will give good returns in the future
BCH. Experiment failed. Smart contracts won't help. Slow death.Experiment failed. Smart contracts won't help. Slow death.
$BCH Looking To OUTPERFORM It's Peers- Bulls? WYA?+Just a update on BCH, We did have a nice move up and attempted to brute force that KEY area, but the Bears weren't having it and we took a shot down... Although, BCH is about to VALIDATE that last low and really start to dig its feet in and start pushing possibly. Both Indicators are showing at Hidden Bullish Divergence at the pattern completion zone @ the 886, This is textbook and from strictly technical analysis, this following the same parameters in recent history before a next leg up... Pushing past that Supply Line will let this thing RIP

BCH Back Testing Key AreaBCH looking pretty good here. She is following the technicals to a T. IF BCH can claim previous resistance as new support, the upside is inevitable. This is exactly want you want to see. Picture perfect.

BCH Outlook - Bearish SentimentBCH is falling just as expected. Price is now at the 120.00 zone. My targets are 111.00 and 107.00. Price will first retrace back to the 131.00 zone before collapsing to my desired targets.
Patience is everything is trading and investing.
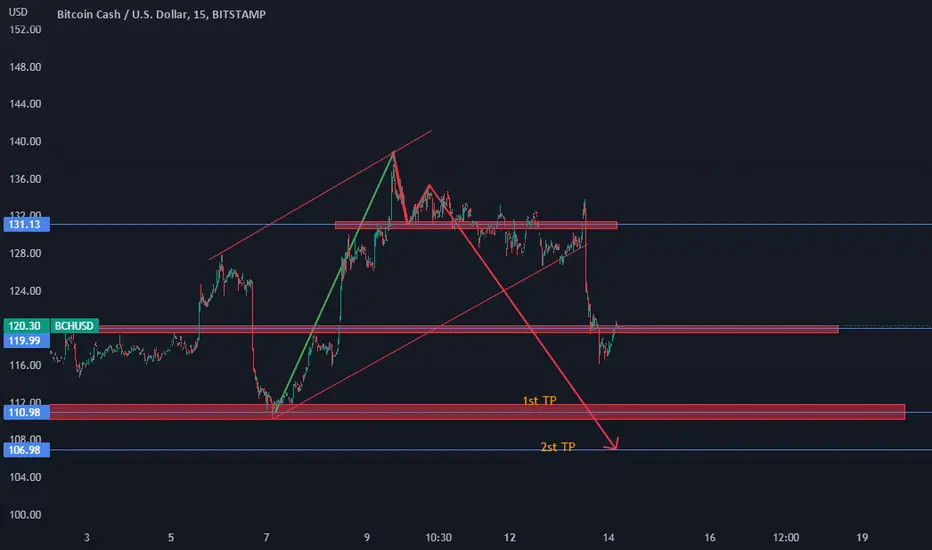
BCH Outlook - Bearish Sentiment Price has successfully broken the 131.00 zone. We remain patient until price drops to 111.00. So far so good. We are in deep profits.
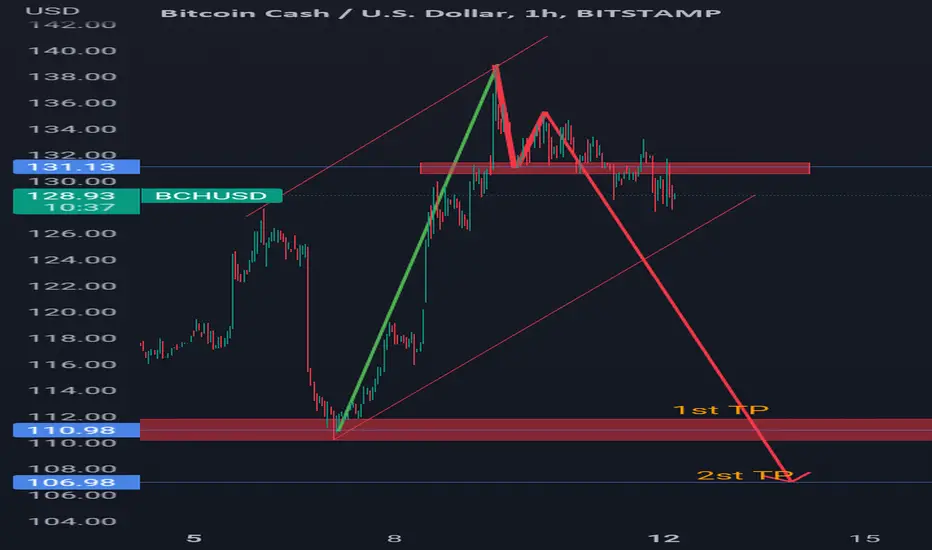
BCH Outlook - Potential Bear MoveBCH is showing signs of falling to the 107 zone. We are currently placing sell trades. My 1st TP is at 111.00. 2nd TP at 107.00. The 2nd TP is placed there because market-makers tend to push price below a zone to trap traders before moving price their way. In this case, SELLERS will get trapped at 107 if the 111 zone is broken. I want to be out when this happens.
Patience is key!!

Bitcoin Cash / BCH - A Dark Horse During Crypto MeltdownAfter that whole BCH Satoshi's Vision debacle, there is no longer any primordial Bitcoin remaining. BCH was once something to put some stock in, as it really did embody the original meaning of "Peer-to-Peer Electronic Cash" as defined in the original whitepaper.
But like all things in this chaotic world, it was ruined and undermined. Fundamentally, the problem is people's hearts and people's morality. Nobody made the entire community go along with ghosts. People chose to do that, rather than uphold what is righteous, because inside, they aren't good, and they align with evil.
The same can be said for the recent commencement of censorship on the Ethereum protocol. You all want to be a part of globalism, aka communism, and so one will have to eat the bitter fruit they sow for themselves come harvest.
You shouldn't have faith in digital currencies, because they're all set to be eliminated. Whether mankind returns to tradition in this life and real money returns or not, the reality is, central bank digital currencies are on their way, and they won't be built using BTC or Ethereum. They will be proprietary, government-controlled networks, just like SWIFT.
Regardless, BCH trades like wet paper towel, because after being gutted, it's just another trashcoin. Except it's a trashcoin that never pump and dumps. It's slow, heavy, dull, clumsy. While Ethereum is running wild, BCH is there, well, sideways. If you hold your breath for a few days you can make 5%, sometimes.
But notable is that BCH opened 2022 around $430.55 and spent two days above the opening price before cratering completely, and all these months of bear market, BCH hasn't printed a single bull trap/bear wrecker wick upwards.
Frankly, I think there's a high probability that BCH just turns around and dies back towards the all time lows of $73. In the end, BCH will trade for like $6, and that day isn't very far away.
But before we go on a suicide mission to sub-$50 and then sub-$10, the market makers will need to sell some bags at very high prices to people who think numbers like $1,400 and $4,000 will ever return to this thing that was created simply so the Chinese Communist Party-linked mining networks could print something out of thin air that would be useful for laundering USD fiat through South Korea's exchanges.
At present, what I see is that the BCHBTC pair made an all time low in July, bounced, broke a June high, and has since shown some strength and consolidation instead of acting like it wants to head for even lower prices.
In terms of BCHBTC, there is unfinished business way up at a 400% run over 0.02, but a more realistic gundown target composed of the November and December 0.01~ double top.
I would expect that if the BCHBTC pair goes on a 2x or a 4x run, it'll happen while BTC is on its way to $15,000, a call I made in July that has proven rather accurate so far:
Bitcoin - An Unimpressive Climax
And while Ethereum is headed back to three digits, all of which I expect to happen, and quickly, in the next week:
Ethereum - The Hard Reality
Thusly, although I would really like to see BCH make a mess of things and go for a run at $400, the multiplication on what the BCHBTC pair can do and the price of BTC means that BCH is likely to have a far more impotent run North, which actually makes a lot of sense, considering what a ball and chain this thing trades like.
Anyways, I suspect that BCH will dump more in terms of USD, into the $105 range and set up a bear trap. It may even wick $99 or $98 again, but if it's going to be bullish, it should not break the July lows.
Don't get caught in the trap, and stop putting your faith in crypto. If you want to find out what will happen to crypto exchanges in the future, acquaint yourself with what happened to Full Tilt Poker and Pokerstars in 2011.
The Federal Reserve's FOMC minutes have addressed "stablecoins" more than once. This industry is on the government's radar, and enforcement is coming very, very soon, because proper CBDCs need to be ushered in.

BCH Long idea There are two approaches for this one. First is a retracement to the blue box and taking position from there which is risky one and the second is when the price retests the green box that is rather safer then the first approach. I am targetting a small consolidation point up there but you should consider partially taking profits on the way since it is safer.


BCHUSD BreakoutI'll keep this brief because I expect this move to happen very soon. High certainty that BCH will break out. Targets are on the chart.
BCH Potential Bump and Run Reversal BottomThis Pattern is unconfirmed until BCH Breaks above thte Validation Line but right now could be a nice place to try to get in early in anticipation.

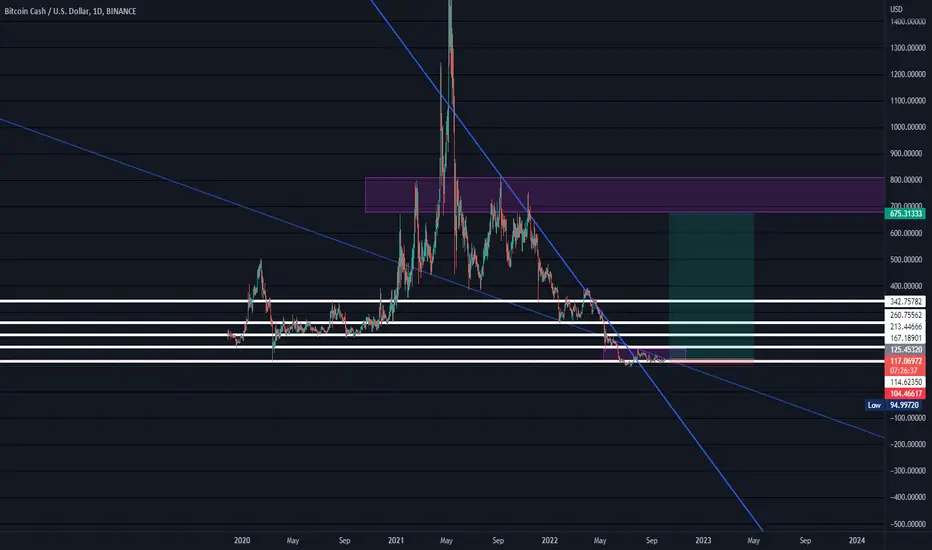
Descending TriangleAll triangles are neutral until a trendline is broken.
2nd Descending triangle down here.
The other on broke to the upside.
Bottoms inside triangles denoted with blue stars.
No recommendation
