BCHUSD D4: 600% gains BEST LEVEL TO BUY/HOLD(SL/TP)(NEW)Why get subbed to me on Tradingview?
-TOP author on TradingView
-2000+ ideas published
-15+ years experience in markets
-Professional chart break downs
-Supply/Demand Zones
-TD9 counts / combo review
-Key S/R levels
-No junk on my charts
-Frequent updates
-Covering FX/crypto/US stocks
-before/after analysis
-24/7 uptime so constant updates
🎁Please hit the like button and
🎁Leave a comment to support our team!
BCHUSD D4: 600% gains BEST LEVEL TO BUY/HOLD(SL/TP)(NEW)
IMPORTANT NOTE: speculative setup. do your own
due dill. use STOP LOSS. don't overleverage.
READ ENTIRE IDEA BEFORE EXECUTING.
🔸 Summary and potential trade setup
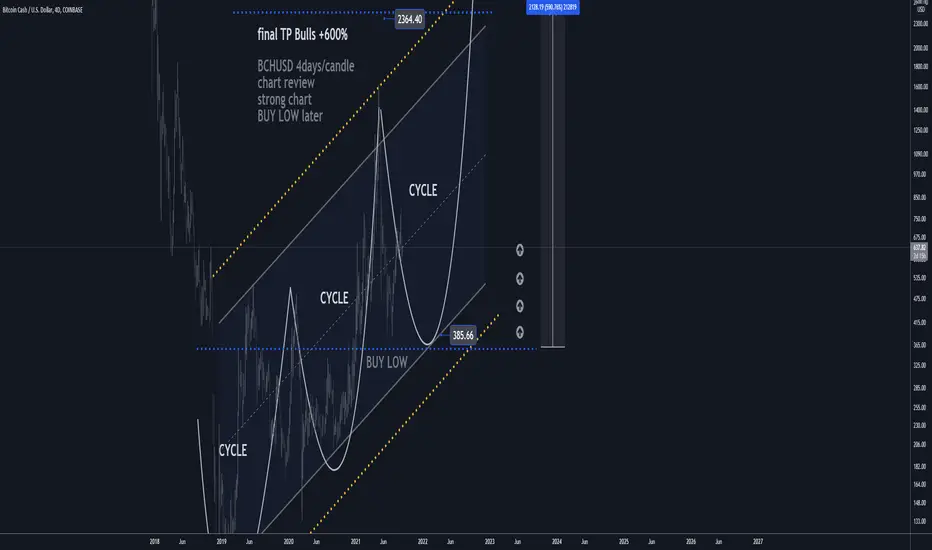
::: BCHUSD 4days/candle chart review
::: updated outlook still valid today
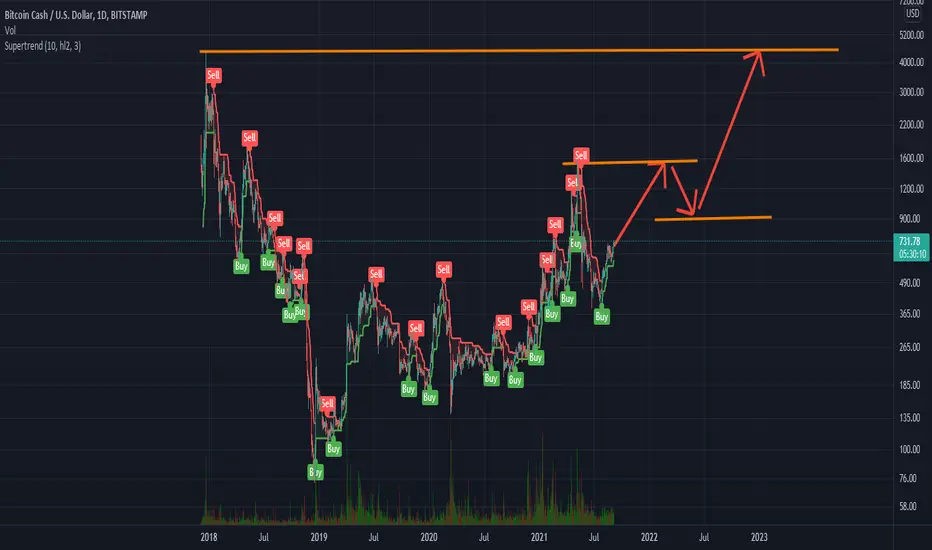
::: CORRECTION MODE next 4-8 weeks
::: correction just started not OVER
::: chart is LOG SCALE
::: get ready to BUY LOW later
::: BUY LOW near 400/380 USD
::: entry - after 40% CORRECTION
::: up to 600% gains possible later
::: short-term pullback/correction
::: SPECULATIVE SETUP
::: do your own due dill
::: and use proper risk management
::: TP bulls is +600% gains
::: details: see chart
::: FINAL TP is 600% gains
::: recommended strategy: BUY/HOLD after pullback
::: TP BULLS +600% gains 2400 USD
::: SWING TRADE: BUY/HOLD IT
::: bull run not over yet
::: good luck traders!
::: BUY/HOLD and get paid. period.
🔸 Supply/Demand Zones
::: N/A
::: N/A
🔸 Other noteworthy technicals/fundies
::: TD9 /Combo update: N/A
::: Sentiment mid-term: BEARS/CORRECTION
::: Sentiment short-term: PULLBACK/CORRECTION NOW
RISK DISCLAIMER:
Trading Crypto, Futures , Forex, CFDs and Stocks involves a risk of loss.
Please consider carefully if such trading is appropriate for you.
Past performance is not indicative of future results.
Always limit your leverage and use tight stop loss.
BCHUSD trade ideas
BitcoinCash to Retest 550Trend Analysis
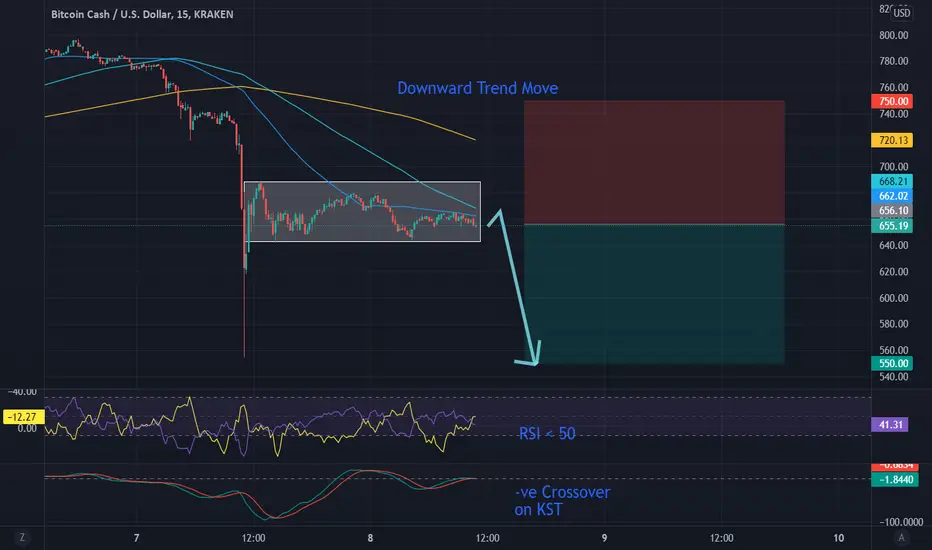
The main view of this trade idea is on the 15-Min Chart. The cryptocurrency BitcoinCash (BCH) remains in a downtrend in the short term. The cryptocurrency has been trading between a range of 670 and 640 over the last couple of trading sessions. Expectations are for BCH to break below this range and retest 550 support, 15.9% away from current price levels at the time of publishing. To negate this move, BCH will have to travel higher towards 750 in the short term.
Technical Indicators
The crypto currency is trading below its short (50-MA), medium (100-MA) and long (200-MA) fractal moving averages. All MAs are trending lower with the 200-MA above the 100 and 50 MA respectively. The RSI is also below 50 and the has been a recent negative crossover on the KST. All these indicators imply a move lower on BCH.
Recommendation
The recommendation will be to go short at market, with a stop loss at 750 and a target of 550. This produces a risk/reward ratio of 1.13
Disclaimer
The views expressed are mine and do not represent the views of my employers and business partners. Persons acting on these recommendations are doing so at their own risk. These recommendations are not a solicitation to buy or to sell but are for purely discussion purposes. At the time publishing, I have a position in BCH.
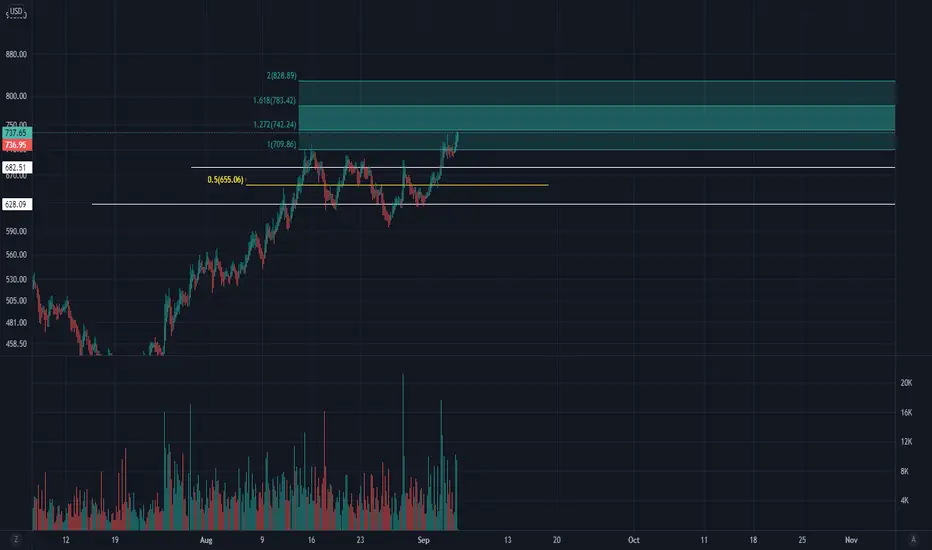
Bitcoin Cash Up 3.74% from PreliminaryBCH has given me a 3.74% return in 2 days. This is based on a 712.12 preliminary entry I took on 9/3.
Prognosis: After the 1.0% Fibonacci was tested and passed, BCH barrelled through to the 1.272 with resolve, where it now sits. I suspect a small consolidation is in order on .272% if it doesn't retrace back to the 1.0 first.
*Professional Wyckoffian VSA crypto swing trader (since 2017). I regularly seek out the most lucrative swings on all the major exchanges.
All my charts are clean, straightforward, and easy to follow. No junk, no needless indicators, just solid volume spread analysis ( VSA ) and 'take-the-money-and-run' Fibonacci target zones.
I go after the runners and big money. My win rates are between 80-85%. Follow me on TradingView and see for yourself.
I review over 300 coins & tokens daily and handpick all the runners myself (no bot signals).
** Not financial advice. Trade at your own risk.
BCH is preparing to LAUNCH!chart reminds me of the ENJIN one before it went completely crazy up. It appears to consolidate inside a huge range.
once the diagonal resistance will be broken this coin will fly..
I hope you found the idea interesting:)
MY MINIMALIST ANALYSIS OF $BCH9.13.21
My Minimalist Analysis of $BCH
Has Touched our support area and bounced several times. About ripe for the picking.
Indicated are key levels of support and resistance using small and large trading range boxes for ENTERING A SWING TRADE (Short - Long.)
Watch out for Patterns, Divergence, EMA, Candlestick Math, and your Fibs.
Further Analysis on price action is required on a 1HR-4HR chart when entering or closing a trade, depending on your risk appetite and trading style.
Disclaimer:
The findings/predictions of the following analysis are the sole opinions of the publisher of this idea and must not be taken as investment advice.
Thank You for your appreciation and support.

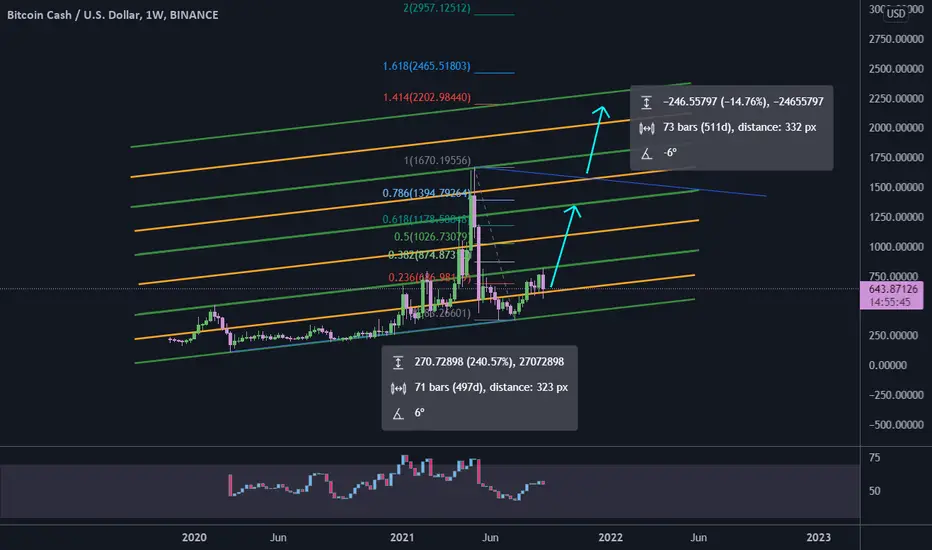
BCH parallel channels#BCHUSD
as you know I like parallel channels 😊
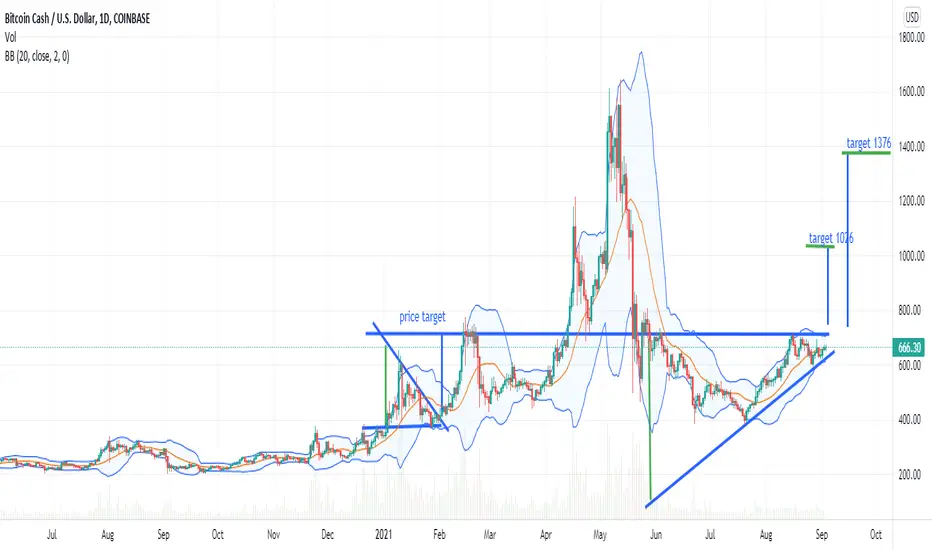
the fibonacci retracement and angle give me a target for $BCH around $1400, that is the same as a line of parallel channels.
if #BCH going to complete AB=CD pattern then price has to break the descending angle line and head up toward 1.414 fib level around $2200, which is the upper line of the fourth parallel channel.
BCH Update - MACD crossed bullish on the weekly!Before reading, get rid of your moonboy mentality and no emotions for dips/corrections! Cannot rule bearish scenarios! Dips are for buying!!
People are so focused on the hourly/daily timeframe that they get emotional on every dip! Take a step back to the weekly/monthly timeframe and see why I'm so bullish now. Stop looking at the short term dips/rise. Short term is irrelevant for the move that is coming!
You can't be emotional in these markets (stocks, forex, crypto, real estate, etc.). You will lose this game following the news and doing what the majority does. News creates emotions. Everything you need to know are on the charts. News are manipulated by the elites, and they take advantage of our emotions. Stop listening the news and pay more attention to the charts. Don't follow the majority, because the majority will lose in the end! Also, don't buy the hype when everyone is buying.. instead buy the fear when everyone else is selling
Everything is on the chart! Cryptocurrencies are on the verge of exploding higher. Dips/Corrections are normal and needed in a bull market, and are buying opportunities! Huge gains opportunity in the coming months! Never trade blindly. Use multiple indicators to make calculated decisions. Trade with no emotions!
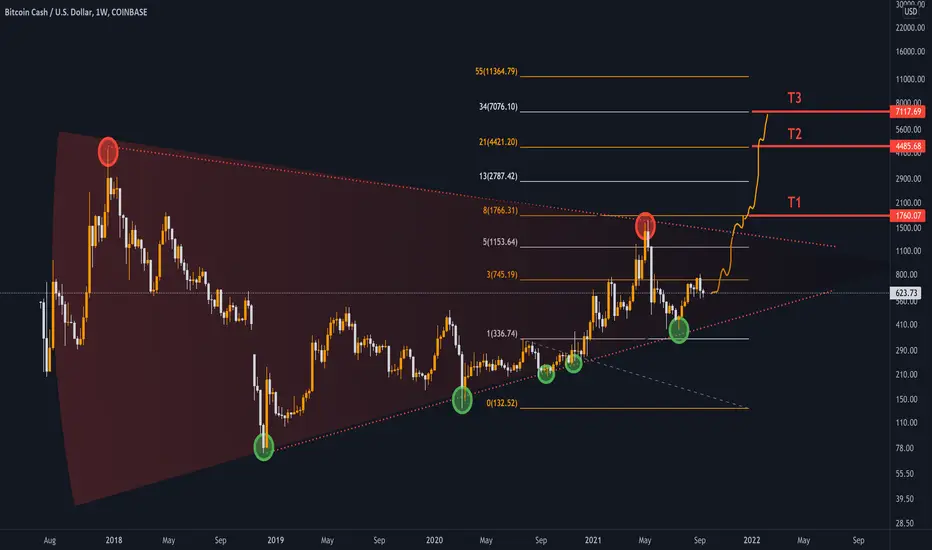
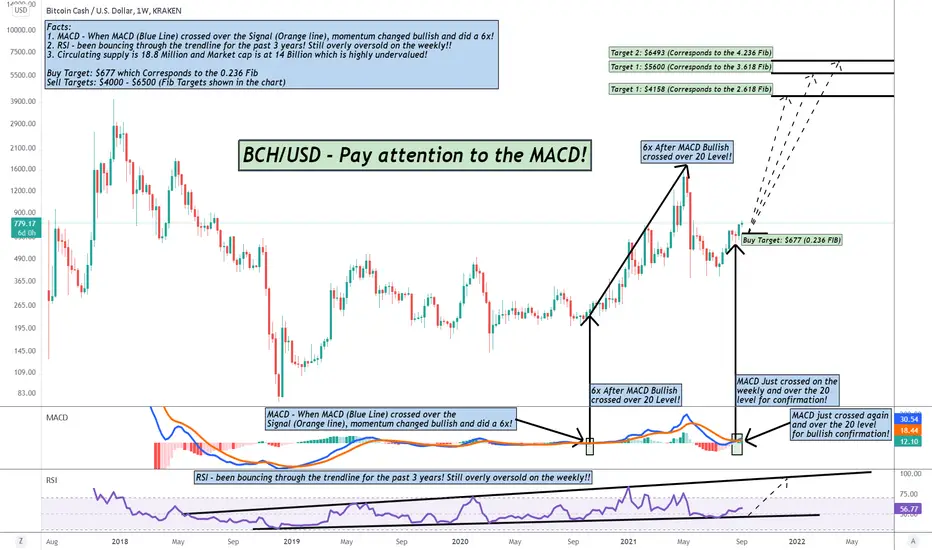
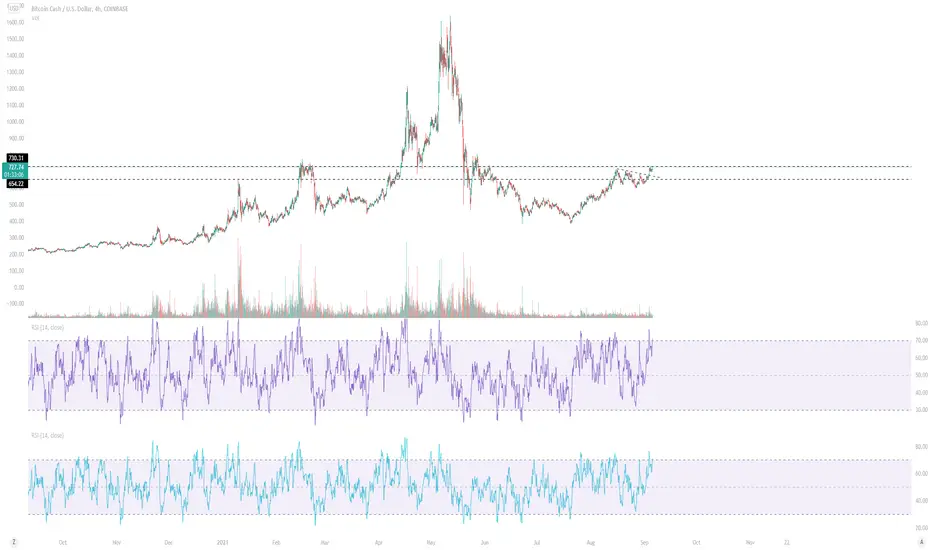
Facts:
1. MACD - When MACD (Blue Line) crossed over the Signal (Orange line), momentum changed bullish and did a 6x!
2. RSI - been bouncing through the trendline for the past 3 years! Still overly oversold on the weekly!!
3. Circulating supply is 18.8 Million and Market cap is at 14 Billion which is highly undervalued!
Buy Target: $677 which Corresponds to the 0.236 Fib
Sell Targets: $4000 - $6500 (Fib Targets shown in the chart)
"If you can't beat the fear, do it scared!"
"Be fearful when others are greedy, and greedy when others are fearful!" - Warren Buffet.
"Markets are a device for transferring money from the impatient to the patient. - Warren Buffet
"Show me the charts, and I'll tell you the news." - Bernard Baruch
"The secret to investing/trading is figuring out how rich you want to be and how poor you're willing to become."
if you want to live like the 5% of the population who are hugely successful, then don't act like the 95%!
Bitcoin Cash late to the partyIs BCH ready for a breakout?
BTC looks like it's going to continue upwards for a bit longer which is giving alts more time to breath.
BCH has been a little late to the party but it could be on the verge of a big break out.
The last time it broke through this level we saw it double in price. Can we see that again?
There appears to be a clear path with only resistance near 1100.
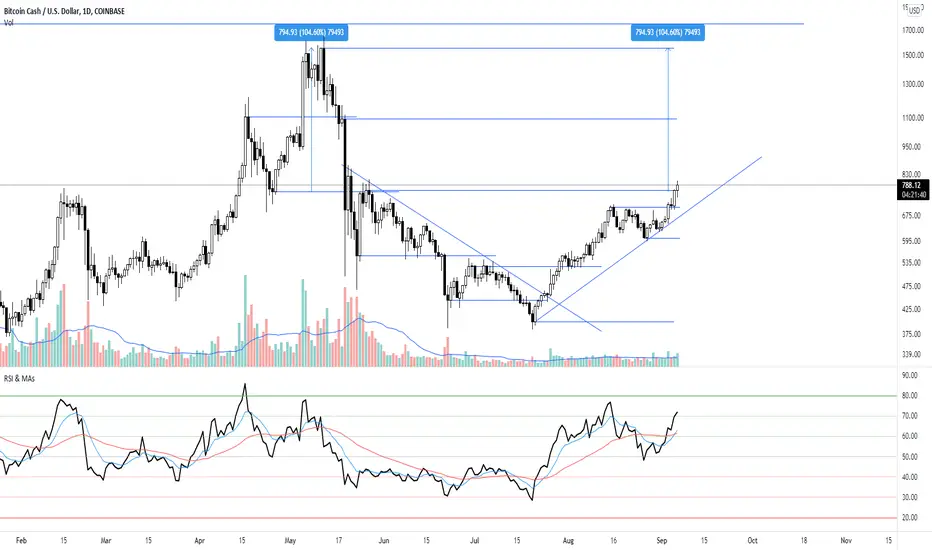
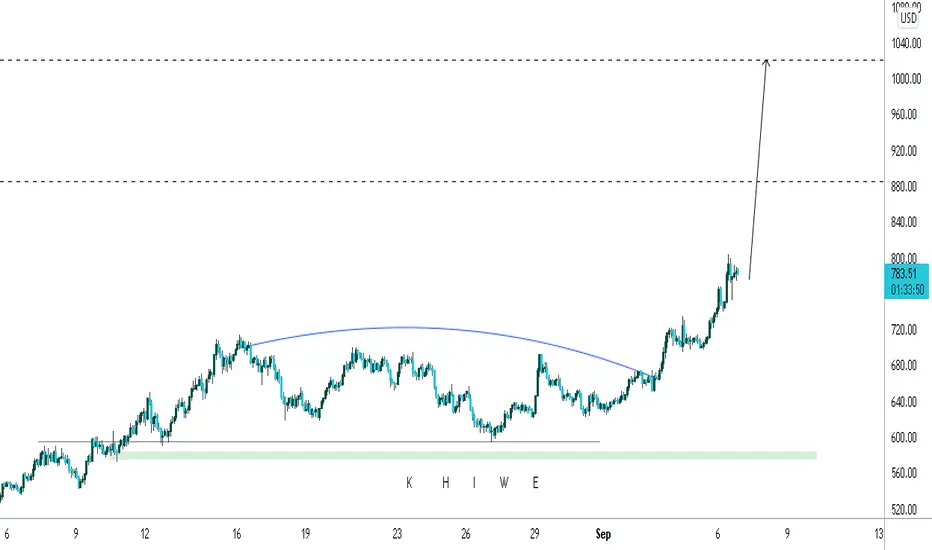
BCHUSD Climbing Support, ForecastBCHUSD is on the rise towards 885.77 above 802.66 High, – our bias is 1021.52.
* There is nothing to complain about. What must happen will happen. While there is still time, learn as much as you can and do your research before all these free online resources disappear, now, before the rise of the gurus. Trading is your personal business, and you are alone. There is no point to compare your charts to anyone or compete for popularity.
:)
.
Khiwe
On this profile page, the shared analysis, ideas, and also, the strategy of a chart belong to Khiwe with some being influenced. The technical set-ups are speculative, they are not guaranteed for accuracy or completeness in the form of any content; -it is not to advise on financial markets. Please apply your own analysis and confirm it with price action.
BCH - target 900-1000 in the coming daysHello everybody!
BCH looks like it's a little bit late to the party. Is it?
Info in the chart.
Good luck with your trades.
Sisif

BCHUSD SellThis is my idea on BCHUSD pair.
What do you guys think?
Harmonic Pattern: Gartley Bearish

BitcoinCash is Expected to Breakout and Head Towards 770Trend Analysis
The main view of this trade idea is on the 15-Minute Chart. The cryptocurrency BitcoinCash (BCH) has been in a rangebound movement over the last couple of days between the 695 and 735 price levels. Given the current uptrend, expectations are for a break above the top of the range. Given the width of the range, a target a little above 770 is targeted for the cryptocurrency. These expectations will be negated will BCH fall towards 675.
Technical Indicators
BCH remains above its long term 200-SMA despite being in a rangebound movement over the last couple of days. Its Awesome Oscillator (AO) is above 0 and green while the Directional Movement Indicator (DMI) is in a positive zone, with the positive DMI being greater than the negative DMI. These technical indicators support the view of a breakout at the top of the range.
Recommendation
The recommendation will be to go long at market. Stop loss will be set around the 675 price level with a target of 772.50. This produces a risk reward ratio of 1.57.
Disclaimer
The views expressed are mine and do not represent the views of my employers and business partners. Persons acting on these recommendations are doing so at their own risk. These recommendations are not a solicitation to buy or to sell but are for purely discussion purposes. At the time publishing, I have a position in BCH.

BCH Soon to touch ATH and see new Higher highs - within 2021Bitcoin cash going ATH and see new Higher highs within this year. This has easy 5x capability within this year and has good fundamentals.
New projects like Smart BCH, cash fusion, and many more will get BCH to its new ATH and above..

BCH Soon to touch ATH and see new Higher highsBitcoin cash going ATH and see new Higher highs within this year. This has easy 5x capability within this year and has good fundamentals.
New projects like Smart BCH, cash fusion, and many more will get BCH to its new ATH and above..

MY MINIMALIST CHART ANALYSIS FOR $BCH9.4.21 $BCH Minimalist Analysis for a Short to Mid-Term Swing trade.
Watch for patterns, EMA, and your Fibs.
Further Analysis on price action is required
depending on your risk appetite and trading style.
NOTE: This is not a piece of financial advice.

BCH Chartingchart pattern triangles. feel like long term trendline will break and lots of upside as alt season is just beginning.
Pullback in BitcoinCash Towards 580Trend Analysis
The main view of this trade idea is on the 15-Min Chart. The cryptocurrency BitcoinCash (BCH) is pulling back in the short term towards 580. There was some failure as the cryptocurrency attempted to break above 700 resistance. From there BCH formed a symmetrical triangle illustrated in the chart and broke below the support trend line. Expectations are for a decline towards 580. A negation of these expectations will be observed if BCH breaks above 675.
Technical Indicators
BCH recently had negative crossovers on the short and long term MAs as well as the medium and long term MAs. Currently the short (25-MA) MA is below the medium (75-MA) term MA and the medium term MA is below the long (200-MA) term MA. RSI is also below the 50 price level and the KST had a negative crossover
Recommendation
The recommendation will be to go short at market. Stop loss will be set around the 675 price level and a target of 580. This produces a risk-reward ratio of 1.69.
Disclaimer
The views expressed are mine and do not represent the views of my employers and business partners. Persons acting on these recommendations are doing so at their own risk. These recommendations are not a solicitation to buy or to sell but are for purely discussion purposes. At the time publishing, I have a position in BCH.

B-Cash, Descending-Channel, Potential Bull-Flag When Completed!Hello,
Welcome to this analysis about Bitcoin Cash, we are looking at the 4-hour timeframe perspectives. In recent times Bitcoin Cash has developed an interesting structure and especially with the formation I discovered here will have the ability to increase volatility and complete the formation with a substantial breakout, therefore it is necessary that Bitcoin Cash on the way shows up with the proper price-actions and does not move forward with developments that can invalidate the formation again, when this does not happen and Bitcoin Cash rightly finalizes the whole structure appropriately this can be the origin for great determinations, therefore I discovered all the important levels and upcoming determinations.
Structural Developments:
As when looking at my chart now we can watch there how Bitcoin Cash has emerged with this major descending-channel-formation marked in my chart with the black boundaries, within this formation Bitcoin Cash has established a coherent wave-count with the waves A to D already completed, now Bitcoin Cash is about to form the wave E in the structure and as marked in orange in my chart there is this local bear-pennant-formation that is building the local wave-B in the wave-count to the downside. When this local bear-pennant has been completed this will lead to Bitcoin Cash further increasing bearish price-action and continue with the wave-E-development till the lower levels are reached and the wave-count finalized.
Upcoming Determinations:
Once the wave-count has been finalized this will happen within the lower dynamic-support-and-target-zone marked in my chart in blue, there is a high likelihood given that when Bitcoin Cash reaches this zone a bounce within this structure will emerge as firstly the wave-count will be finished and secondly the substantial supports are given. When Bitcoin Cash manages to bounce appropriately within this structure and increase bullishness in a way that it finally completes a potential breakout above the upper-boundary of this whole channel it will be the setup for further continuations to the upside as the channel-formation will be completed as a bull-flag, it will be an interesting journey ahead.
In this manner, thank you for watching my analysis about BITCOIN CASH and the descending-channel-formation with the potential to complete as a bull-flag, support the analysis with a like and follow or comment for more market insight!
"Good luck is when opportunity meets preparation."
Information provided is only educational and should not be used to take action in the market.

Exactly as predicted! where will it go next?BCH followed my command, exactly as expected (See chart below)! We got a strong and decisive move back to the top of the channel, with huge trading volume. Where will it go next?

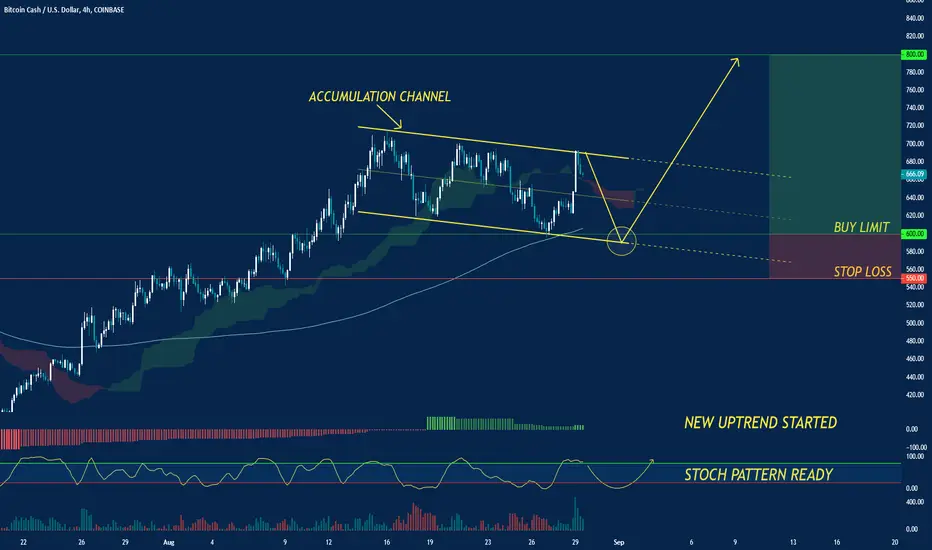
BCH/USD:UPTREND|TRIGGER READY FOR A NEW BUY OPPORTUNITY. $800 Today we analyze BCH / USD. In the last year this Crypto has been characterized by an increase in its value over 147%, in August the Value has risen by 25% after remaining within an accumulation channel where the price is bouncing harmoniously between the values 715 $ and 600 $. If we were to follow the technical analysis we would see further momentum around the $ 600 area which would trigger Bull Investors' Buy Limits again for further appreciation in value. Our fundamental vision for this Crypto, in the long term is bullish, data in hand. We hope for this new retracement opportunity to be able to buy more pieces.
Let me know what you think in the comments.
BchBig wedge. Hit lower support bounced… flagged at resiatnce the. Breakout. 694 resiatnce target 725. Breaking 695 is huge for BCH but has been key rejection point. Good example of what can be happing if this is a leading indicator.
