For those Who Can Hold for 4 weeksNice entry point seen on BCH. Not so "fashionable" coins could usher big moves as rest of the herd are after other meme coins. If you can hold this for few weeks, then have a go.
BCHUSD trade ideas
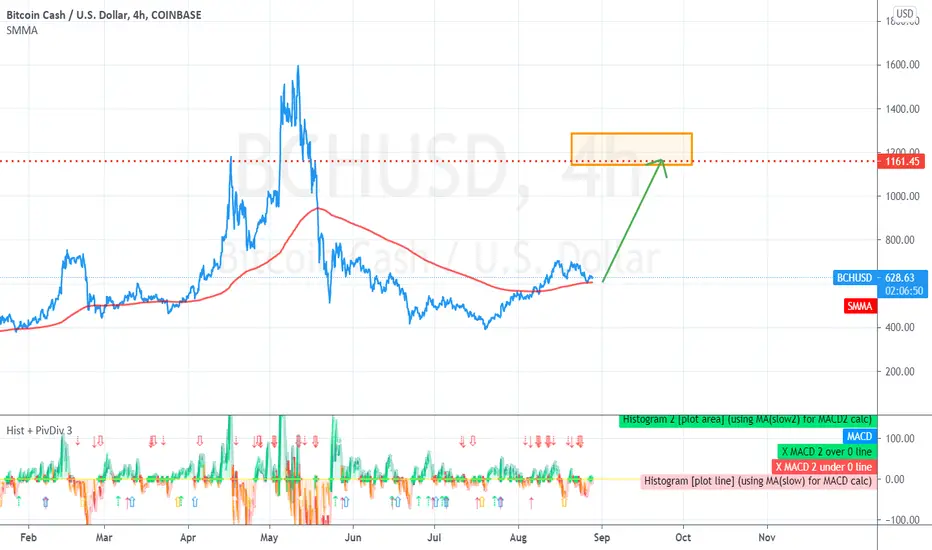
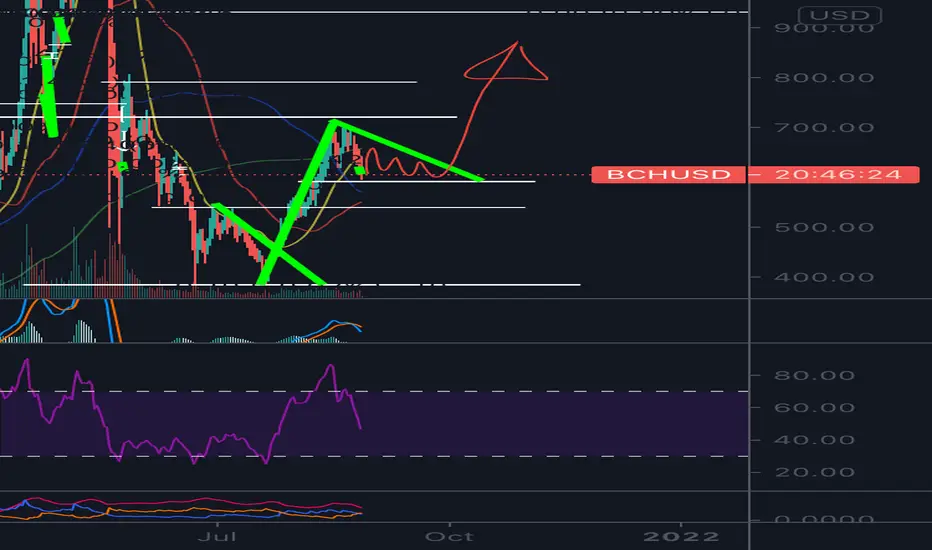
Bitcoin Cash Amazing Buy OpportunityDon’t miss out on this possible amazing buy opportunity.
Bitcoin cash, as well as other cryptos have been ona bullish run for the past weeks. Bitcoin Cash recently faced a temporary resistance that made price to complete a small bearish ab=cd pattern which turned to be a retracement on the daily/weekly timeframe. Yesterday, the price managed to find support at a previous area that has served as support in the past multiple times and managed to break above a small resistance on the lower timeframes and is currently now making it a support. If price manages to successfully break the major dynamic resistance created when it made the current higher timeframe high point (which should do because of overall trend), then expect a confirmation of a daily ab=cd pattern which could complete around the $1,000 price mark (marked on the charts). For those that are not in, could wait for a lower timeframe retracement and enter their positions or for those with bigger capital could enter now and stop loss should be below the previous 4hr swing low that was made. Good luck.

Bitcoin Cash (BCH) - August 28Hello?
Welcome, traders.
By "following", you can always get new information quickly.
Please also click "Like".
Have a nice day.
-------------------------------------
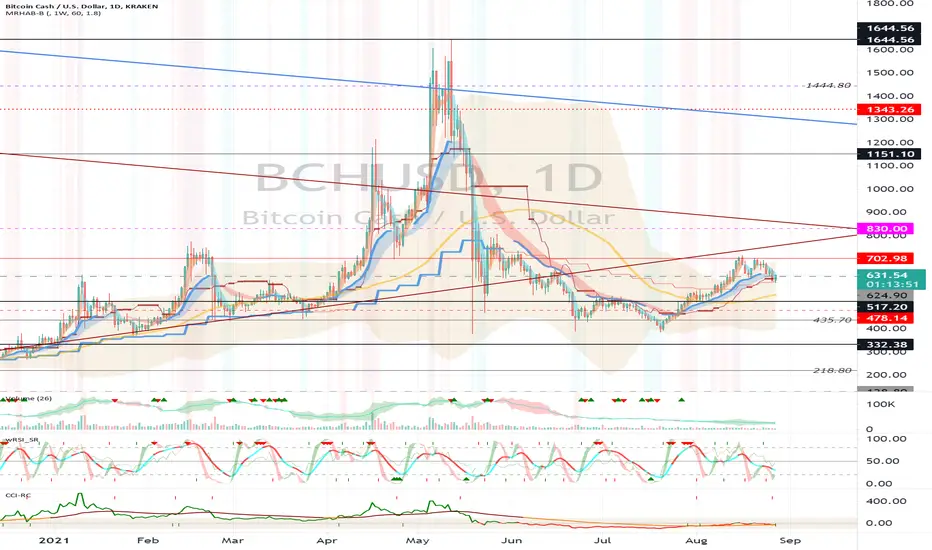
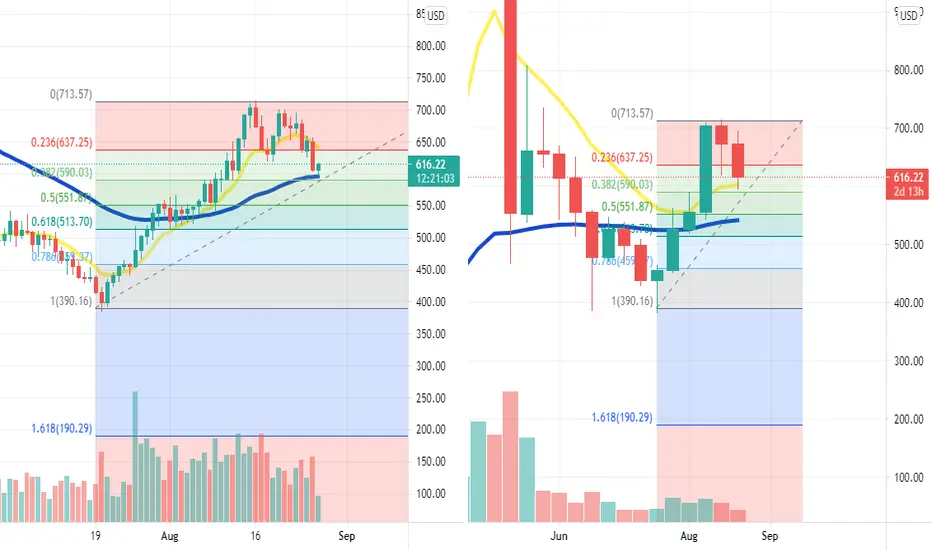
(BCHUSD 1W Chart)
If the price is maintained above the 435.70-517.20 range, it is expected that the uptrend will continue.
In particular, if the price is maintained above the 627.90-702.98 range, it is expected to create a new wave.
(1D chart)
We need to make sure we can get support at the 624.90 point.
If they move down from the 624.90 point, we need to see if there is support at the 517.20 point.
If the price is maintained above the 702.98 point, I would expect a move to break out of the downtrend line.
If it falls in the 435.70-517.20 section, it is possible to enter the mid- to long-term investment area, so careful trading is required.
If possible, we are trying to publish both a USD chart (USDT chart) and a BTC chart at the same time.
The way you view the chart is different from the USD (USDT) chart and the BTC chart.
As the size of the coin market grows, most exchanges have started trading in the USD or USDT market, so I think that there is a possibility that it will disappear gradually because the proportion of transactions in the BTC market coin market is getting smaller.
However, since the BTC market is currently active, I do not believe that the chart of this BTC market can be ignored.
Since BTC price has high volatility, if the BTC price rises, the price chart of individual tokens such as BTC coin, that is, tokens traded in the BTC market, will decrease accordingly.
However, there are charts that do not.
This should be seen as a price defense as there are a lot of trades taking place.
This price defense is likely to lead to a big rise when the BTC price goes sideways, so I think it can be used as an indicator for trading individual tokens such as BCH tokens according to the BTC price trend.
-------------------------------------
(BCHBTC 1W chart)
(Full chart: )
It must rise above 0.02444-0.03406 to create a new wave.
Below the 0.02879 point, the bottom section is considered to be in the long-term investment area.
Accordingly, you should take your time and think about your plans for long-term investments.
(1D chart)
It remains to be seen if the price can sustain by moving up towards the 0.01466-0.01606 range.
In particular, it is necessary to ensure that there is support at the 0.01278 point.
It must rise above the 0.01606 point to turn into an uptrend.
------------------------------------------
We recommend that you trade with your average unit price.
This is because, if the price is below your average unit price, whether it is in an uptrend or in a downtrend, there is a high possibility that you will not be able to get a big profit due to the psychological burden.
The center of all trading starts with the average unit price at which you start trading.
If you ignore this, you may be trading in the wrong direction.
Therefore, it is important to find a way to lower the average unit price and adjust the proportion of the investment, ultimately allowing the funds corresponding to the profits to regenerate themselves.
------------------------------------------------------------ -----------------------------------------------------
** All indicators are lagging indicators.
Therefore, it is important to be aware that the indicator moves accordingly with the movement of price and volume.
However, for the sake of convenience, we are talking in reverse for the interpretation of the indicator.
** The wRSI_SR indicator is an indicator created by adding settings and options to the existing Stochastic RSI indicator.
Therefore, the interpretation is the same as the traditional Stochastic RSI indicator. (K, D line -> R, S line)
** The OBV indicator was re-created by applying a formula to the DepthHouse Trading indicator, an indicator disclosed by oh92. (Thanks for this.)
** See support, resistance, and abbreviation points.
** Support or resistance is based on the closing price of the 1D chart.
** All descriptions are for reference only and do not guarantee a profit or loss in investment.
Explanation of abbreviations displayed in the chart
R: A point or section of resistance that requires a response to preserve profits.
S-L: Stop Loss point or section
S: A point or section where you can buy to make a profit as a support point or section.
(Short-term Stop Loss can be said to be a point where profit and loss can be preserved or additional entry can be made through split trading. It is a short-term investment perspective.)
GAP refers to the difference in prices that occurred when the stock market, CME, and BAKKT exchanges were closed because they are not traded 24 hours a day.
G1 : Closing price when closed
G2: Opening price
(Example) Gap (G1-G2)
Bitcoin Cash (BCH/USD) 1W: Elliott Wave Analysis (Update)👋 Hello and welcome traders to another trade idea with SunnyHillCapital
☝️ Firstly, if you like what you see, please support our work by writing a comment and SMASH that like button! 👍 Let's catch these moves together! ✅
💡 Why should you follow our profile on TradingView?
Consistent chart updates
Clean charts
Short and long-term perspectives
Visually teaches you valuable lessons
High probability setups
Analysis on a wide range of major markets
SMASH that follow button! 👍
💡 Leave a comment and/or message us on how we can improve and provide better content, we are open to suggestions to create a better experience for you!
Keep in mind that the analysis provided is not 100% accurate and that you can never be certain with the markets. This information given is not financial advice, always do your own research.
Thank you for reading,
Cheers to many pips! 🤝
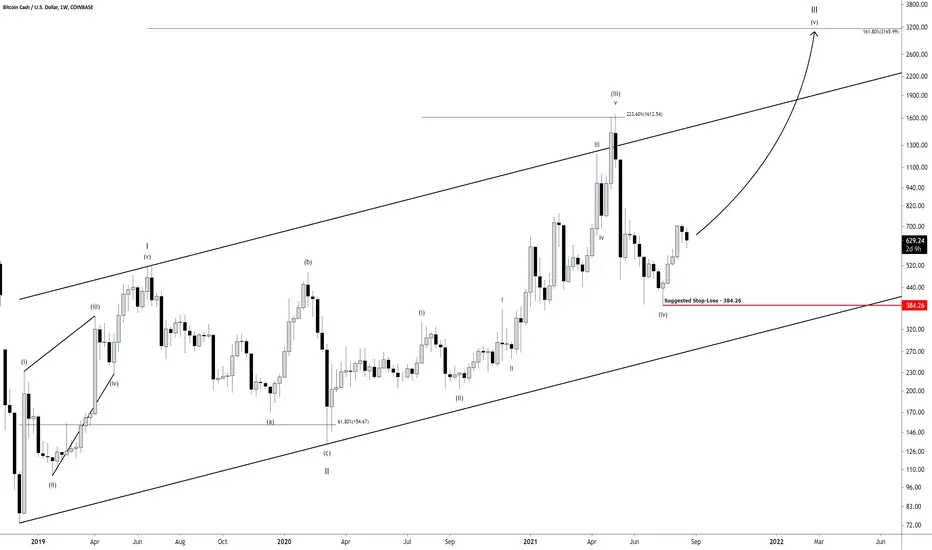
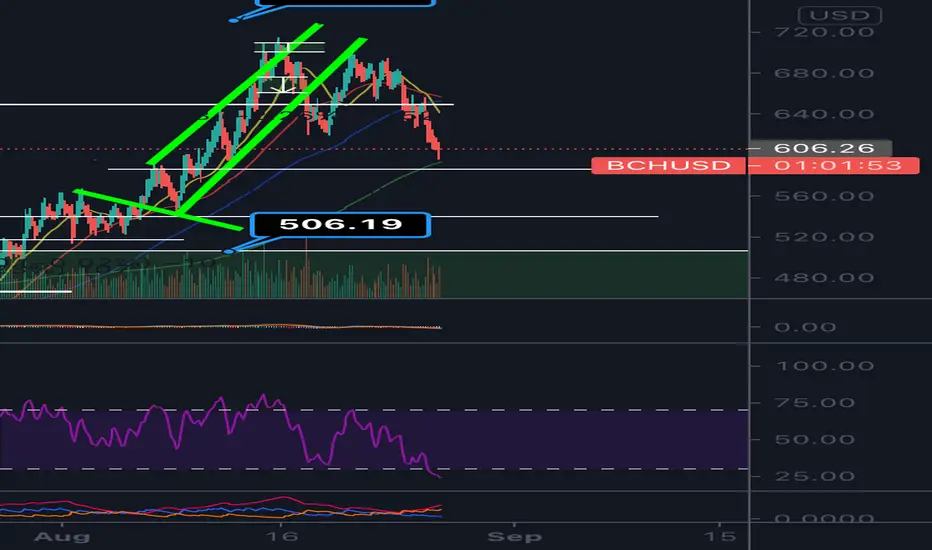
Will Bitcoin Cash Continue Its Run?The daily & weekly chart are extremely bullish.
After price rallied we had a pullback on light volume which shows low seller interest.
Price pulled back to the 50day moving average on the daily chart and is also holding the 38% Fibonacci at the same level.
On the weekly chart we had 2 weeks of decreasing volume as we approached the 10 day moving average support.
From my perspective both daily & weekly chart show a demand zone to add long.
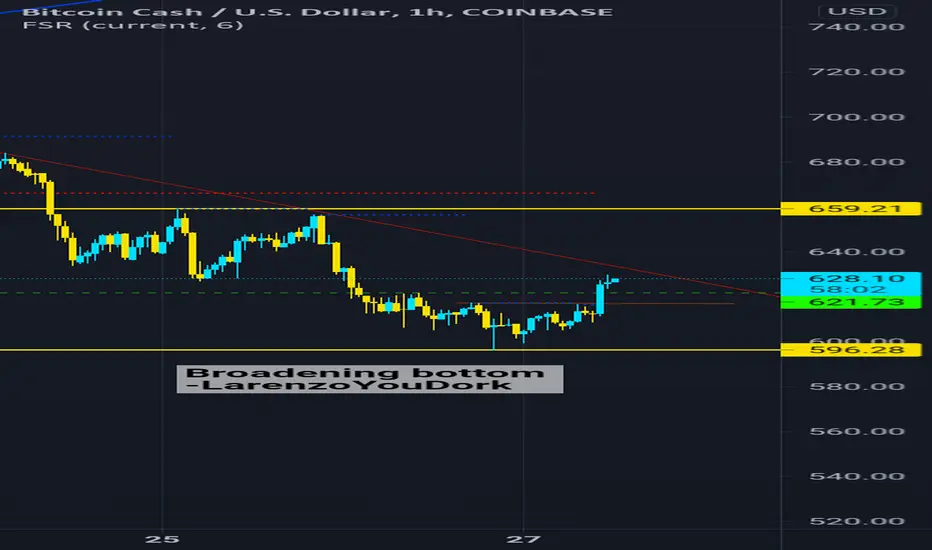
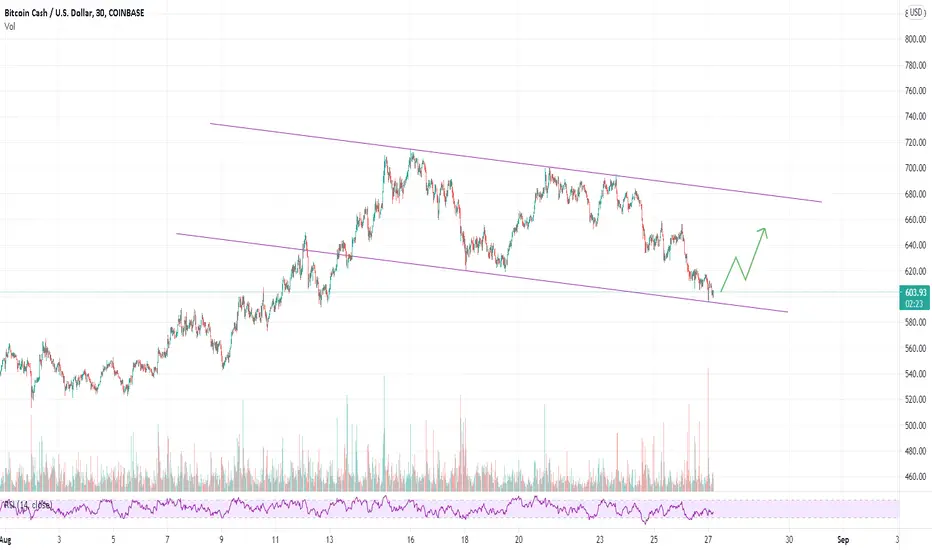
Descending channel - Buy the bounce?I would normally avoid trying to catch a falling knife, but it looks like we caught fairly strong support at exactly the level needed to form a descending channel, which, if it holds, means its up from here. Lets see!
Bch idea Recent peak after big breakout. Time for considlation ? Lower support 588-593. Descending triangle/ bull pennant idea here. Way to early to say for certain. Could we be attempting something of this idea ? Will check with this idea in a few days. Buying some bCH here
BchMust HOLd 4hour 200 ema support 592ish.
Might be worth a long postion. Next support I have below that if we even just wicked, would land 586. In intreeged
Pull Back FishingPost ARC and has fallen a bit beyond the .886 down to 384.26 at the low. Double bottom for now. The bulls made a stand at this level.
Most arcs pull to between the .5 and .782 with the average being between the .618 and the .782. This one pulled a bit further. An ARC is not predictable and can be volatile for a while after coming back down.
Negative volume is high showing big money interest. Price is over the 50 SMA which is sloping up.
No recommendation

Golden cross in Bitcoin cash* Golden cross appeared in Bitcoin cash in 1D time frame.
* Golden occurs when the short term (50 EMA) Exponential moving average crosses above the long term (200 EMA) exponential moving average.
* It indicates the long term bull run.
* Exponential moving average ( EMA ) is also a type of weighted moving average technical chart indicator which mainly prefer recent price data.

BCH building a big pattern!BCH is the smaller brother of BTC, and also very bullish on the long term. Here we can see that BCH si following a big broadening wedge.
bye.

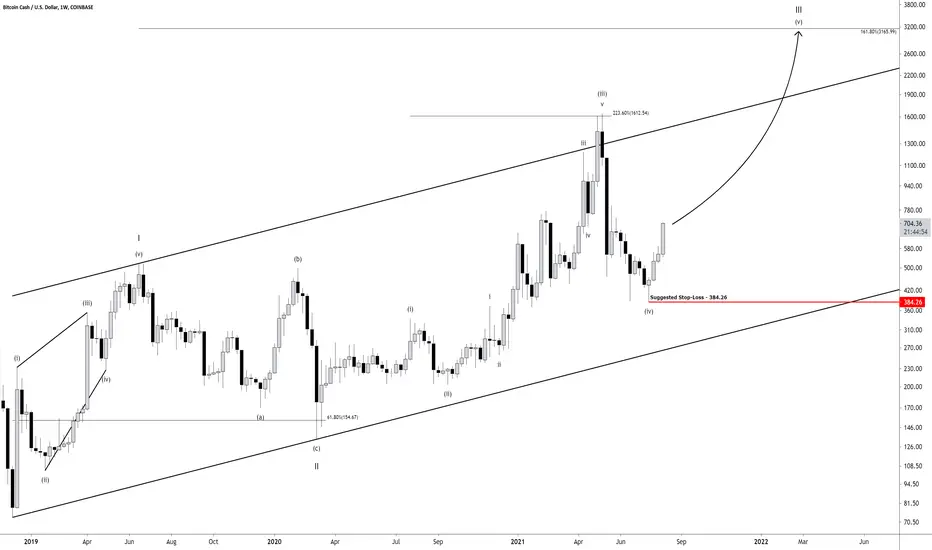
Bitcoin Cash 1W: Elliott Wave Analysis (Update)👋 Hello and welcome traders to another trade idea with SunnyHillCapital
☝️ Firstly, if you like what you see, please support our work by writing a comment and SMASH that like button! 👍 Let's catch these moves together! ✅
💡 Why should you follow our profile on TradingView?
Consistent chart updates
Clean charts
Short and long-term perspectives
Visually teaches you valuable lessons
High probability setups
Analysis on a wide range of major markets
SMASH that follow button! 👍
💡 Leave a comment and/or message us on how we can improve and provide better content, we are open to suggestions to create a better experience for you!
Keep in mind that the analysis provided is not 100% accurate and that you can never be certain with the markets. This information given is not financial advice, always do your own research.
Thank you for reading,
Cheers to many pips! 🤝

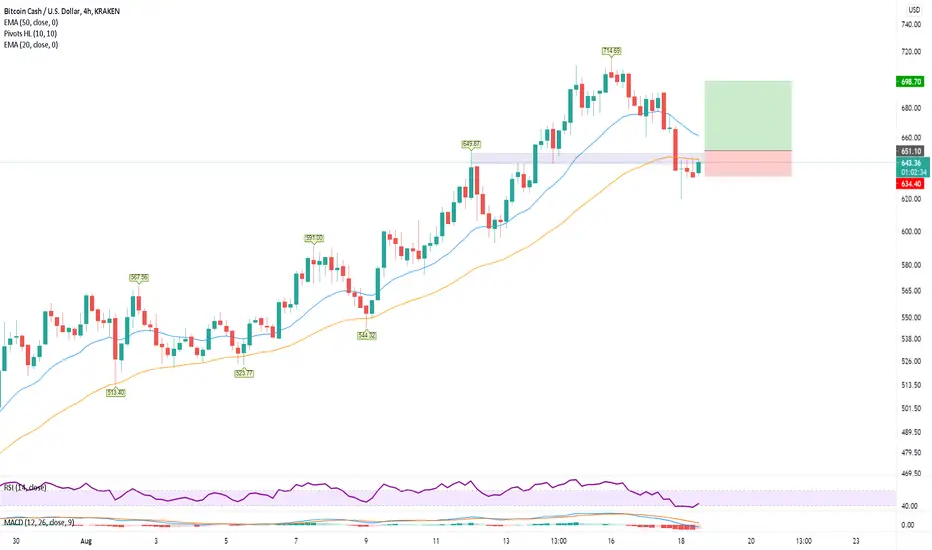
BCH Buy a break setup.BCHUSD - Intraday - We look to Buy a break of 651.1 (stop at 634.4)
Pivot resistance is at 649.9.
A break of bespoke resistance at 650.0, and the move higher is already underway.
Daily signals are bullish.
Our profit targets will be 698.7 and 707.7
Resistance: 650.0 / 670.0 / 690.0
Support: 630.0 / 615.0 / 600.0
BchReloaded here 626$. Let’s see how this trade goes. Looks to be solid support here seems logical to jump in a small position. We lose this 594 will be next

BchHit my first support are of 661
If we lost that 650 should be monster support ! Loosing that would be a pretty good short postion

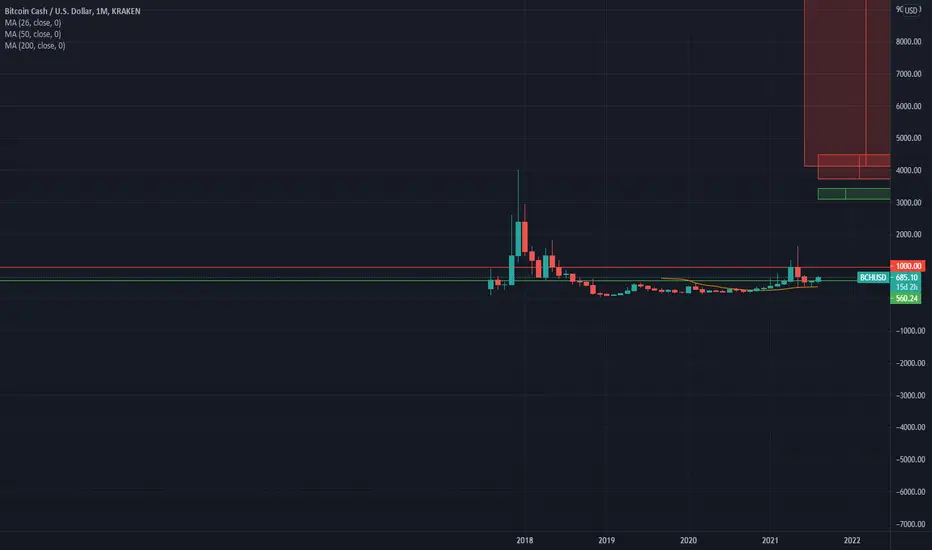
BCH Starts it C LegWith the second leg just starting the last ATH is a given & $4k is a conservative target. Potential is there to reach as high as $12k but I'll be taking profits at 4k & be happy with 8x with no stress :)
Bitcoin Cash 1W: Elliott Wave Analysis👋 Hello and welcome traders to another trade idea with SunnyHillCapital
☝️ Firstly, if you like what you see, please support our work by writing a comment and SMASH that like button! 👍 Let's catch these moves together! ✅
💡 Why should you follow our profile on TradingView?
Consistent chart updates
Clean charts
Short and long-term perspectives
Visually teaches you valuable lessons
High probability setups
Analysis on a wide range of major markets
SMASH that follow button! 👍
💡 Leave a comment and/or message us on how we can improve and provide better content, we are open to suggestions to create a better experience for you!
Keep in mind that the analysis provided is not 100% accurate and that you can never be certain with the markets. This information given is not financial advice, always do your own research.
Thank you for reading,
Cheers to many pips! 🤝
BCH wants 900Bcash or trash gearing up here.
Possibly 30% gain on this in short term then a dump to 0.01.
Good luck and God speed.
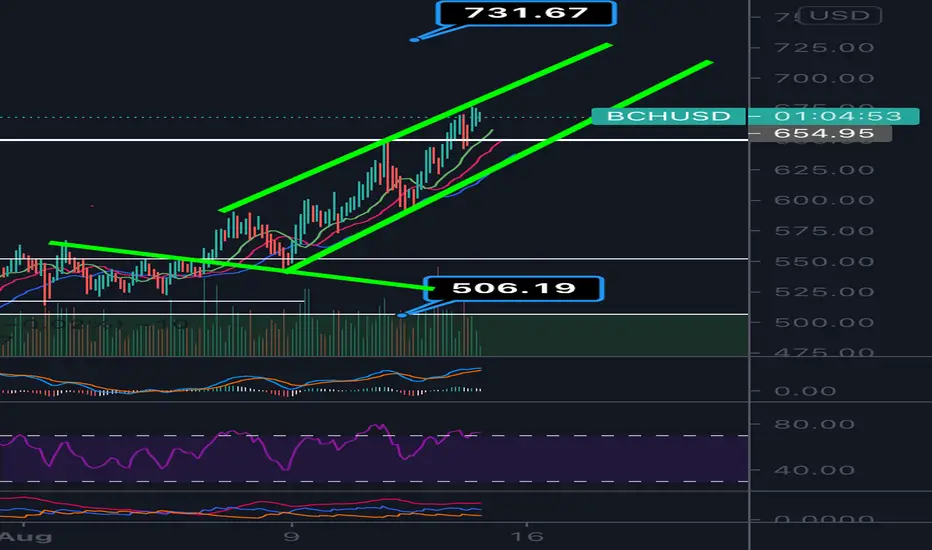
BchTarget 737 but seems we are in a rising channel upper resistance 676-682… lower support 643 low. 650 would be absolutely insane to hold if we were to lose momentum here and fall while still mainting this channel
BCH - What happens next? Hi, this is my new update for BCH. In the last 3 weeks BCH has risen around 70%, but now we have broken the resistance 650$, SMA100 and SMA200. If we close todays candle above 650$, then we are good to go and the next target is 710-720$. We have 3 resistances between 720-840$, but once we break all of them, then we have a big gap to fill it up between 860-1050$ (Easy gains). Compared to the total market cap, BCH must be around 900$, but unfortunately BCH is always lagging behind. So be patient and don't panic ;)

be ready for at least 80% profits 🚀right now possibly we may correct shortly but nothing to worry about.
1- the price returns back to close above EMA 50.
2- the candle body is getting bigger each week. (momentum increasing)
3- as soon as BTC is showing strength for goin up, it gives good indicator for seeing higher highs n lower lows.
🔶🔶FREE MIDTERM VIP SIGNAL🔶🔶
Pair: BCH/USDT
✅ BUY: 570 - 650 ✅
🎯 Targets:-
1- $700
2- $805
3- $975
4- $1200
5- $1420
6- $1640
STOP LOSS: $530
